Featured Trading Strategies
Explore our most popular and effective trading strategies, tested and refined by professionals worldwide.

Count:32487
Name: Bollinger + RSI, Double Strategy (by ChartArt) v1.1
Description: This strategy uses the RSI indicator together with the Bollinger Bands to sell when the price is above the upper Bollinger Band (and to buy when this value is below the lower band). This simple strategy only triggers when both the RSI and the Bollinger Band indicators are at the same time in a overbought or oversold condition. UPDATE In this updated version...

Count:20205
Name: MACD + SMA 200 Strategy (by ChartArt)
Description: Here is a combination of the classic MACD (moving average convergence divergence indicator) with the classic slow moving average SMA with period 200 together as a strategy. This strategy goes long if the MACD histogram and the MACD momentum are both above zero and the fast MACD moving average is above the slow MACD moving average. As additional long filter the...

Count:15281
Name: SuperTrend STRATEGY
Description: STRATEGY version of SuperTrend Indicator: SuperTrend is one of the most common ATR based trailing stop indicators. In this version you can change the ATR calculation method from the settings. Default method is RMA, when the alternative method is SMA . The indicator is easy to use and gives an accurate reading about an ongoing trend. It is constructed with two...

Count:13196
Name: PMax Explorer STRATEGY & SCREENER
Description: Profit Maximizer - PMax Explorer STRATEGY & SCREENER screens the BUY and SELL signals (trend reversals) for 20 user defined different tickers in Tradingview charts. Simply input the name of the ticker in Tradingview that you want to screen. Terminology explanation: Confirmed Reversal: PMax reversal that happened in the last bar and cannot be...

Count:10433
Name: GetTrendStrategy
Description: A simple strategy is to determine the trend. Do not use it for real-time transactions. Use it as a Reaffirmation trade entry.

Count:9363
Name: 3Commas Bot
Description: Bjorgum 3Commas Bot A strategy in a box to get you started today With 3rd party API providers growing in popularity, many are turning to automating their strategies on their favorite assets. With so many options and layers of customization possible, TradingView offers a place no better for young or even experienced coders to build a platform from to meet...

Count:9021
Name: Ichimoku + Daily-Candle_X + HULL-MA_X + MacD
Description: Ichimoku_cloud + Daily-Candle_cross(DT) + HuLL-MovingAverage_cross + MacD any timeframe, all indicators settings adjustable for fine tuning to pair/timeframe Target Point and Stop Loss settings set SL low to reduce repaint
Count:8813
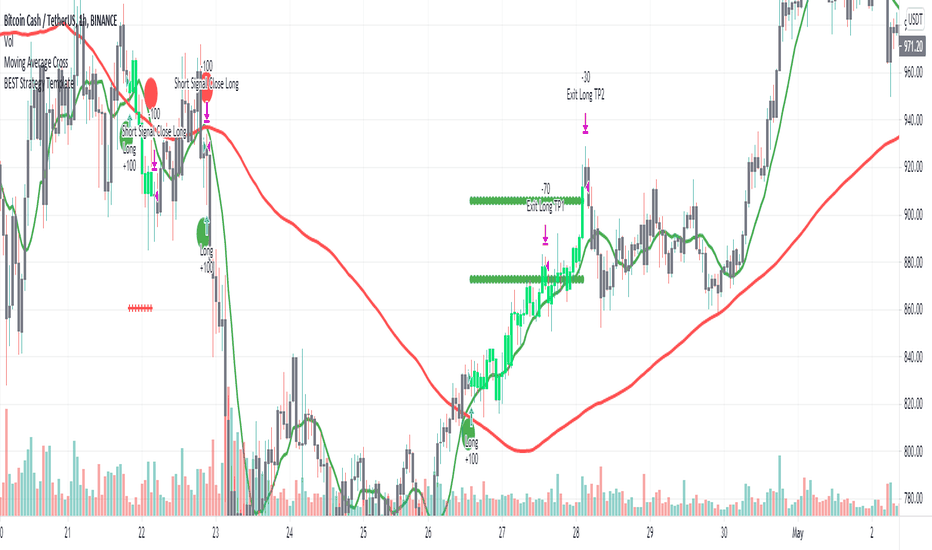
Name: Ultimate Strategy Template
Description: Hello Traders As most of you know, I'm a member of the PineCoders community and I sometimes take freelance pine coding jobs for TradingView users. Off the top of my head, users often want to: - convert an indicator into a strategy, so as to get the backtesting statistics from TradingView - add alerts to their indicator/strategy - develop a generic strategy...

Count:8512
Name: Flawless Victory Strategy - 15min BTC Machine Learning Strategy
Description: Hello everyone, I am a heavy Python programmer bringing machine learning to TradingView. This 15 minute Bitcoin Long strategy was created using a machine learning library and 1 year of historical data in Python. Every parameter is hyper optimized to bring you the most profitable buy and sell signals for Bitcoin on the 15min chart. The historical Bitcoin data was...

Count:7704
Name: Golden Cross, SMA 200 Moving Average Strategy (by ChartArt)
Description: This famous moving average strategy is very easy to follow to decide when to buy (go long) and when to take profit. The strategy goes long when the faster SMA 50 (the simple moving average of the last 50 bars) crosses above the slower SMA 200. Orders are closed when the SMA 50 crosses below the SMA 200. This simple strategy does not have any other stop loss or...

Count:7578
Name: ANN Strategy v2
Description: This is version 2 of my ANN strategy. This version will not repaint, but requires some settings configuration. The reason why the old version repainted, is because it used the daily OHLC/4 which kept changing, causing lower timeframes ro repaint. You can now specify which timeframes to use. The bigger timeframe is set in the settings (e.g. 1 day). You set the...

Count:7376
Name: Buy&Sell Strategy depends on AO+Stoch+RSI+ATR by SerdarYILMAZ
Description: This strategy is just for training, its purpose is just learning code in pine script. Don't make buy or sell decision with this strategy. Turkish/Turkce Bu strateji sadece pine script'te kodlamanın nasıl yapildigini ogrenmek icindir. Bu stratejiye dayanarak, kesinlikle al-sat islemleri yapmayin. How it works? When RSI and Stoch are in oversold area and if...

Count:7057
Name: Hull Suite Strategy
Description: Converted the hull suite into a strategy script for easy backtesting and added ability to specify a time periods to backtest over.

Count:7041
Name: Open Close Cross Strategy R5 revised by JustUncleL
Description: This revision is an open Public release, with just some minor changes. It is a revision of the Strategy "Open Close Cross Strategy R2" originally published by @JayRogers. *** USE AT YOUR OWN RISK *** JayRogers : "There are drawing/painting issues in pinescript when working across resolutions/timeframes that I simply cannot fix here.. I will not be putting any...

Count:6579
Name: Twin Optimized Trend Tracker Strategy TOTT
Description: Anıl Özekşi's new strategy which is a combination of 2 Optimized Trend Tracker lines which are vertical displaced from original version with a COEFFICIENT to cope with sideways' false signals which he explained in "Toy Borsacı İçin OTT Kullanım Kılavuzu 2" original version of OTT: OTT Strategy and Screener: You can find a detailed explanation with subtitles...

Count:6326
Name: Bollinger + RSI, Double Strategy Long-Only (by ChartArt) v1.2
Description: This strategy uses the RSI indicator together with the Bollinger Bands to go long when the price is below the lower Bollinger Band (and to close the long trade when this value is above the upper Bollinger band). This simple strategy only places a long, when both the RSI and the Bollinger Bands indicators are at the same time in a oversold condition. In this new...

Count:6323
Name: MACD ReLoaded STRATEGY
Description: STRATEGY version of MACD ReLOADED Indicator: A different approach to Gerald Appel's classical Moving Average Convergence Divergence. Appel originaly set MACD with exponential moving averages. In this version users can apply 11 different types of moving averages which they can benefit from their smoothness and vice versa sharpnesses... Built in Moving Average...

Count:6257
Name: Fractal Breakout Strategy (by ChartArt)
Description: This long only strategy determines the price of the last fractal top and enters a trade when the price breaks above the last fractal top. The strategy also calculates the average price of the last fractal tops to get the trend direction. The strategy exits the long trade, when the average of the fractal tops is falling (when the trend is lower highs as measured by...

Count:6075
Name: 20 years old Turtles strategy still work!!
Description: original idea from «Way of the Turtle: The Secret Methods that Turned Ordinary People into Legendary Traders» (2007) CURTIS FAITH

Count:5895
Name: TradingView Alerts to MT4 MT5 + dynamic variables NON-REPAINTING
Description: Accidentally, I’m sharing open-source profitable Forex strategy. Accidentally, because this was aimed to be purely educational material. A few days ago TradingView released a very powerful feature of dynamic values from PineScript now being allowed to be passed in Alerts. And thanks to TradingConnector, they could be instantly executed in MT4 or MT5 platform of...

Count:5756
Name: MACD + Stochastic, Double Strategy (by ChartArt)
Description: This strategy combines the classic stochastic strategy to buy when the stochastic is oversold with a classic MACD strategy to buy when the MACD histogram value goes above the zero line. Only difference to the classic stochastic is a default setting of 71 for overbought (classic setting 80) and 29 for oversold (classic setting 20). Therefore this strategy goes...

Count:5673
Name: Optimized Trend Tracker STRATEGY & SCREENER
Description: Optimized Trend Tracker - OTT STRATEGY & SCREENER screens the BUY and SELL signals (trend reversals) for 20 user defined different tickers in Tradingview charts. Simply input the name of the ticker in Tradingview that you want to screen. Terminology explanation: Confirmed Reversal: OTT reversal that happened in the last bar and cannot be repainted. Potential...

Count:5299
Name: Stochastic + RSI, Double Strategy (by ChartArt)
Description: This strategy combines the classic RSI strategy to sell when the RSI increases over 70 (or to buy when it falls below 30), with the classic Stochastic Slow strategy to sell when the Stochastic oscillator exceeds the value of 80 (and to buy when this value is below 20). This simple strategy only triggers when both the RSI and the Stochastic are together in a...

Count:5133
Name: RSI Divergence Indicator strategy
Description: This strategy is based on RSI divergence indicator. RSI period setting 5 Go Long when Bull or Hidden Bull is shown Exit when RSI goes above 75 OR when bear condition appears

Count:5033
Name: Daily Close Comparison Strategy (by ChartArt via sirolf2009)
Description: Comparing daily close prices as a strategy. This strategy is equal to the very popular "ANN Strategy" coded by sirolf2009(1) which calculates the percentage difference of the daily close price, but this bar-bone version works completely without his Artificial Neural Network (ANN) part. Main difference besides stripping out the ANN is that my version uses...

Count:4856
Name: Bollinger + RSI, Double Strategy (by ChartArt)
Description: Bollinger Bands + RSI, Double Strategy This strategy uses a slower RSI with period 16 to sell when the RSI increases over the value of 55 (or to buy when the value falls below 45), with the classic Bollinger Bands strategy to sell when the price is above the upper Bollinger Band and falls below it (and to buy when the price is below the lower band and rises...

Count:4793
Name: EMA Slope + EMA Cross Strategy (by ChartArt)
Description: This strategy uses divergences between three exponential moving averages and their slope directions as well as crosses between the price and these moving averages to switch between a long or short position. The strategy is non-stop in the market and always either long or short. In addition the moving averages and price bars are colored depending if they are...

Count:4705
Name: How To Set Backtest Date Range
Description: Example how to select and set date range window to be backtested. Normally when you change chart period it changes the number of days being backtested which means as you increas the chart period (for example from 5min to 15min) you also increase the number of days traded, so you can not compare apples to apples for which period would yield best returns for your...

Count:4613
Name: Vix FIX / StochRSI Strategy
Description: This strategy is based off of Chris Moody's Vix Fix Indicator . I simply used his indicator and added some rules around it, specifically on entry and exits. Rules : Enter upon a filtered or aggressive entry If there are multiple entry signals, allow pyramiding Exit when there is Stochastic RSI crossover above 80 This works great on a number of...

Count:4548
Name: AlphaTrend Strategy
Description: The strategy version of AlphaTrend indicator for backtesting and optimisation purposes for TradingView users: Screener / Explorer version and an English explantion video will be published soon... AlphaTrend's parameters are designed for daily and 4H charts, feel free to optimize on all time frames. Hope you all use Alphatrend in your profitable trades. Kıvanç

Count:4538
Name: Open Close Cross Strategy NoRepaint Version by JustUncleL
Description: This is a Non Repaint version of my ever popular "Open Close Cross Strategy R5 revised by JustUncleL". After many comments/PMs on repainting issues of the original script, I decided to create this Non Repaint version for those that require non-repainting signals. Backtesting performance will not be as good as the repaint version, but some script maybe still...

Count:4438
Name: Bjorgum Double Tap
Description: █ OVERVIEW Double Tap is a pattern recognition script aimed at detecting Double Tops and Double Bottoms. Double Tap can be applied to the broker emulator to observe historical results, run as a trading bot for live trade alerts in real time with entry signals, take profit, and stop orders, or to simply detect patterns. █ CONCEPTS How Is A Pattern...

Count:4283
Name: Pivot Point SuperTrend [Backtest]
Description: Hello All, This is backtesting result of following indicator/strategy. I didn't work on adding other indicators. maybe in the future I can try to combine this with other indicators. You can visit following link to see "Pivot Point SuperTrend" . by using this backtesting tool, you can test&find better options There is option "Use Center Line to Close Entry...

Count:4218
Name: BEST Trend Direction Helper (Strategy Edition)
Description: Hello traders A follower asked me to convert my Trend Direction Helper into a strategy So blessed this indicator reached the 1400+ likes milestone - I can't believe how many people are trading with it I based the setup as follow: - Entries on those green/red labels - exit whenever a Simple Moving Averages cross in the opposite direction happen -...

Count:4085
Name: Backtesting 3commas DCA Bot v2
Description: Updating previously published simulated 3commas DCA logic with a sexier insert and more meaningful default parameters.

Count:4022
Name: Trailing SL Strategy [QuantNomad]
Description: I'm a big fan of simple strategies. This one is a very simple one. So it consists only from one Trailing SL. When SL is hit, the position is reversed and SL is tracked for a new position. You can choose one of 3 types of SL: % of your price ATR - it is calculated as current ATR * multiplier Absolute As you can see even this simple strategy can show...

Count:3990
Name: [STRATEGY][RS]ZigZag PA Strategy V4.1
Description: EXPERIMENTAL: WARNING: this strategy repaints after reloading and results are heavily curve fitted, use at your own discretion. UPDATE: (AleksanderThor) add option for a 2nd target, to use you need to activate pyramiding with a setting of 1 manually (not possible to change programatically) .

Count:3820
Name: UT Bot Strategy
Description: UT Bot indicator was inially developer by @Yo_adriiiiaan Idea of original code belongs @HPotter I just took code of Yo_adriiiiaan, cleaned it, deleted all useless pieces of code, transformet to v4 and created a strategy from it. Also I added an input that allows you to swich to signals from Heiking Ashi. I saw that author uses HA for the indicator and on HA it...

Count:3703
Name: [STRATEGY][RS]MicuRobert EMA cross V2
Description: Great thanks Ricardo , watch this man . Start at 2014 December with 1000 euro.

Count:3669
Name: Moon Phases Strategy [LuxAlgo]
Description: Trading moon phases has become quite popular among traders, believing that there exists a relationship between moon phases and market movements. This strategy is based on an estimate of moon phases with the possibility to use different methods to determine long/short positions based on moon phases. Note that we assume moon phases are perfectly periodic with a...

Count:3575
Name: RSI versus SMA (no repaint)
Description: *** USE AT YOUR OWN RISK *** Nothing is perfect, and all decisions by you are on your own head. And stuff. Description: It's RSI versus a Simple Moving Average.. Not sure it really needs much more description. Should not repaint - Automatically offsets by 1 bar if anything other than "open" selected as RSI source. ...sometimes smashing things...

Count:3555
Name: Super Trend Daily 2.0 BF 🚀
Description: This is my Super Trend Daily strategy but with one important difference. You can now adjust settings for long or short signals individually and separately. For example, the condition for a long signal may require a different parameter setting than the condition for a short signal. Each parameter in the signal generation can be tuned. You can also decide what kind...

Count:3526
Name: Strategy Code Example - Risk Management
Description: *** THIS IS JUST AN EXAMPLE OF STRATEGY RISK MANAGEMENT CODE IMPLEMENTATION *** For my own future reference, and for anyone else who needs it. Pine script strategy code can be confusing and awkward, so I finally sat down and had a little think about it and put something together that actually works (i think...) Code is commented where I felt might be necessary...

Count:3510
Name: RSI-VWAP INDICATOR
Description: This simple indicator provides great results. It is the popular RSI indicator with VWAP as a source instead of close. What is the Volume Weighted Average Price (VWAP)? VWAP is calculated by adding up the dollars traded for every transaction (price multiplied by the number of shares traded) and then dividing by the total shares traded. That is, volume. On the...

Count:3506
Name: VWAP + Fibo Dev Extensions Strategy
Description: Based on my VWAP + Fibo deviations indicator, I tested some strategies to see if the indicator can be profitable; and I got it ! This strategy uses: H1 timeframe Weekly VWAP +1.618 / +2.618 / -1.618 / -2.618 Deviations Extensions to create 2 bands The value of the deviation First, the 2 bands are plotted : +1.618/+2.618 painted in red and -1.618/-2.618...

Count:3499
Name: Hammers & Stars Strategy
Description: Overview This script trades basic hammer and shooting star candlestick patterns. It's an extremely simple strategy with minimal filters, and according to my personal manual backtesting and automated trading results, performs best on the Daily chart on certain forex pairs. It is intended to be traded on the forex markets but theoretically should work on all...

Count:3395
Name: [STRATEGY][UL]Price Divergence Strategy v1.0
Description: Created by Request: This is a trend trading strategy that uses Price Divergence detection signals that are confirmed by the "Murrey's Math Oscillator" (Donchanin Channel based). Strategy Code Based on: Price Divergence Detector V2 by RicardoSantos UCS_Murrey's Math Oscillator by Ucsgears Strategy Risk Management Based on: Strategy Code Example by...

Count:3377
Name: Moving Average Cross and/or Bbands bot
Description: Hello TradingView and world! This is one of our latest concepts for an actual bot builder. This script comes with a bunch of features that we're hoping will alleviate a lot of the stress and confusion around using and building strategies here on TV. Especially if the end-goal is to automate the strategies using Autoview. This is a combination of 2 strategies,...

Count:3356
Name: 72s Strat: Backtesting Adaptive HMA+ pt.1
Description: This is a follow up to my previous publication of Adaptive HMA+ few months ago, as a mean to provide some kind of initial backtesting tools. Which can be use to explore many possible strategies, optimise its settings to better conform user's pair/tf, and hopefully able to help tweaking your general strategy. If you haven't read the study or use the indicator,...

Count:3305
Name: Bollinger Band with RSI
Description: Using combination bollinger band and RSI indicator as guide to predict price volatility and the best entry point. The strategy logic is pretty straightforward where we're interested with close price that touches the lower bollinger band ; there are only two scenarios that will happened after the price reaches the lower band; the price might rebound from the lower...

Count:3287
Name: Backtest Adapter
Description: This is a proof-of-concept Backtest Adapter that can be used with my recent publication "Machine Learning: Lorentzian Classification" located here: This adapter is helpful because it enables interactive backtesting with TradingView's built-in "Strategy Tester" framework without the need to translate the logic from an "indicator" script to a "strategy"...

Count:3123
Name: Full CRYPTO pack macd, rsi, obv, ema strategy
Description: This is a simple, yet very efficient crypto strategy, adapted to 4h time frame, on big coins like ETH and BTC. However it can be adapted to other markets, timeframes etc For this strategy I use a combination of a trend line, an oscillator, price action and volume. This strategy has both the opportunity to go long and short. As well, it has a leverage simulator...

Count:3119
Name: BEST Engulfing + Breakout Strategy
Description: Hello traders This is a simple algorithm for a Tradingview strategy tracking a convergence of 2 unrelated indicators. Convergence is the solution to my trading problems. It's a puzzle with infinite possibilities and only a few working combinations. Here's one that I like - Engulfing pattern - Price vs Moving average for detecting a breakout Definition...

Count:3015
Name: Full strategy AllinOne with risk management MACD RSI PSAR ATR MA
Description: Hey, I am glad to present you one of the strategies where I put a lot of time in it. This strategy can be adapted to all type of timecharts like scalping, daytrading or swing. The context is the next one : First we have the ATR to calculate our TP/SL points. At the same time we have another rule once we enter(we enter based on % risk from total equity, in this...

Count:3008
Name: Grab Trading System
Description: Hello All, This is "Grab Trading System" script defined in the book "Trend Following" by Michael W. Covel. also named as "Two-box system". I made small changes and I guess that it can be improved more. The definition: Far box defines major trend; system trades only in same direction as major trend, meanwhile fading the signals of near box. Last trade in each...

Count:2974
Name: SUPERTREND ATR WITH TRAILING STOP LOSS
Description: ## THIS SCRIPT IS ON GITHUB ## MORE BACKTEST SuperTrend is a moving stop and reversal line based on the volatility (ATR). The strategy will ride up your stop loss when price moviment 1%. The strategy will close your operation when the market price crossed the stop loss. The strategy will close operation when the line based on the volatility will...

Count:2962
Name: How to automate this strategy for free using a chrome extension.
Description: Hey everyone, Recently we developed a chrome extension for automating TradingView strategies using the alerts they provide. Initially we were charging a monthly fee for the extension, but we have now decided to make it FREE for everyone. So to display the power of automating strategies via TradingView, we figured we would also provide a profitable strategy along...

Count:2940
Name: Easy System 420
Description: In this strategy, 15 indicators are used, each giving its results as a numerical value, which then is added or subtracted from the total points, gathered from all 15 indicators. Many thanks to RafaelZioni for his great work making the EasySys1 script which i modified to create this script. Onchart is drawn some of the indicators, but not all, a info panel is...

Count:2909
Name: UT Bot Strategy with Backtesting Range [QuantNomad]
Description: UT Bot indicator was inially developer by @Yo_adriiiiaan Idea of original code belongs @HPotter I can't update my original UT Bot Strategy so I publishing new strategy with backtesting range included. I just took code of Yo_adriiiiaan, cleaned it, deleted all useless pieces of code, transformet to v4 and created a strategy from it. Also I added an input that...

Count:2901
Name: [STRATEGY][RS]Spot/Binary Scalper V0
Description: Request for: khizon01 Adapted from: www.binaryoptionsedge.com

Count:2825
Name: Strategy based on Squeeze Momentum Indicator [LazyBear]
Description: This Strategy is based on LazyBear Squeeze Momentum Indicator. I added some custom feature and filters. You can customize a lot of features to get a profitable strategy. Here is a link to original study. Please use comment section for any feedback. Next improvement (only to whom is interested to this script and follows me): study with alerts on multiple...

Count:2760
Name: EVWMA VWAP MACD Strategy [QuantNomad]
Description: Based on comment of @coondawg71 I tried to compare VWAP and EVWMA. Both are sort of moving averages so I decided to create a MACD based on these 2 indicators. In parameters you can set EVWMA Length and 2 smoothing lengths for "macd" and "signal". Strategy seems to work pretty good at 2h-8h timeframes for crypto. What do you thing about it?

Count:2718
Name: Stop loss and Take Profit in $$ example
Description: This is a simple exit example in $$ (symbol's currency) for educational purpose .

Count:2675
Name: Pinescript v4 - The Holy Grail (Trailing Stop)
Description: After studying several other scripts, I believe I have found the Holy Grail! (Or perhaps I've just found a bug with Tradingview's Pinescript v4 language) Anyhow, I'm publishing this script in the hope that someone smarter than myself could shed some light on the fact that adding a trailing stop to any strategy seems to make it miraculously...no that's an...

Count:2669
Name: Hull Moving Average Swing Trader
Description: Hull Moving Average Strategy 2 X HMA's, 1st HMA on current price (recommended source OPEN) 2nd HMA on previous candle. signal on crossover. Buy and Sell signals on chart, red & green view pane (Green Buy, Red Sell)

Count:2659
Name: Support-Resistance breakout
Description: Strategy based on longing resistance breakout and shorting support breakout. It defines highs and lows using fractal with 2 bars for confirming high/lows. So it has 2 bars lag. It calculates the difference between sma with defined length (21 by default) of highs and of lows and uses it as alt SR level. This idea I took from synapticEx's indicator...

Count:2658
Name: Acrypto - Weighted Strategy
Description: Hello traders! I have been developing a fully customizable algo over the last year. The algorithm is based on a set of different strategies, each with its own weight (weighted strategy). The set of strategies that I currently use are 5: MACD Stochastic RSI RSI Supertrend MA crossover Moreover, the algo includes STOP losses criteria and a taking...

Count:2654
Name: Simple profitable trading strategy
Description: This strategy has three components. Philakones EMAs are a sequence of five fibonacci EMAs. They range from 55 candles (green) to 8 candles (red) in length. A strong trend or breakout is marked by the emas appearing in sequence of their length from 8 to 55 or vice versa. These EMAs are also used to signal an exit. Only two EMAs are used for exit signals -...

Count:2640
Name: Ichimoku Kinko Hyo: Basic Strategy
Description: Ichimoku Kinko Hyo: Basic Strategy Entry/Exit orders are placed when three basic signals are triggered. Ichimoku Signals: 1) Tenkan-Sen/Kijun-Sen Cross Bullish: Tenkan-Sen is above the Kijun-Sen. Bearish: Tenkan-Sen is below the Kijun-Sen. 2) Chikou-Span Cross Bullish: Chikou-Span is above the close of 26 bars ago. Bearish: Chikou-Span is below the...

Count:2627
Name: Best Supertrend CCI Strategy
Description: Hello traders Someone requested the strategy version of the Supertrend CCI indicator It's a Supertrend not based on candle close but based on a CCI ( Commodity Channel Index ) How does it work? Bull event: CCI crossing over the 0 line Bear event: CCI crossing below the 0 line When the event is triggered, the script will plot the Supertrend as follow UP...

Count:2615
Name: Solution Zigma - Fibonacci Impulse
Description: 'Solution Zigma' is strategy for any securities because this strategy use EMA of Fibonacci Level and Plot Like candle easy for analysis trend impulse. This strategy used DMI(ADX) for filter sideway but not greatest indicator, Please use this strategy with Risk Management.

Count:2575
Name: Simple RSI-MA Algo Beats DOW By Huge Margin Over Past 100 Years!
Description: This simple RSI-MA long/short algorithm beats the Dow by a FREAKING HUGE margin over the past century (excluding dividends and trading costs). The algorithm uses a fast SMA of the RSI as a buy/cover signal and a slow SMA of the RSI as a sell/short signal. Backtest period = 09/17/1916 - 11/02/2015 Dow = 98 --> 17,830 = +18,094% = 5.38% CAGR Algorithm = net...

Count:2573
Name: Super Scalper - 5 Min 15 Min
Description: This strategy is based on RSI and ATR Bands which works better in 5 and 15 Mins time frame. Perform enough back testing with 1:2R before using in real time. Entry only on trade on screen symbols, use additional buy/sell alerts to book profit or to trail SL. I have also added Golden Cross Over of 65 and 21 EMA to have confirmation on trend.

Count:2476
Name: Range Filter Buy and Sell 5min [Strategy]
Description: - Backtest of Range Filter Buy and Sell 5min - including testing period, TP/SL

Count:2452
Name: BUY and SELL - Backtest single EMA cross By che_trader
Description: Hi, I hope you're well! At the request of my friend @jansrbtc I'm going to publish a simple emas crossing strategy. We will do long or short at the cross of the two ema. Good strategy for when an asset is in trend. Warm: In choppy periods this indicator can be very affected by large drawdowns. Enjoy!

Count:2444
Name: FTSMA - Trend is your frend
Description: This my new solid strategy: if you belive that "TREND IS YOUR FRIEND" this is for you! I have tested with many pairs and at many timeframes and have profit with just minor changes in settings. I suggest to use it for intraday trading . VERY IMPORTANT NOTE: this is a trend following strategy, so the target is to stay in the trade as much as possible. If your...


Count:2407
Name: Monthly Returns in PineScript Strategies
Description: I'm not 100% satisfied with the strategy performance output I receive from TradingView. Quite often I want to see something that is not available by default. I usually export raw trades/metrics from TradingView and then do additional analysis manually. But with tables, you can build additional metrics and tools for your strategies quite easily. This script will...

Count:2396
Name: QuantNomad - Heikin-Ashi PSAR Strategy
Description: Continue experimenting with different combinations of strategies. Here is the PSAR Strategy calculated based on HA candles. HA is already calculated inside the script, do not apply it to HA candles. Strategy is calculated based on 25% equity invested with 0.1% commission. #################### Disclaimer Please remember that past performance may not be...

Count:2396
Name: Scalping Support Resistance Strategy
Description: Scalping strategy for BTC using one line: Support Resistance. The strategy draws a line based on the minimum value of the average of High, Low, and Close for a given bar. The entries are carried out on the breakdown of this line. Exits are managed by the specified in the script's inputs take-profit and stop-loss percentages. From Stream: www.tradingview.com

Count:2384
Name: Fibonacci + RSI - Strategy
Description: Strategy: Fibonacci + RSI: - Intraday trading strategy (Scalping). Time Frames Tested with best Results: 30 Minutes. 5 Minutes. 15 Minutes. 1 Minute Indicators Used: RSI (30 / 70) Fibonacci (1 - 0.784) How it Works: Once the Price Hits the 1 or -1 Fibonacci Level and bounces a little bit, It checks the RSI if Over Bought or Over...

Count:2380
Name: Delta-RSI Strategy (with filters)
Description: Delta-RSI Strategy (with filters): This is a version of the Delta-RSI Oscillator strategy with several criteria available to filter entry and exit signals. This script is also suitable for backtesting over a user-defined period and offers several risk management options (take profit and stop loss). Since the publication of the Delta-RSI Oscillator script, I have...

Count:2370
Name: Crypto BOT lower timeframes
Description: This is a crypto bot designed for lower time frames. Its made of 2 EMA, one fast and one slower . They are combined together with Stochastic, MACD and price action patterns. For entries we have multiple conditions : First we check if one of our last 4 closed candles crossed above or below the faster EMA. After that for long, we check that last close is above...

Count:2353
Name: [STRATEGY][RS]ZigZag PA Strategy V4
Description: EXPERIMENTAL: WARNING: highly curve fitted results, if you dont know whats going on stay away.

Count:2352
Name: [Backtest]QQE Cross v6.0 by JustUncleL
Description: Description: This is the Backtest version of the " QQE Cross v6.0 by JustUncleL" Tool, can be used to optimize settings.

Count:2351
Name: QQE MOD + SSL Hybrid + Waddah Attar Explosion
Description: TRADE CONDITIONS Long entry: QQE Mod changes to Blue (leading indicator) SSL Hybrid is Blue and price is above MA Channel line Waddah Attar Explosion is Green and above Explosion line Short entry: QQE Mod changes to Red (leading indicator) SSL Hybrid is Red and price is below MA Channel line Waddah Attar Explosion is Red and above...

Count:2325
Name: Crypto Scalper Divergence Macd Psar Ema 200
Description: This is a very efficient crypto scalper adapted to very short timeframes, however it can be optimized for other timeframes and assests as well. Its components are MACD P SAR EMA 200 Risk management Rules for entry: For short : we have an uptrend on PSAR , histogram is positive (divergence MACD) and close of a candle is below EMA 200 For long : we dont have an...

Count:2193
Name: Bollinger Bands Breakout Strategy
Description: Bollinger Bands Breakout Strategy is the strategy version of Bollinger Bands Filter study version, which can be found under my scripts page. The strategy goes long when price closes above the upper band and goes short signal when price closes below the lower band. Bollinger Bands is a classic indicator that uses a simple moving average of 20 periods, along...

Count:2187
Name: Forex Master v4.0 (EUR/USD Mean-Reversion Algorithm)
Description: DESCRIPTION Forex Master v4.0 is a mean-reversion algorithm currently optimized for trading the EUR/USD pair on the 5M chart interval. All indicator inputs use the period's closing price and all trades are executed at the open of the period following the period where the trade signal was generated. There are 3 main components that make up Forex Master v4.0: ...

Count:2181
Name: Profit Maximizer Strategy
Description: First I would like to thank to @KivancOzbilgic for developing this indicator. All the credit goes to him. I just created a strategy, in order to try to find the perfect parameters, timeframe and currency for it. I will provide below the same description like he has in the publish of profit maximizer Profit Maximizer - PMax combines the powerful sides of MOST...

Count:2173
Name: HULLTSIBOT
Description: Do you like TSI indicator? Do you like HMA indicator? The all new, HULLTSIBOT indicator! About: TSI indicator was on a space mission to mine other planets and then the crew stumbled upon a bunch of HMA indicator eggs. In the darkness of the slime room they found, There was a suddenly a bunch of failing and swearing and machinegun fire muzzle flashes, then all...

Count:2163
Name: Auto Fibo on Indicators
Description: This drawing tool aims to draw auto Fibonacci Retracement Levels on desired indicators. Users can define the target indicator to draw Auto Fibo Lines, from the "settings tab": There are six commonly used indicators below the charts that can be selected to draw Fibonacci Retracement lines on: RSI : Relative Strength Index CCI : Commodity Channel Index MFI : Money...

Count:2141
Name: Stepped trailing strategy example
Description: This is a stepped trailing exit example for educational purpose . Short brief. There are 1 stop loss and 3 profit levels. When first tp is reached we move stop loss to break-even. When second tp is reached we move stop loss to first tp. When third tp is reached we exit by profit.

Count:2112
Name: [STRATEGY][RS]Open Session Breakout Trader
Description: EXPERIMENTAL: use at your own discretion. custom session breakout strategy, it uses a percentage of daily atr to set breakout limits. strategy only viable for intraday timeframes and is suggested under 1hour.

Count:2099
Name: EMA Slope Trend Follower Strategy
Description: This strategy is based on the slope of the EMA130. Over that slope, the script calculates two EMAs (9,21) which are used to generate the main entry and exit signal. In particular, the strategy enters a LONG position when EMA9 > EMA21. On the contrary, it closes the LONG and opens a SHORT when EMA9 < EMA21. When the slope of the EMA130 is rising, it means that...

Count:2086
Name: Moving Regression Band Breakout strategy
Description: Following the introduction of the Moving Regression Prediction Bands indicator (see link below), I'd like to propose how to utilize it in a simple band breakout strategy : Go long after the candle closes above the upper band . The lower band (alternatively, the lower band minus the 14-period ATR or the central line ) will serve as a support line . ...

Count:2084
Name: ANN 2 signals
Description: This is a different approach from my original ANN strategy. This version does 2 ANN predictions and only when they are both in the same direction, a trade will be opened. When either of them switches, the trade is closed.

Count:2076
Name: [BACKTEST]Traders Dynamic Index Indicator Alert by JustUncleL
Description: By request, this script is a "strategy" version of my "Traders Dynamic Index Indicator Alert" script, made available for backtesting to help find optimal trade settings for a particular asset.

Count:2067
Name: Mirocana Strategy
Description: Check out this strategy. for more information: mirocana.com

Count:2056
Name: DCA Bot Long/Short
Description: Thanks to @TheTradingParrot for the inspiration and knowledge shared. Thanks to @ericlin0122 for the original DCA Bot Emulator which is the backbone of this strategy. The script simulates DCA strategy with parameters used in 3commas DCA bots for futures trading. Experiment with parameters to find your trading setup. Beware how large your total leveraged...

Count:2022
Name: BEST ABCD Pattern Strategy
Description: Hello traders This is the strategy version of this script I - Concept I present to you, ladies and gentlemen, the first screener for harmonic patterns. Starting with an ACBD pattern screener this time!! I used the calculations from Ricardo Santo's script In short, he's using fractals (regular or Bill Williams ) for the pattern calculations. A...

Count:2002
Name: TradePro's Trading Idea Cipher Divergence EMA Pb Strategy
Description: Here I present you on of Trade Pro's Trading Idea: Cipher B+ Divergence EMA Pullback Strategy. Optimized the crypto pairBTC/USDT in the 30 minute chart. There is the possibility to switch between short and long positions. You can choose between 2 different take profit/stop loss types: The Lowest Low/ Highest High Stop Loss/ Take Profit and the ATR Take Profit/...

Count:2000
Name: Trend Surfers - Premium Breakout + Alerts
Description: Trend Surfers - Premium Breakout Strategy with Alerts I am happy today to release the first free Trend Surfers complete Breakout Strategy! The strategy includes: Entry for Long and Short Stoploss Position Size Exit Signal Risk Management Feature How the strategy works This is a Trend Following strategy. The strategy will have drawdowns, but they...

Count:1993
Name: Strategy Designer
Description: Hello traders. Thanks to the tool I have published, everyone who knows or does not know coding will be able to create strategies and see the results instantly on the screen. Yes it looks very nice :) What does this script do? Thanks to this tool, even if you don't know any coding, you will be able to create your own strategies. You can add and remove...

Count:1993
Name: BTC bot
Description: I made good money on this bot in last few month so i decided to donate it to community (its from my private bot collection) design for BTC mainly . it a great bot for longs , shity for shorts :) no security in this bot so no repaint the key issue in any bot design is to find good low , after you just exit by take profit the exit strategy here is based on pivot...

Count:1974
Name: The Always Winning Holy Grail Strategy - Not (by ChartArt)
Description: How to win all the time if 1+1 = 2 The most upvoted strategies on Tradingview are those which seemingly work 100%, but they actually don't at all because they are repainting and would not work in live trading reality. They are using the multi-time-frame strategy testing bug and thereby trade during the backtest on close prices before the bar has closed in...

Count:1921
Name: Fibonacci Ranges (Real-Time) [LuxAlgo]
Description: The "Fibonacci Ranges" indicator combines Fibonacci ratio-derived ranges (channels), together with a Fibonacci pattern of the latest swing high/low. 🔶 USAGE The indicator draws real-time ranges based on Fibonacci ratios as well as retracements. Breakouts from a Fibonacci Channel are also indicated by labels, indicating a potential reversal. Each...

Count:1919
Name: Swing Trading System RSI
Description: This is an RSI Swing Trading System roughly translated from backtestwizard.com . It uses ATR for profit target & stops. It uses a 26 week EMA filter to go long.

Count:1919
Name: BEST Candle Meter/Sequential Strategy
Description: Hello ladies and gentlemen 📒 INDICATOR OF THE DAY 📒 The TD sequential fans are going to love that one. TD Sequential has two parts – TD Setup and TD Countdown. The first phase of TD Sequential starts with a TD Setup and is completed with a 9 count. When the 9 count is completed, it is at that point, a price pause, price pullback, or reversal is likely. The...

Count:1919
Name: Scalping Trading System bot Crypto and Stocks
Description: This is a trend trading strategy scalping bot that can work with any type of market. However I concluded my tests so far with Crypto, Stocks and Forex, and with optimizations always could be found some profitable settings. Indicators SImple Moving Average Exponential Moving Average Keltner Channels MACD Histogram Stochastics Rules for entry long= Close of...

Count:1914
Name: RSI-VWAP Indicator %
Description: █ OVERALL Simple and effective script that, as you already know, uses vwap as source of the rsi, and with good results as long as the market has no long-term downtrend. RsiVwap = rsi (vwap (close), Length) The default settings are for BTC in a 30 minute time frame. For other pairs and time frames you just have to play with the settings. █ FEATURES • The...

Count:1897
Name: Grid Like Strategy
Description: It is possible to use progressive position sizing in order to recover from past losses, a well-known position sizing system being the "martingale", which consists of doubling your position size after a loss, this allows you to recover any previous losses in a losing streak + winning an extra. This system has seen a lot of attention from the trading community...

Count:1893
Name: Noro's Trend Ribbon Strategy
Description: One moving average ( SMA ) is used. The channel is convened at a moving average rather than prices. Blue is a uptrend. Red is a downtrend. If the candle has closed above the ribbon - open long (and close short) If the candle has closed below the ribbon - open short (and close long)

Count:1873
Name: Super Z strategy - Thanks to Rafael Zioni
Description: //Original script //https://www.tradingview.com/script/wYknDlLx-super-Z/ This is a test for verifying if this interesting study works well. The author, thanks to him!!!, advise a possible repaint because the script uses security function. Refer to tradingview.com for more info on repainting: www.tradingview.com QUOTE: We can see repainting in the following...

Count:1844
Name: RSI Trend Crypto
Description: Dear community, Today I want to present you one of my favorite and simple trading bots: The RSI Trend. This bot is based on the RSI, which normally is used as a trend reversal indicator. However, here it’s used as a trend finding indicator, often with great success. This bot making long-only trades, which is quite successful in bull-markets like the one we’re...

Count:1841
Name: FRAMA - Supertrend strategy
Description: FRAMA Strategy I found this strategy on internet, in a well-known forex forum. I have translated the two indicators mentioned in that strategy (originally in mq4) in pine script. Thanks to Fractured and Shizaru for the FRAMA snippets, to mejialucas for Supertrend snippet, to JayRogers for trade management snippet and to Trost for backtesting snippet. I also added...

Count:1838
Name: Strategy Follow Line MTF Any MM Average
Description: The objective is only to evaluate different configurations of the indicator "Follow Line MTF Any MM Average". The strategy does not have position management, it's very basic, this indicator should be used to see trend, range zones, evaluate the best areas to enter the market, use higher time frames to confirm a direction can be useful. I do not recommend using...

Count:1821
Name: Extreme Scalping
Description: This is a test of an easy scalping method: buy if actual close is below forecast close and sell if actual close is above forecast close. Take profit and stop loss shall be very small (few pips) as in most of scalping strategies. No filter is used for only long or only short positions, but you can select buy only or sell only based on other indicators or whatever...

Count:1820
Name: CamarillaStrategy -V1 - H4 and L4 breakout - exits added
Description: Exits added using trailing stops. 2.6 Profit Factor and 76% Profitable on SPY , 5M - I think it's a pretty good number for an automated strategy that uses Pivots. I don't think it's possible to add volume and day open price in relation to pivot levels -- that's what I do manually .. Still trying to add EMA for exits.. it will increase profitability. You can...

Count:1812
Name: PPO Bull/Bear Divergence to High/Low Strategy
Description: A simple strategy that uses the PPO divergences to open trades and the highs/lows to close them. Credit to Pekipek for this PPO Divergence indicator (I changed the visuals a bit) STRATEGY Purple circle - bullish divergence - enter LONG Orange circle - bearish divergence - enter SHORT Green dot - high point - exit LONG Red dot - low point - exit SHORT That's it....

Count:1807
Name: Wolfe Strategy [Trendoscope]
Description: Hello Everyone, Wish you all Merry X-Mas and happy new year. Lets start 2023 with fresh new strategy built on Wolfe Indicator. Details of the indicator can be found here 🎲 Wolfe Concept Wolfe concept is simple. Whenever a wedge is formed, draw a line joining pivot 1 and 4 as shown in the chart below: For simplicity, we will only consider static value for...

Count:1780
Name: 3x SuperTrend Strategy (Mel0nTek) V1
Description: This is a triple SuperTrend based strategy for lower time frame trades such as day trades and scalping. I have not seen many strategies that combine multiple SuperTrends so I thought I would publish this one since I put it together and have been quite happy with the results. I have found through testing that the best results are on currency exchange markets such...

Count:1778
Name: MACD Strategy with trailing ATR stop
Description: This is a trend based strategy that uses EMA and SMA intersection for determining the direction of the trend and MACD for the entry signal. At the same time, the strategy uses ATR, which is working as a trailing stop. The strategy entry will work when the Trend ribbon will turn green and MACD line will crossover the signal line. This strategy also takes into...

Count:1739
Name: Lorentzian Classification Strategy
Description: Based in the model of Machine learning: Lorentzian Classification by @jdehorty, you will be able to get into trending moves and get interesting entries in the market with this strategy. I also put some new features for better backtesting results! Backtesting context: 2022-07-19 to 2023-04-14 of US500 1H by PEPPERSTONE. Commissions: 0.03% for each entry, 0.03%...

Count:1731
Name: Noro's Bands Scalper Strategy v1.6
Description: Noro's Bands for scalping Lime = uptrend Red = downtrend

Count:1726
Name: Ultimate Strategy Template (Advanced Edition)
Description: Hello traders This script is an upgraded version of that one below New features - Upgraded to Pinescript version 5 - Added the exit SL/TP now in real-time - Added text fields for the alerts - easier to send the commands to your trading bots Step 1: Create your connector Adapt your indicator with only 2 lines of code and then connect it to this...

Count:1723
Name: Moving Average Consecutive Up/Down Strategy (by ChartArt)
Description: This simple strategy goes long (or short) if there are several consecutive increasing (or decreasing) moving average values in a row in the same direction. The bars can be colored using the raw moving average trend. And the background can be colored using the consecutive moving average trend setting. In addition a experimental line of the moving average change can...

Count:1701
Name: Fancy Bollinger Bands Strategy [BigBitsIO]
Description: This script is for a Bollinger Band type indicator with built-in TradingView strategy including as many features as I can possibly fit into a Bollinger Band type indicator including a wide variety of options to create the most flexible Bollinger Bands strategy possible. Features: - A single custom moving average serving as the middle band. - Standard MA...

Count:1676
Name: Supply Demand Profiles [LuxAlgo]
Description: The Supply Demand Profiles is a charting tool that measures the traded volume at all price levels on the market over a specified time period and highlights the relationship between the price of a given asset and the willingness of traders to either buy or sell it, in other words, highlights key concepts as significant supply & demand zones, the distribution of...

Count:1669
Name: Scalping with Bill Williams Alligator
Description: Scalping strategy based on Bill Williams Alligator technique but calculated with heikin ashi candles. This strategy has to be applied to standard candles and low time frames (1min to 5min) Thanks to all pinescripters mentined in the code for their snippets. It could be improved with stop loss based on ATR etc. I have also a study with alerts. Please use...

Count:1656
Name: Keltner bounce from border. No repaint. V2 (by Zelibobla)
Description: WARNING: despite of strategy doesn't use future data (not repaints) it doesn't consider broker`s commissions, which can be harmful for real life high frequency trading. Strategy will definitely fail on non-ordinary security behavior. But if new behavior will get stable, tuned params should make strategy profitable again. This is the second version of this...

Count:1652
Name: Swing Hull/rsi/EMA Strategy
Description: A Swing trading strategy that use a combination of indicators, Hull average to get the trend direction, ema and rsi do the rest, use it are your own risk expecially at the end of any hull trend Past Performance Does Not Guarantee Future Results

Count:1651
Name: Range Detector [LuxAlgo]
Description: The Range Detector indicator aims to detect and highlight intervals where prices are ranging. The extremities of the ranges are highlighted in real-time, with breakouts being indicated by the color changes of the extremities. 🔶 USAGE Ranging prices are defined by a period of stationarity, that is where prices move within a specific range. Detecting...

Count:1634
Name: HHLL Strategy
Description: This is simple Highest high and Lowest low strategy. Buy when break HH+offset Sell when break LL+offset Offset = (HH-LL)/2

Count:1621
Name: Super Guppy Strategy
Description: CM Super Guppy with Long/Short signals, backtesting, and additional options. Updated for PineScript v4. COINBASE:BTCUSD Features 2 primary modes, depending on your risk profile. These options are available in the settings: "Early Signals" ON (default): Prints a "long" on grey to green transitions AND red to gray transitions. Prints a "short" on...

Count:1615
Name: [Daveatt] BEST ABCD Pattern Strategy (Trailing SL + TP)
Description: Hello traders This is the strategy version of my ABCD pattern. I added the Trailing Stop and Trailing Profit upon a follower request I - Concept I present to you, ladies and gentlemen, the first screener for harmonic patterns . Starting with an ACBD pattern screener this time!! I used the calculations from Ricardo Santo's script In short, he's using...

Count:1596
Name: K.M Trend Strategy (BETA 1.2)
Description: My beautiful traders, how is everyone doing? This indicator I built detects trends, I haven't seen any repaints, I only had 3 minor ones. It is still on BETA version. To all new traders, and busy traders I will be posting one that you can set alerts. Please look under my profile or type " K.M Trend Alerts (BETA 1.2) " . I ask for everyone to try this script...

Count:1585
Name: ATR Strategy Back test
Description: Original script by HPotter ATR strategy is profitable. Buy when it says buy and sell when it says sell.

Count:1567
Name: EMA Slope Cross Trend Follower Strategy
Description: This strategy uses the cross of the slopes of two EMAs having different lengths to generate trend follower signals. By default, I use 130 and 400, which behave very well. The conditions which make the strat enter the market are: - Fast Slope > Slow Slope and price > EMA 200 : go Long - Fast Slope < Slow Slope and price < EMA200 : go Short The simple slopes cross...

Count:1565
Name: VXD Cloud Edition
Description: VXD Cloud Edition. to overcome sideways market conditions this cloud configured for low timeframe. every TA is same as VXD Supercycle but show as cloud. Symbols on chart show Premium and Discount Prices X-Cross = Engulfing Candle with weak volume . O-circle - Engulfing Candle with strong volume . Pivot point and Rejected Block Pivot show...

Count:1562
Name: Easy to Use MACD+RSI Strategy
Description: BEGINNERS REJOICE! Easy to use strategy test using MACD with RSI as a confirming indicator. The code is structured to make it easy to manipulate the variables to your choosing. EASY TO CHANGE CODE VARIABLES LINE 2 = Change the amount you invest every trade and the currency LINE 8/9/10 = Change the defval of each of these lines to backtest from a...

Count:1562
Name: TSI CCI Hull with profit$$$
Description: This is a modified version of @SeaSide420 TSI CCI Hull with profits exit on long and short order ORIGINAL SCRIPT: /// /// feel free to edit/improve and comment

Count:1559
Name: EDMA Scalping Strategy (Exponentially Deviating Moving Average)
Description: This strategy uses crossover of Exponentially Deviating Moving Average (MZ EDMA ) along with Exponential Moving Average for trades entry/exits. Exponentially Deviating Moving Average (MZ EDMA ) is derived from Exponential Moving Average to predict better exit in top reversal case. EDMA Philosophy EDMA is calculated in following steps: In first step,...

Count:1556
Name: Trendline Breakouts With Targets [ChartPrime]
Description: The Trendline Breakouts With Targets indicator is meticulously crafted to improve trading decision-making by pinpointing trendline breakouts and breakdowns through pivot point analysis. Here's a comprehensive look at its primary functionalities: Upon the occurrence of a breakout or breakdown, a signal is meticulously assessed against a false signal...

Count:1549
Name: Keltner Channel - Trend Based Strategy
Description: This strategy is based on 3 main indicators. 1st indicator is a trend indicator, which consists of SMA and EMA 2nd is Keltner Channel 3rd is DM indicator. The conditions for the entry of this strategy are following: First of all the assets need to be in an upward trend, this will occur when the EMA will cross SMA. The next condition for the entry is the...

Count:1539
Name: yuthavithi volatility based force trade scalper strategy
Description: I have converted my volatility based force scalper into strategy. Nice to see it is so profitable. Work best with Heikin Ashi bar.

Count:1538
Name: Renko Strategy Open_Close
Description: Simple Renko strategy, very profitable. Thanks to vacalo69 for the idea. Rules when the strategy opens order at market as follows: - Buy when previous brick (-1) was bearish and previous brick (-2) was bearish too and actual brick close is bullish - Sell when previous brick (-1) was bullish and previous brick (-2) was bullish too and actual brick close is...

Count:1526
Name: Band-Zigzag - TrendFollower Strategy [Trendoscope]
Description: Strategy Time!!! Have built this on my earlier published indicator Band-Zigzag-Trend-Follower . This is just one possible implementation of strategy on Band-Based-Zigzag . 🎲 Notes Experimental prototype. Not financial advise and strategy not guaranteed to make money despite backtest results Not created or tested for any specific instrument or...
Count:1516
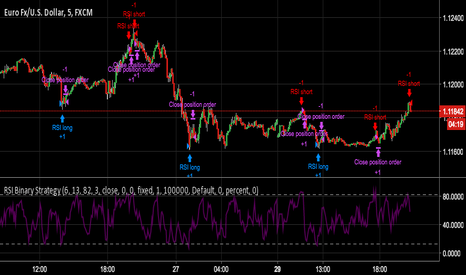
Name: RSI Binary Strategy
Description: Another basic strategy most people learn at the beginning of their trading carreer (like me) is the RSI strategy. This is an adaptation of the built-in RSI strategy for use in binary options. Who knows, maybe one day i will graduate to CFD trading, but my time for trading in general is limited at the moment and I am very much still at the beginning of this entire...

Count:1514
Name: Instrument-Z (3Commas Bot)
Description: Instrument-Z is what I am currently using as my 3Commas Bot. It allows you to customize signals from 3 indicators; Crossing MA's, Stochastic RSI, and WaveTrend. Better yet, it allows you to setup these signals separately depending on whether the Trend MA is going up or down. So there are 2 sets of inputs for everything, Uptrend inputs and Downtrend inputs. I have...

Count:1509
Name: BB+AO STRAT
Description: to be used with AO indicator, based on forex strat -- www.forexstrategiesresources.com works on 1/3/5/15/30 candles, buy signals are best when the black 3 fast ema crosses up through the red mid band

Count:1503
Name: SuperTREX strategy
Description: This is the strategy of Super Trex that i put as open source before i just add option for non security MTF and take profit steps as i shown before for different coins or assets you need to set different parameters

Count:1486
Name: Ichimoku Kinko Hyo Cloud - no offset - no repaint - strategy
Description: Ichimoku Kinko Hyo Cloud - no offset - no repaint - RSI filter - strategy The indicator contains both the standard Ichimoku Cloud , as well as the one without the visual offset. The Strategy Tester indicates good backtest results when the Ichimoku Cloud is paired with the RSI . However, it seems it likes to work more as a standalone system. The indicator can...

Count:1482
Name: Hulk Strategy x35 Leverage 5m chart w/Alerts
Description: This strategy is a pullback strategy that utilizes 2 EMAs as a way of identifying trend, MACD as an entry signal, and RSI and ADX to filter bad trades. By using the confirmation of all of these indicators the strategy attempts to catch pullbacks, and it is optimized to wait for high probability setups. Take not that the strategy is optimized for use on...

Count:1478
Name: Real Turtle
Description: There are a few different attempts at the turtle strategy on here, but none that I have seen thus far correctly follow the strategy as I know it. This version uses a stop order to trail out of the position by moving the stop order to match the exit channel or stoploss as the N*2( ema of True Range * 2). This version of turtle strategy also uses stop orders for...

Count:1477
Name: MACD + Stochastic + RSI Strategy
Description: My strategy uses a combination of three indicators MACD Stochastic RSI. The Idea is to buy when (MACD > Signal and RSI > 50 and Stochastic > 50) occures at the same time This strategy works well on stocks and cryptos especially during market breaking up after consolidation The best results are on Daily charts, so its NOT a scalping strategy. But it can work...

Count:1463
Name: 5min MACD scalp by Joel
Description: This strategy is inspired by a youtuber called Joel on Crypto. He trades this using Ema, MACD indicators and his own experience. For more information, check out his Best Crypto Scalping Strategy for the 5 Min Time Frame video. I have tried to automate this a little. Long or Short trades are determined with a crossing of the fast Ema over the slow Ema for Long and...

Count:1459
Name: DCA Bot Emulator
Description: Emulate DCA bot. Buy ASAP. Set chart interval to 1 hour.

Count:1410
Name: Template Trailing Strategy
Description: This script is meant to be used as a generic template for new strategies. Take Profit, Stop Loss logic is provided out of the box with (or without) their trailing variations while the trailing for entry and exit orders can also be enabled and be configured! Custom quantity risk management is provided along with the ability to set custom signal messages that can be...

Count:1405
Name: Custom Screener with Alerts [QuantNomad]
Description: Some time ago I published an example of simple custom screener in PineScript: The only thing this screener did is created a dynamic label with screener output. Recently TradingView announced alerts from the strategy with the possibility to add custom messages to alerts. So using it I was able to create a bit more advanced screener which sends results as...

Count:1405
Name: V Bottom & V Top Pattern [Misu]
Description: █ This indicator shows V bottom & V top patterns as well as potential V bottom & V top. These V bottom & V top are chart powerful reversal patterns. They appear in all markets and time-frames, but due to the nature of the aggressive moves that take place when a market reverses direction, it can be difficult to identify this pattern in real-time. To address this...

Count:1404
Name: Built-in Kelly ratio for dynamic position sizing
Description: This is the defaut keltners channel strategy with a few additions. The main purpose is to show how we include the Kelly ratio into our scripts for dynamic position sizing based on the performance of the strategy on a per trade basis. We've also included the usual take-profit and stop-loss parameters in the event you want to play a little :) We hope this helps...

Count:1401
Name: How to automate this strategy for free... Version 2
Description: Hello fellow traders and automation lovers. It has been about 2 years since we originally created Autoview to connect your exchanges/brokers with your TradingView alerts. We've since added multiple exchanges, parameters and have built a large community filled with awesome, passionate traders. One of the first strategies we built was sadly not a viable one for...

Count:1400
Name: CRYPTO 3EMA Strategy with Take Profit & Stop Loss based on ATR
Description: Simple 3 EMA Strategy with plotted Take Profit and Stop Loss Entry condition: - Middle EMA cross above the Slow EMA - Set take profit and stop loss exit conditions based on ATR Indicator Exit condition: - Fast EMA cross below the Middle EMA

Count:1392
Name: EMA Cross Strategy
Description: This double EMA crossover strategy aims to illustrate a good strategy design. It is currently the only published script that: supports a proper date picker for the backtest period is able to test in short and long mode only

Count:1391
Name: UT Bot v5
Description: This is an update by request, on someone elses strategy! well more of an edit, but also update from pine v4 to pine v5. //CREDITS to HPotter for the orginal code. The guy trying to sell this as his own is a scammer lol. //Edited and converted to @version=5 by SeaSide420 for Paperina The UT Bot v5 is Movinging average (the MA) vs ATR (the ATR is in the form...

Count:1388
Name: MACD 5 iN 1 [Pro-Tool]
Description: introducing MACD Which has different indicators inside, And not only that, five different strategies have also been included in this indicator. Strategy №1:👉 MACD Crossover Signal Line Strategy №2:👉 MACD Crossover + MACD Overbought Section (for ignore false Crossover signals) Strategy №3:👉 MACD Crossover + Market Close should b greater tha MOVING AVERAGE Strategy...

Count:1388
Name: ATR Trailing Stop Strategy by ceyhun
Description: Same coding only coloring and strategy version added //Barcolor Green = Trail1 > Trail2 and close > Trail2 and low > Trail2 Blue = Trail1 > Trail2 and close > Trail2 and low < Trail2 Red = Trail2 > Trail1 and close < Trail2 and high < Trail2 Yellow = Trail2 > Trail1 and close < Trail2 and high > Trail2 //It gives White color where there is...

Count:1378
Name: MACD + BB + RSI Strategy [Alorse]
Description: A very simple and highly effective strategy that combines 3 famous indicators: MACD Bollinger Bands RSI Entry conditions are: The MACD line crosses over the signal line. RSI less than 50 Price below the BB baseline Exit conditions are: RSI greater than 70 Closing price higher than the upper BB Or when the price hits the Stop Loss...

Count:1372
Name: VWAP Trendfollow Strategy [wbburgin]
Description: This is an experimental strategy that enters long when the instrument crosses over the upper standard deviation band of a VWAP and enters short when the instrument crosses below the bottom standard deviation band of the VWAP. I have added a trend filter as well, which stops entries that are opposite to the current trend of the VWAP. The trend filter will reduce...

Count:1370
Name: Backtesting on Non-Standard Charts: Caution! - PineCoders FAQ
Description: Much confusion exists in the TradingView community about backtesting on non-standard charts. This script tries to shed some light on the subject in the hope that traders make better use of those chart types. Non-standard charts are: Heikin Ashi (HA) Renko Kagi Point & Figure Range These chart types are called non-standard because they all transform market...

Count:1365
Name: BEST Trailing Take Profit Strategy
Description: Hello traders Hope you enjoyed your weekend on my behalf. Was staying home working ... ^^ This is my first strategy educational post I'm doing ever While I'm generally against posting strategies because it's very easy to fake performance numbers... I cannot prevent myself from sharing a few cool strategy snippets anyway. So from now on, I'll be sharing a few...

Count:1363
Name: PMax on Rsi w/T3 *Strategy*
Description: Profit Maximizer Indicator on RSI with Tillson T3 Moving Average: PMax uses ATR calculation inside, for this reason users couldn't manage to use PMax on RSI because RSI indicator doesn't have High and Low values in bars, but ATR needs that values. So I personally calculate RSI in a different way to have High and Low values of RSI wrt price...

Count:1339
Name: [DS]Entry_Exit_TRADE.V01-Strategy
Description: The proposal of this script is to show the possible trading points of BUY and SELL based on the 15-minute chart of the Nasdaq Future Index. The start point of the strategy was schedule for 2021/01/01 and until the time of this publication (2021/01/31), for 1 index contract the results presented area a Gross Profit of 2.97% with a Net Profit of 1.35%. █ FEATURES...

Count:1338
Name: Maximized Scalping On Trend (by Coinrule)
Description: " The trend is your friend. " This is one of the most famous and valuable teachings that experienced traders can give to newbies. There is a reason for that. No matter your views about where the price moves, what matters is where the price heads to . The market is always right, and ultimately it decides who gets the profit and who has to take a loss. The...

Count:1325
Name: Powertrend - Volume Range Filter Strategy [wbburgin]
Description: The Powertrend is a range filter that is based off of volume, instead of price. This helps the range filter capture trends more accurately than a price-based range filter, because the range filter will update itself from changes in volume instead of changes in price. In certain scenarios this means that the Powertrend will be more profitable than a normal range...

Count:1323
Name: Trailing Take Profit Trailing Stop Loss
Description: This script demonstrated a dual trailing take profit and stop loss strategy. Where you take 50% (configurable) of the profit when a price level is reached and then you get the rest when a trailing stop loss is hit.

Count:1321
Name: Simple Moving Average Strategy
Description: This is a modification of MOVINGAVG CROSS with different inputs of bar lengths that work with a great average percentage with not much drawdown. I ran the strategy tester with GBPUSD on 1 hour time frame.

Count:1318
Name: 3C QFL Mean reversal
Description: What is QFL trading strategy? QFL stands for Quickfingersluc, and sometimes it is referred to as the Base Strategy or Mean Reversals. Its main idea is about identifying the moment of panic selling and buying below the base level and utilizing Safety orders. What is Base level or Support Level? Base level or Support Level refers to the lowest price level that...

Count:1316
Name: Y-Profit Maximizer Strategy with Exit Points
Description: This script based on KivancOzbilgic 's PMax indicator. I modified a bit. Added Filters, Exit (TP) Levels and few indicator in it. This script opening only Long Positions. I have used this indicators in this strategy: -Moving Stop Loss (Most) by ceyhun -PMax Explorer STRATEGY & SCREENER -Bollinger Bands on Macd -Tillson T3 Moving Average by KIVANÇ fr3762 I am...

Count:1309
Name: MA Bollinger Bands + RSI
Description: This script uses the standard deviation of a given moving average along with an RSI direction. When: rsi crossover neutral line + price crossover lower deviation boundary => long When: rsi crossunder neutral line + price crossunder upper deviation boundary => short

Count:1307
Name: Sweat Dreams - Extra high profitable
Description: Available for all time frames Available for all crypto currency pairs High-profitable on all time frames The script is the dream of all traders Repaints like a boss. Use at your own risk, or don't use at all!

Count:1301
Name: ATR Parabolic SAR Strategy [QuantNomad]
Description: I created a version of Parabolic SAR when I accelerate it not based on the difference from the extreme point but based on current ATR. So the idea is that for a more volatile market it should move faster. Performance is calculated based on 25% equity invested and 0.1% commission. What do you think about it? Does it make sense to do something like that? Do you...

Count:1299
Name: Heikin Ashi Supertrend
Description: About this Strategy This supertrend strategy uses the Heikin Ashi candles to generate the supertrend but enters and exits trades using normal candle close prices. If you use the standard built in Supertrend indicator on Heikin Ashi candles, it will produce very unrealistic backtesting results because it uses the Heikin Ashi prices instead of the real prices....

Count:1294
Name: Cumulative RSI Strategy
Description: I suppose nothing drives a point home like a 10+ year backtest! A couple of weeks ago I published a custom indicator called the Cumulative RSI. This indicator was straight out of chapter 9 of "Short Term Trading Strategies That Work." Today I am publishing a basic sample strategy in that uses the Cumulative RSI as its only entry and exit signals on a Nasdaq 100...

Count:1293
Name: Sequential Up/Down
Description: This strategy is based on TD sequential study from glaz. I made some improvement and modification to comply with pine script version 4. Basically, it is a strategy based on proce action, supports and resistance and can be used also for scalping. It could be improved with exit rules, stop loss based on ATR etc. I have also a study with alerts. Please use...

Count:1289
Name: MULTIPLE TIME-FRAME STRATEGY(TREND, MOMENTUM, ENTRY)
Description: Hey everyone, this is one strategy that I have found profitable over time. It is a multiple time frame strategy that utilizes 3 time-frames. Highest time-frame is the trend, medium time-frame is the momentum and short time-frame is the entry point. Long Term: - If closed candle is above entry then we are looking for longs, otherwise we are looking for shorts ...

Count:1288
Name: SuPeR-RePaNoCHa #2TP#
Description: This is the last of the 'RePaNoCHa' script for Automatic Trading ;-) ... This time with two take profits ... It Use 6 indicators + volume: -JURIK MOVING AVERAGE -RANGE FILTER -ADX -PARABOLIC SAR -RSI + VOLUME WEIGHTED -MACD -VOLUME To close the position you can choose between 2 Take Profit and the amount to use on each one. You can transform it yourself into...

Count:1287
Name: Parabolic SAR Strategy (on close) [QuantNomad]
Description: Created a Parabolic SAR strategy where price has to close under/above the level before for it to reverse. This way it should be a bit more stable and protect you from false breakouts. It was impossible to adjust the built-in "sar" function so I implemented PSAR from scratch. So if you're interested in how it's work inside you can check the code and probably...

Count:1286
Name: [STRATEGY][UL]QQE Cross v1.1
Description: Updated by request: this is a "Strategy" trading version of the "QQE Cross Indicator Alert v2.0 by JustUncleL" (which is mainly for Binary Options trading), the same BUY/SELL signals are used to generate trade entry and exit conditions. Thanks again to JayRogers for making the Strategy risk management easier to understand and implement. In this update I have...

Count:1279
Name: Zendog V2 backtest DCA bot 3commas
Description: Hi everyone, After a few iterations and additional implemented features this version of the Backtester is now open source. The Strategy is a Backtester for 3commas DCA bots. The main usage scenario is to plugin your external indicator, and backtest it using different DCA settings. Before using this script please make sure you read these explanations and make sure...

Count:1275
Name: Narrow Range + Inside Day, Long Only Strategy (by ChartArt)
Description: This long only strategy determines when there is both a NR7 (narrow range 7, a trading day in which the range is narrower than any of the previous six days), plus a inside day (high of the current day is lower than the high of the previous day and the low of the current day is higher than the low of the previous day) both on the same trading day and enters a long...

Count:1270
Name: Strategy Follow Line Indicator
Description: The objective is only to evaluate different configurations, I do not recommend using only this indicator to trade, because you can lose all your money if you do not know what you are doing. I hope you find it useful. Successes

Count:1257
Name: Trend Trader Strategy with MACD
Description: This is plots the indicator developed by Andrew Abraham in the Trading the Trend article of TASC September 1998 The strategy I use has already been published explicitly by HPotter, you can review the core code from there. I have converted the existing strategy codes that have been published into the strategy and the result looks great but I noticed that the...

Count:1256
Name: RSI on VWAP Upgraded strategy
Description: First of all, the idea of apply RSI to VWAP was inspired by XaviZ; at least, that where I first saw that. I simply applied the idea and searched for apply this on lower timeframe (M15) to increase the number of positions and improve the profit factor. The conditions to enter are the same : long : enter on RSI crossover oversold level short : enter on RSI...

Count:1251
Name: BEST Supertrend Strategy
Description: Hello traders Sharing a sample Supertrend strategy to illustrate how to calculate a convergence and using it in a strategy I based the setup as follow: - Entries on Supertrend MTF breakout + moving average cross. Entering whenever there is a convergence - exit whenever a Simple Moving Averages cross in the opposite direction happen - possibility to filter only...

Count:1249
Name: [Autoview][BackTest]Dual MA Ribbons R0.12 by JustUncleL
Description: This is an implementation of a strategy based on two MA Ribbons, a Fast Ribbon and a Slow Ribbon. This strategy can be used on Normal candlestick charts or Renko charts (if you are familiar with them). The strategy revolves around a pair of scripts: One to generate alerts signals for Autoview and one for Backtesting, to tune your settings. The risk management...

Count:1245
Name: [STRATEGY]Renko Emulator OCC v1 by JustUncleL
Description: This "Strategy" project has been created by request. *** EXPERIMENTAL *** *** USE AT YOUR OWN RISK *** Description: Strategy based around Renko Bar Chart emulator (ATR) with direction change used to signal long/short trades. I have generally found that setting the strategy ATR resolution to 3-5x that of the chart you are viewing tends to yield the good...

Count:1244
Name: FTB Strategy (Automated)
Description: Hey traders! This is a profitable strategy script I created to teach my students how to automate their scripts using 3rd party APIs (more info available in my profile link at the bottom of this page). What Is This? This strategy is called the "Follow The Bear" strategy. It's a forex trading strategy designed for one purpose and one purpose only: to take...

Count:1242
Name: 888 BOT #backtest
Description: █ 888 BOT #backtest (open source) This is an Expert Advisor 'EA' or Automated trading script for ‘longs’ and ‘shorts’, which uses only a Take Profit or, in the worst case, a Stop Loss to close the trade. It's a much improved version of the previous ‘Repanocha’. It doesn`t use 'Trailing Stop' or 'security()' functions (although using a security function doesn`t...

Count:1231
Name: TradersAI_UTBot
Description: CREDITS to @HPotter for the orginal code. CREDITS to @Yo_adriiiiaan for recently publishing the UT Bot study based on the original code - I just added some simple code to turn it into a strategy. Now, anyone can simply add the strategy to their chart to see the backtesting results! While @Yo_adriiiiaan mentions it works best on a 4-hour timeframe or above, I...

Count:1210
Name: EVWMA VWAP Cross Strategy [QuantNomad]
Description: Continue to experiement with VWAP and EVWMA. It seems that just simple crosses between VWAP and EVWMA can be pretty good signals. VWAP is a bit choppy so you can use VWAP smoothing input to smoth it a bit. Here are few other strategies based on EVWMA: EVWMA VWAP MACD Strategy QuantNomad - EVWMA MACD Strategy

Count:1202
Name: HIGHER HIGH LOWER LOW STRATEGY
Description: This is my favorite for Tradingview. Please use other indicators to find good entry and good exit. This is why this publication has so many indicators. A good indicator will find good results even on line chart. Feel free to try on "Heiken Ashi" but understand that "line" chart is much more realistic Due to tradingview's crappy auto resize, the best way to view...

Count:1201
Name: Highest High and Lowest Low Channel Strategy
Description: Highest / Highest High Highest (Data) - HHV (Data, Period) Lowest / Lowest Low Lowest (Data) LLV (Data, Period) These functions calculate the highest / lowest value of a selected data. Highest High and Lowest Low options are mostly used. The Highest function calculates the highest value of the selected data in the past. The Lowest function calculates the lowest...

Count:1200
Name: Renko Intraday Strategy
Description: A simple intraday strategy based on Renko values.


Count:1195
Name: Noro's WaveTrend Strategy v1.0
Description: - For D1, H4, H1 - Only for crypto - WaveTrand Oscilator by Lazy Bear

Count:1191
Name: Crypto ZigZag RSI strategy 15min
Description: This strategy is designed for crypto markets like ETHUSD/T, BTCUSD/T and so on. It works amazingly with 15 min time frames. Its idea consists in : We have the RSI indicator, and with it we check for the crossover with overbought and oversold levels. At the same time we have the zigzag which is made from the higher highs and the lower lows between a specific...

Count:1189
Name: Tripple super Trend + EMA + RSI Strategy
Description: Greetings! Here I show you the Tripple Super Trend Strategy. I discovered the strategy on a YouTube channel and tried to transfer it as a strategy into a script. Tested with the currency pair EUR/USD in the one hour chart. Period: beginning of 2020 until today. The strategy should also work with cryptocurrencies. But then the settings have to be...


Count:1182
Name: Bitcoin Scalping Strategy (Sampled with: PMARP+MADRID MA RIBBON)
Description: DISCLAIMER: THE CONTENT WITHIN THIS STRATEGY IS CREATED FROM TWO INDICATORS CREATED BY TWO PINESCRIPTER'S. THE STRATEGY WAS EXECUTED BY MYSELF AND REVERSE-ENGINEERED TO MEET THE CONDITIONS OF THE INTENDED STRATEGY REQUESTOR. I DO NOT TAKE CREDIT FOR THE CONTENT WITHIN THE ESTABLISHED LINES MADE CLEAR BY MYSELF. The Sampled Scripts and creators: PMAR/PMARP by...

Count:1172
Name: Darvas Box Strategy V2
Description: What Is the Darvas Box? The Darvas Box strategy was developed by Nicholas Darvas. Aside from being a well known dancer, he began trading stock in the 1950s. Based on his success in trading, he was approached to write a book on his strategy. The book, “How I Made $2,000,000 in the Stock Market,” outlines his rather simple approach … simple once you understand the...

Count:1164
Name: Stochastic RSI Strategy
Description: This is an an adaption of Binary option 1 minute by Maxim Chechel to a strategy. I have had success with this on FCT/BTC on Poloniex.

Count:1147
Name: EmperorBTC's VWAP Strategy
Description: EmperorBTC's VWAP Indicator & Strategy v2.1 coded by Bogdan Vaida This indicator was created after EmperorBTC's conditions. Good timeframes for it: 30', 15', 5' To convert from strategy to study switch the commented lines in the beginning and at the end of the script and vice versa. What this indicator does is to check if: o Pivot Point was...

Count:1145
Name: Catch the Big Fish
Description: Volume based script to catch a big move. Works best on 5 min timeframe. The default sma duration for volume is set to 150 = number of candles in 5 mins timeframe for 2 days. Heavy volume is defined as = more than 9 times of sma. Both parameters are configurable. Trading strategy: Long buy at high / Short sell at low of the candle where the script gives the...

Count:1139
Name: Renko Strategy V2
Description: Version 2.0 of my previous renko strategy using Renko calculations, this time without using Tilson T3 and without using security for renko calculations to remove repaint! Seems to work nicely on cryptocurrencies on higher time frames. == Description == Strategy gets Renko values and uses renko close and open to trigger signals. Base on these results the strategy...

Count:1138
Name: Low-High-Trend Strategy
Description: When asked what the key to successful investing was, Warren Buffet famously said “buy low, sell high.” Was he onto something? Today I am sharing with the community a simple “buy low, sell high” strategy with an optional trend filter and take-profit target. I’ve found that this strategy works well in a variety of markets but has a higher tendency to out-perform buy...

Count:1137
Name: LUBE
Description: This is a chart meant for 30m BTCUSD but could be used for many other assets, and there are inputs to play with. I decided on the strange title "LUBE" because I was measuring how many of the previous 500 bars had the current price level already been in. I wanted to discover when the price was in a new zone or an area that it hadn't spent much time in recently......

Count:1134
Name: Strategy Myth-Busting #20 - HalfTrend+HullButterfly - [MYN]
Description: #20 on the Myth-Busting bench, we are automating the " I Found Super Easy 1 Minute Scalping System And Backtest It 100 Times " strategy from " Jessy Trading " who claims 30.58% net profit over 100 trades in a couple of weeks with a 51% win rate and profit factor of 1.56 on EURUSD . This one surprised us quite a bit. Despite the title of this strategy indicating...

Count:1133
Name: SuperTrend Backtester
Description: This is a backtesting script for the famous Super Trend. Features - Custom Date Range - Custom Targets and Risks Requested by Dlatrella

Count:1130
Name: Noro's Trend MAs Strategy v2.0
Description: Don't use on pairs of type "crypto/crypto"! Only for pairs like "crypto/fiat" ("BTC/USD", "BTC/CNY", "ETH/USD", "ETH/CNY", etc) Trade strategy which uses only 2 MA. The slow MA (blue) is used for definition of a trend The fast MA (red) is used for an entrance to the transaction For: - For H1 - For crypto/fiat - Good for "BTC/USD", "ETH/USD" ...

Count:1120
Name: Strategy Death To The Bear
Description: Simple strategy for the indicator "Death To The Bear". Simple rules: - Entry according to the selected weapons. - Take profit 1 (TP1) in% of daily ATR (can be set, default 20%) - Active Stop in Breakeven when I take profit in TP1. - Take profit 2 (TP1) in% of daily ATR (can be set, default 30%) * Pyramidization can be changed from the...

Count:1118
Name: Combo Backtest 123 Reversal & Smart Money Index (SMI)
Description: This is combo strategies for get a cumulative signal. First strategy This System was created from the Book "How I Tripled My Money In The Futures Market" by Ulf Jensen, Page 183. This is reverse type of strategies. The strategy buys at market, if close price is higher than the previous close during 2 days and the meaning of 9-days Stochastic Slow...

Count:1113
Name: TICK Scalping strategy, SPY 1 min
Description: 1 min chart scalping version of my other TICK strategy with adjusted parameters and additional entry and exit conditions better suited for 1 min SPY chart. Please refer to my original TICK strategy for explanation. Important notes: 1. This strategy is designed for same day SPY option scalping on the 1 min chart . All profit shown in back testing report is...

Count:1106
Name: Juicy Trend
Description: This script is simple. It uses EMA and HMA crosses to find entries and exits. There is an option for sourcing Heikin Ashi based entries/exits. There is an option for Stop Loss percentage. It is made for finding Long entries on the 45min chart. You can optimize the signals by adjusting the moving average lengths. The default settings are for BTC/USDT...

Count:1106
Name: P2-V2 - BTC Strategy
Description: P2-V2 also known as Penner2.0 began with a TEMA and MA cross on Heiken Ashi, a strategy brought to us by a group of crypto traders. Since then we've added a few more indicators and played around with the rules. This is an early release as I have yet to go through the full automation aspect, however, I know some of you would like to see where it's at. If you'd...

Count:1102
Name: Combo Backtest 123 Reversal & Statistical Volatility
Description: This is combo strategies for get a cumulative signal. First strategy This System was created from the Book "How I Tripled My Money In The Futures Market" by Ulf Jensen, Page 183. This is reverse type of strategies. The strategy buys at market, if close price is higher than the previous close during 2 days and the meaning of 9-days Stochastic Slow...

Count:1099
Name: (IK) Grid Script
Description: This is my take on a grid trading strategy. From Investopedia: "Grid trading is most commonly associated with the foreign exchange market. Overall the technique seeks to capitalize on normal price volatility in an asset by placing buy and sell orders at certain regular intervals above and below a predefined base price." This strategy is best used on sideways...

Count:1095
Name: Strategy for UT Bot Alerts indicator
Description: Using the UT Bot alerts indicator by @QuantNomad, this strategy was designed for showing an example of how this indicator could be used, also, it has the goal to help some people from a group that use to use this indicator for their trading. Under any circumstance I recommend to use it without testing it before in real time. Backtesting context: 2020-02-05...

Count:1095
Name: PerfectStrategy
Description: This strategy is perfect for shorter time frames when used with heikin ashi you will end up profitable results. Works on every timeframe every stock currency pairs or commodity.

Count:1094
Name: Hull Fisher
Description: This strategy has a Fisher-Transform indicator applied to the highs and lows of a Hull moving average instead of the price. It also has a Commodity Channel Index to help with entry/exit. Each part of the strategy can be turned on and off, for example turn off CCI or HMA so they are not used in the order opening/exiting. The base of the strategies entry and exit...

Count:1090
Name: VWAPStrategy
Description: Cross ema3 with VWAP. Just to give imression of how a day migth be divided in a long- and short bias zone. Not suited as trading signal.

Count:1085
Name: VWMA/SMA 3Commas Bot
Description: This strategy utilizes two pairs of different Moving Averages, two Volume-Weighted Moving Averages (VWMA) and two Simple Moving Averages (SMA). There is a FAST and SLOW version of each VWMA and SMA. The concept behind this strategy is that volume is not taken into account when calculating a Simple Moving Average. Simple Moving Averages are often used to...

Count:1074
Name: AUTOMATIC GRID BOT STRATEGY [ilovealgotrading]
Description: OVERVIEW: This Grid trading strategy can help you maximize your profit in a ranging sideways market with no clear direction. INDICATOR: We can get some money by taking advantage of the movement of the price between the range we have determined. Short positions are opened while the price is rising, long positions are opened while the price is...


Count:1052
Name: Machine Learning: Gaussian Process Regression [LuxAlgo]
Description: We provide an implementation of the Gaussian Process Regression (GPR), a popular machine-learning method capable of estimating underlying trends in prices as well as forecasting them. While this implementation is adapted to real-time usage, do remember that forecasting trends in the market is challenging, do not use this tool as a standalone for your trading...

Count:1034
Name: Turtle System
Description: First pinescript strategy I've ever written so still learning what is possible. This strategy is based on the famous turtle system and tried to stay true to the rules within the confines of what pinescript will allow me to do. Features: Green lines represents the 20/55 day highs (configurable) Red lines represent the 10/20 day lows (configurable) ...

Count:1033
Name: Ichimoku with MACD/ CMF/ TSI
Description: This is a strategy made from ichimoku cloud , together with MACD, Chaiking Money FLOW and True Strenght Index. It can be adapted to any timeframe and any type of financial markets. The idea behind its very simple, We combine the long / short strategy from ichimoku, like cross between lines and below/above cloud together with histogram from MACD for...

Count:1022
Name: Multi-X by HamidBox
Description: Hello to All, introducing Multi Types Crossover strategy, simply the best way of trading with Crossover and Crossunder Strategy, How it Works??? I added 5 types of Moving Averages, 1: Simple Moving Average ( SMA ) 2: Exponential Moving Average ( EMA ) 3: Weighted Moving Average ( WMA ) 4: Volume Weighted Moving Average ( VWMA ) 5: Relative Moving Average...

Count:1019
Name: GRID SPOT TRADING ALGORITHM - GRID BOT TRADING STRATEGY
Description: GRID SPOT TRADING ALGORITHM : LONG ONLY STRATEGY OPEN SOURCE This is a long only strategy for spot assets. HOW IT WORKS Grid trading is a trading strategy where an investor creates a so-called "price grid". The basic idea of the strategy is to repeatedly buy at the pre-specified price and then wait for the price to rise above that level and then sell the...

Count:1015
Name: Donchian Breakout Strategy
Description: This strategy buys when the Donchian Channel is broken to the upside and uses the lower Donchian Channel line as a trailing stop. You can also choose to use a moving average as a filter to keep you out of trades that are counter trend. You can also configure which dates you want to backtest, so you can see how this behaves over specific time frames and market cycles.

Count:1013
Name: Double Exponential Moving Average 8-20-63 Strategy
Description: Hello, this script was made upon the request of aliergin63, one of my followers. I do not know exactly from whom it is quoted. (It may be author HighProfit.) Long position when 8 dema is over 20 dema and 63 dema, it opens a short position for the vice versa. Alarms have been added. %0.1 comission added. Regards. Note : DEMA = Double Exponential Moving Average

Count:1007
Name: CHOP Zone Entry Strategy + DMI/PSAR Exit
Description: This is a Strategy with associated visual indicators and Long/Short and Reverse/Close Position Alerts for the Choppiness Index (CHOP) . It is used to determine if the market is choppy (trading sideways) or not choppy (trading within a trend in either direction). CHOP is not directional, so a DMI script was ported into this strategy to allow for trend...

Count:994
Name: RSI and Smoothed RSI Bull Div Strategy [BigBitsIO]
Description: This strategy focuses on finding a low RSI value, then targeting a low Smoothed RSI value while the price is below the low RSI in the lookback period to trigger a buy signal. Features Take Profit, Stop Loss, and Plot Target inputs. As well as many inputs to manage how the RSI and Smoothed RSI are configured within the strategy. Explanation of all the...

Count:992
Name: BEST Trailing Stop Strategy
Description: Hello traders Here we go again.... with the second strategy snippet. Reminder: the first snipper was a Trailing Profit strategy script What's on the menu? A trailing stop is designed to protect gains by enabling a trade to remain open and continue to profit as long as the price is moving in the investor's favor. The order closes the trade if the price...

Count:985
Name: Stochastic Optimized Trend Tracker *Strategy*
Description: Stochastic OTT is Anıl Özekşi's latest derived version of Optimized Trend Tracker on Stochastic Oscillator. He tried to solve the fake signals of Stochastic Oscillator by adopting OTT on the indicator. He advised users to set the stochastic smoothing parameters to 500 and 200 on his latest video about SOTT. He personally uses 1 min charts on stock market so...

Count:980
Name: Joint Conditions Strategy Suite + TradingConnector alerts bot
Description: "Please give us combined alerts with the possibility of having several conditions in place to trigger the alert." - was the top voted request from users under one of the recent blogposts by TradingView. Ask and you shall receive ;) TradingView is a great platform, with unmatched set of functionalities, yet this particular combo of features indeed seems not to be...

Count:973
Name: DIY Custom Strategy Builder [ZP] - v1
Description: DISCLAIMER: This indicator as my first ever Tradingview indicator, has been developed for my personal trading analysis, consolidating various powerful indicators that I frequently use. A number of the embedded indicators within this tool are the creations of esteemed Pine Script developers from the TradingView community. In recognition of their contributions,...

Count:972
Name: Trailing Take Profit
Description: This script demonstrates how to do trailing take profit. With this approach instead of setting a limit order, when you hit the target you just follow the price upwards (for long positions) and you sell when the price drops by a small percentage. This approach will increase the profits (slightly) in every strategy! Be aware that the simulated data may produce...

Count:966
Name: SPY Master v1.0
Description: This is a simple swing trading algorithm that uses a fast RSI-EMA to trigger buy/cover signals and a slow RSI-EMA to trigger sell/short signals for SPY, an xchange-traded fund for the S&P 500. The idea behind this strategy follows the premise that most profitable momentum trades usually occur during periods when price is trending up or down. Periods of flat price...

Count:958
Name: Strategy Myth-Busting #2 - Braid Filter+ADX+EMA-Trend - [MYN]
Description: This is part of a new series we are calling "Strategy Myth-Busting" where we take open public manual trading strategies and automate them. The goal is to not only validate the authenticity of the claims but to provide an automated version for traders who wish to trade autonomously. Our second one we are automating is the " Braid Filter: The Indicator That Will...

Count:957
Name: Combo Backtest 123 Reversal & RSI
Description: This is combo strategies for get a cumulative signal. First strategy This System was created from the Book "How I Tripled My Money In The Futures Market" by Ulf Jensen, Page 183. This is reverse type of strategies. The strategy buys at market, if close price is higher than the previous close during 2 days and the meaning of 9-days Stochastic Slow...

Count:957
Name: Strategy - Bobo Intraday Swing Bot with filters
Description: This is an adapted version of my swing bot with additional filters that mean it works quite well on lower timeframes like 1min, 5 mins as long as you adjust the setting accordingly (reduce pivot timescale, band width) Entry conditions are filtered by an invisible trend calculation running in the background so the bot doesn't repeatedly try and fail to fade a...

Count:957
Name: Smart Money Breakouts [ChartPrime]
Description: The " Smart Money Breakouts " indicator is designed to identify breakouts based on changes in character (CHOCH) or breaks of structure (BOS) patterns, facilitating automated trading with user-defined Take Profit (TP) level. the indicator incorporates essential elements such as volume analysis and a data table to assist traders in optimizing their...

Count:956
Name: Donchian Channel Strategy [for free bot]
Description: I present to you a script for testing the Donchian channel breakout strategy for the Binance_exchange. This strategy is trending, and is especially effective for trading cryptocurrency futures. This strategy is very flexible, and you can configure virtually all possible parameters, moreover, separately for longs and separately for shorts. In the script, you can...

Count:950
Name: Pivot of Pivot Reversal Strategy [QuantNomad]
Description: Continue looking for more signifcant pivot points. This script is based on my "Significant Pivot Reversal Strategy". In this strategy I use concept of pivot of pivot points. So for PoP I require that pivot highs point should have 2 lower pivot highs points around them and pivot low 2 higher pivot lows points. Transparent lines represent usual pivot levels...

Count:946
Name: Forex Scalping 1min Bollinger Bands, RSI and ADX Trading System
Description: This is a Forex Scalping Trading Sytem based on the Bollinger Bands. Its suited for major pairs, with lowest possible comission (below 1 pip) and with timeframes ranging between 1-15 min. Indicators: Bollinger bands ADX RSI Rules for entry: Long Entry: price to move below the upper Bollinger Bands RSI raise above the 30 line and ADX<32 at the same...

Count:945
Name: KSR Strategy
Description: self input Moving Average crossover with trend indicator which eliminates most of false signal

Count:944
Name: HLC3/Kaufman Strategy
Description: This is an upgrade of the old Heikin/Kaufman Strategy. This script DONT use Heikin value anymore, so I hope no more repaint. Try it and let me know. Use an ADX indicator can help to check the strenght of the trend.

Count:943
Name: Two Take Profit Strategy
Description: This script is for research purposes only. I am not a financial advisor. Entry Condition This strategy is based on two take profit targets and scaling out strategy. The entry rule is very simple. Whenever the EMA crossover WMA, the long trade is taken and vice versa. Take Profit and Stop Loss The first take profit is set at 20 pips above the long entry and...

Count:942
Name: Multi-Oscillator Divergence Strategy
Description: Note: This is a modified version of TradingView's built-in "Divergence Indicator" and applied in "Strategy" format to show back testing results It finds bullish and bearish divergence in a selection of well known MA formulas: MACD, RSI, STOCH, DETRENDED PRICE OSCILLATOR, MOMENTUM. I've found good results even on 1 minute charts! In this example the chart...

Count:936
Name: Stochastic + ATR
Description: Stochastic oscillator with dynamic buy/sell levels. Levels calculate with volatility/averag true range. No repaint

Count:923
Name: How to use Leverage and Margin in PineScript
Description: En route to being absolutely the best and most complete trading platform out there, TradingView has just closed 2 gaps in their PineScript language. It is now possible to create and backtest a strategy for trading with leverage. Backtester now produces Margin Calls - so recognizes mid-trade drawdown and if it is too big for the broker to maintain your trade,...

Count:921
Name: Elder Ray (Bull Power) TP and SL
Description: Developed by Dr Alexander Elder, the Elder-ray indicator measures buying and selling pressure in the market. The Elder-ray is often used as part of the Triple Screen trading system but may also be used on its own. Dr Elder uses a 13-day exponential moving average (EMA) to indicate the market consensus of value. Bull Power measures the ability of buyers to...

Count:917
Name: BTC 15 min
Description: This strategy try to catch the uptrend mainly (seems to work on BTC 15 less on others) the aim is to get 2% in uptrend which is more easy to do then to search only for lowest since it buy in uptrend it can risky if market change direction there are two take profit (1% and 2% ) , you take out 50% of equity after the first 1% gain the stop loss and re buy set...

Count:916
Name: Ichimoku TK Cross > EMA200 Crypto Strategy
Description: Ichimoku strategy for cryptocurrency trading. Enters trades on bullish tenkan-kijun crosses when price is above 200 EMA which suggests a long-running bullish trend.

Count:914
Name: EMA Crossover Strategy
Description: Moving average crossover systems measure drift in the market. They are great strategies for time-limited people. So, why don't more people use them? I think it's due to poor choice in choosing EMA lengths: Market Wizard Ed Seykota has a guideline for moving average crossovers: the slow line should be at least 3x the fast line. This removes a lot of the whipsaws...
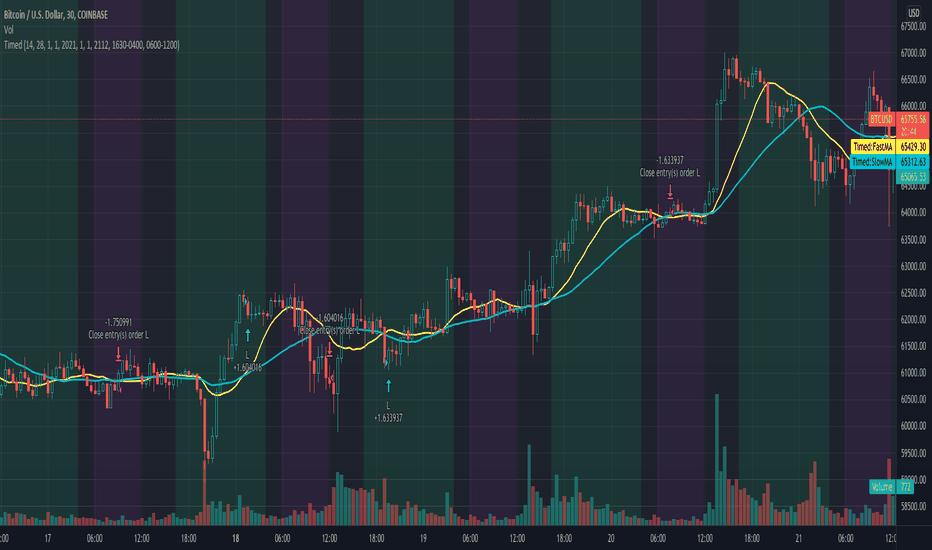
Count:914
Name: How To Set Backtest Time Ranges
Description: Example how to set the time range window to be backtested for both entries and exits. Additional examples are also included showing how to set the date range and toggle plot visibility. By incorporating this code with your own strategy's logic, it will allow you to backtest various time windows. Much gratitude to @LucF and @a.tesla2018 for help with including...

Count:913
Name: Buying Dip Strategy With Take Profit And Stop Loss [racer8]
Description: "Buy low, sell high." This system buys the dip and takes profit for a high win rate. It uses an ATR take profit and ATR stop loss. It buys the dip when the close is below the previous 7 day low. Daily timeframe is best. Enjoy ♡

Count:912
Name: 4MA Strategy
Description: Uses 4 Ma cross... Double Hull Moving Averages Volume Weighted Moving Average Weighted Moving Average <<<<< by SeaSide420 >>>>>>

Count:907
Name: Hull MA TimeFrame CrossOver
Description: Hello traders, Although this strategy is configured on BTCUSDT , with a changing of settings, it can be used on any trading instrument. Here it is seen, on the 2 hour chart. With Trading Fees included in result (adjust to suit your exchange fees). The candle crossover is set to Daily timeframe. That means that the Candle crossover is going to see if todays price...

Count:906
Name: Technicals Rating Strategy v420
Description: Ichimoku, HMA, RSI, Stoch, CCI, MACD, Technicals Rating Strategy is a trading Bot that looks at these chosen indicators and assigns a value to each, then calculates the result of adding each indicators result value to a overall rating, which is then compared to a user set level. Here seen on Bitcoin, it has the broker fee included in the testing result. If you...

Count:903
Name: 🐮 🆚 🐻 [Backtest]
Description: It's a remake of the previous script but for use in reverse positions at the same time. In this script the reality could be even better than the Backtest, because, only close the position with profit, so profitability should be 100%, and Longs and Shorts don't mix because they are independent. In real trade, you need an exchange that allows you to go in reverse...

Count:903
Name: Pivot Reversal Strategy with backtest date range
Description: This is standard Pivot Reversal Strategy with backtest date range added. In parameters you can select from/to date for backtesting range.

Count:901
Name: Ichimoku Kumo Twist Strategy with Presets [Krypt]
Description: A simple strategy for testing Ichimoku settings used in the following indicator:

Count:901
Name: MTF stochastic strategy
Description: This strategy is based on MTF strategy found on Forex Factory forum and published by bobby2 (credits to him). This is quite simple but need improvement to work properly: 1- it is made for 5 min chart 2- when 15min stochastic cross above 50 and 5min stochastic is rising, buy 3- when 15min stochastic cross below 50 and 5min stochastic is falling, sell

Count:898
Name: Predictive Channels [LuxAlgo]
Description: The Predictive Channels indicator is a real-time estimate of a trend channel. The indicator returns 2 resistances, 2 supports, and an average line. 🔶 USAGE The Predictive Channels attempt to find a real-time estimate of an underlying linear trend in the price, the returned supports/resistances are constructed from this estimate. The area between the...

Count:896
Name: DAX Shooter 5M Strategy
Description: This is a simple strategy that applies very well for scaling indices to 5 minutes especially for the DAX. The algorithm provides for buying or selling when the market is very "pulled". The rules are as follows: you buy when: 1- The ADX indicator with the standard settings is greater than 32. 2- the RSI indicator set to 7 periods is crossing upwards the oversold...

Count:893
Name: Bill Williams. Awesome Oscillator (AO) Backtest
Description: This indicator is based on Bill Williams` recommendations from his book "New Trading Dimensions". We recommend this book to you as most useful reading. The wisdom, technical expertise, and skillful teaching style of Williams make it a truly revolutionary-level source. A must-have new book for stock and commodity traders. The 1st 2...

Count:889
Name: Uhl MA System - Strategy Analysis
Description: The Uhl MA crossover system was specifically designed to provide an adaptive MA crossover system that didn't committed the same errors of more classical MA systems. This crossover system is based on a fast and a slow moving average, with the slow moving average being the corrected moving average (CMA) originally proposed by Andreas Uhl, and the fast moving average...

Count:888
Name: Moving Average Scalper
Description: The main goal of a scalping strategy is to open and close trades frequently, profiting from small gains and limiting the downside risk. This strategy, on average, manages to close trades within one day, meaning that you are not exposed to the risk of holding that coin for long. In this way, market conditions affect much less the overall performance of the trading...

Count:885
Name: Simple EMA Long Only Strategy
Description: Simple EMA long only strategy, using ATR on crossings to minimize fake signals.

Count:884
Name: Simple RSI strategy
Description: so this script just take it as teaching how to make easy strategy many time we try complex one and we fail thanks to coinrule for his very smart method of pyramid i just here in this very simple rsi strategy want to show how even lame strategy like RSI can be very profitable:) 1. we exit by take profit 2. we make sure that for exit by take profit the stop loss...

Count:881
Name: cRSI + Waves Strategy with VWMA overlay
Description: Strategy based on my cRSI with motive/corrective wave indicator. Please note that it is far from perfect. I use it mostly to help me identify good entry and exit points when combined with my other technical analysis. It misses some obvious points, but on average it does pretty well. The challenge often is indicating when you have sufficient change in the cRSI to...

Count:881
Name: Strategy Template
Description: This is the fastest way to create a Trading View strategy. The template I have created includes stoploss and take profit enabling and plotting, date range, and strategy buy and sell conditions. I believe this will benefit the people in the Trading View community by creating a strategy faster and more efficiently than just repeating pine script code. All that needs...

Count:878
Name: SSL Hybrid + QQE Strategy
Description: SSL Hybrid strategy combining QQE MOD as trade entry filter. Rules to enter LONG: SSL1 is under lower baseline lower QQE histogram bar is blue QQE line is above 0 Rules to enter SHORT: SSL1 is under above baseline upper QQE histogram bar is red QQE line is below 0

Count:877
Name: CoGrid Management
Description: This strategy uses grid levels determined by pivot points based on the selected time period. It's useful for swing trading without leverage, spot trading or for Hold management. If the price goes down we buy and if it continues to go down we keep buying improving the average price. When the price rises above the average entry price, we sell and if it continues to...

Count:874
Name: Strategy Quadratic Semaphore
Description: I add a basic strategy for the "Quadratic traffic light" indicator, it can help to find a good configuration. Regards.

Count:873
Name: Two Take Profits and Two Stop Loss
Description: This script is for research purposes only. I am not a financial advisor. Entry Condition This strategy is based on two take profit targets, two stop loss, and scaling out strategy. The entry rule is very simple. Whenever the EMA crossover WMA, the long trade is taken and vice versa. Take Profit and Stop Loss The first take profit is set at 20 pips above the long...

Count:873
Name: Gap Filling Strategy
Description: Gaps are market prices structures that appear frequently in the stock market, and can be detected when the opening price is different from the previous closing price, this is why gaps are also called "opening price jumps". While gaps can occur frequently, some of them are more significant than others, and can be observed when looking at a long term chart. The...

Count:868
Name: 3Commas Bollinger Strategy
Description: This strategy is intended for use as a way of backtesting various parameters available on 3commas.io composite bot using a bollinger band type trading strategy. While it's primary intention is to provide users a way of backtesting bot parameters, it can also be used to trigger a deal start by either using the {{strategy.open.alert_message}} field in your alert and...

Count:867
Name: RSI-VWAP
Description: Backtest script based on the previous RSI-VWAP indicator: It's the popular RSI indicator with VWAP as a source instead of close: - RSI_VWAP = rsi(vwap(close), RSI_VWAP_length) What is the Volume Weighted Average Price ( VWAP )? VWAP is calculated by adding up the dollars traded for every transaction (price multiplied by the number of shares traded) and then...

Count:863
Name: Gold/Silver 30m Only Strategy Buy/Sell Signals
Description: In my free time I felt like coding this strategy, and after backtesting it, it appears that the 30m time frame is the most profitable. I only have been working on it for gold, but it should work similarly for silver as well. This includes no pyramiding, and with pyramiding orders of 5, this strategy is upwards of 100% profitable. Buy order - when price is above...

Count:863
Name: TradingView Alerts to MT4 MT5 - Forex, indices, commodities
Description: Howdy Algo-Traders! This example script has been created for educational purposes - to present how to use and automatically execute TradingView Alerts on real markets. I'm posting this script today for a reason. TradingView has just released a new feature of the PineScript language - ALERT() function. Why is it important? It is finally possible to set alerts...

Count:861
Name: SUPPORT RESISTANCE STRATEGY [5MIN TF]
Description: A SUPPORT RESISTANCE BREAKOUT STRATEGY for 5 minute Time-Frame , that has the time condition for Indian Markets The Timing can be changed to fit other markets, scroll down to "TIME CONDITION" to know more. The commission is also included in the strategy . The basic idea is when , 1) Price crosses above Resistance Level ,indicated by Red Line, is a Long...

Count:861
Name: [AutoView] Trailing Stop Back Testing and alerts + TP and TS
Description: The number one request since the creation of autoview was to have alerts triggered for Take Profit, Stop Loss and Trailing Stops. Finally, we've figured it out, and as an additional bonus, this allows us to back test trailing stops in the strategy tester. YouTube Video about this script and setup: bit.ly This script contains 2 things people have been asking...

Count:859
Name: Heiken Ashi + Ichimoku Kinko Hyo Strategy
Description: Heikin-Ashi: Instead of using the open-high-low-close (OHLC) bars like standard candlestick charts, it uses a modified formula. Out of which only following two are used in this strategy. High = Max (High,Open,Close) Low = Min (Low,Open, Close) Ichimoku Kinko Hyo: The Ichimoku Kinko Hyo system includes five kinds of signal, of which this strategy uses...

Count:859
Name: Super trend V Strategy version
Description: This is the strategy of Super trend V indicator it not calculating the TP points which can make it much more proftible in theory just the buy and sell of the super trend youy can choose long only short only or both directions


Count:857
Name: Orion Algo Strategy v2.0
Description: Hi everyone. I decided to make the latest Orion Algo open to people. I don't have enough time to work on it lately, so I figured it would be best that everyone can have it to work on it. I took out some stuff from the original but it should give an idea on how things work. I made two strategies with this so far so you can use that to come up with your own. I...

Count:852
Name: Camarilla Pivot Points V2 Backtest
Description: Camarilla pivot point formula is the refined form of existing classic pivot point formula. The Camarilla method was developed by Nick Stott who was a very successful bond trader. What makes it better is the use of Fibonacci numbers in calculation of levels. Camarilla equations are used to calculate intraday support and resistance levels using the previous...

Count:852
Name: Narrow Range + Inside Day, Short Only Strategy (by ChartArt)
Description: This short only strategy determines when there is both a NR7 (narrow range 7, a trading day in which the range is narrower than any of the previous six days), plus a inside day (high of the current day is lower than the high of the previous day and the low of the current day is higher than the low of the previous day) both on the same trading day and enters a...

Count:850
Name: JS-TechTrading: VWAP Momentum_Pullback Strategy
Description: General Description and Unique Features of this Script Introducing the VWAP Momentum-Pullback Strategy (long-only) that offers several unique features: 1. Our script/strategy utilizes Mark Minervini's Trend-Template as a qualifier for identifying stocks and other financial securities in confirmed uptrends. NOTE: In this basic version of the script, the...

Count:846
Name: Trend Reversal Alerts Strategy [4H/3M]
Description: This is advanced version of T-R.A.S with better logic adapted for 4hour / 3month timeframes

Count:843
Name: Robot WhiteBox ShiftMA
Description: This script of strategy is necessary for testing of parameters of the WhiteBox TradingBot. Strategy The blue line is SMA. The lime line = SMA - the shift parameter (%). Red line = SMA + shift parameter (%). Strategy uses limit orders. For opening of positions and for closing of positions. If the price is lower than the lime line - opens a long position. If...

Count:842
Name: Vegas Tunnel strategy
Description: Apply Vegas Tunnel, Use EMA144 169 as medium-term trend support Also use EMA 576 676 and 4 multiples of 144 and 169 as long-term support and trend direction Also increase EMA 36 43 as a short-term trend support Suitable for stocks, indices, commodities The applicable time scale can back-test the usability of the strategy by itself, and select the most applicable...

Count:840
Name: Price Action with MACD Barcolor + Insidebar + Fakey + Key level
Description: EMA 89 and Hull MA 89 used to filter trading signals and working as support and resistance. When both of them are red, market is bearisk, only short. When both of them are green, market is bullish, only long. when there is 1 green and 1 red, market is neutral, can short or long. Enjoy and happy trading! You can follow me there: www.facebook.com you are welcom!

Count:839
Name: SlingShot + MTF + Open Close Cross Strategy
Description: It's a merge of three really good scripts CM sling shot, CM MTC and Open Close Cross Indicates open and close with Sling shot and shots after peaks by MTC and OCC. Yellow zones before drop prices, green bar, red bar for open and close. imgur.com

Count:838
Name: Zendog V3 backtest DCA bot 3commas
Description: MAJOR UPDATE: - Update to Pinescript v5 - MAJOR refactor for the logic of how orders are placed. BO order is placed when the condition is first encountered and we are not in a deal. The extra SO orders (if based on price movement) are all placed on the next candle after BO order, instead of each being placed one after another. Take profit (if percentage) and Stop...

Count:834
Name: MACD/EMA Long Strategy
Description: This incredibly simple strategy uses a combination of the 20 EMA and bullish/bearish MACD crosses as a low risk method of getting in and out of markets. Depending on whether the market is above or below the 200 SMA, the script determines if the market is in bullish or bearish territory. Above the 200 SMA, the script will ignore the 20 EMA as a buy condition and...

Count:832
Name: Turtle trading strategy (Donchian/ATR)
Description: Strategy based on Turtle Trading Strategy from William Eckhardt and Richard Dennis - Considers entering trades on breakout of Donchian channels (upper for long, lower for short) (Default length = 20 for daily) - Considers exiting trades on breakout of Donchian channels (lower for long, upper for short) with lower length (10 for daily) - Uses 2N ATR (default) as stop loss

Count:828
Name: Strategy - Stochastic Crosses in Trending Market
Description: This strategy is based on Stochastic Crosses happening in the Oversold/Overbought area, taken into account the current trend which is determined by an EMA pair. (Only Longs in uptrend / only Shorts in downtrend) - Long position is closed when Stochastic is entering Overbought area - Short position is closed when Stochastic is entering Overbought...

Count:827
Name: QuantCat Intraday Strategy (15M)
Description: QuantCat Intraday Strategy This strategy is designed to be used on the 15 minute time frame, on liquid x/btc pairs and BTC/USD. It works by having 2 moving averages, automatic stop loss calculation, and taking positions on MA crosses and MA zone bounces for confirmation. Stoploss is so crucial to minimise any damage from huge unexpected candles, the...

Count:827
Name: Ichimoku Cloud Back test
Description: Very simple ichimoku strategy Buy above the cloud and sell below it

Count:826
Name: Stochastic Trend
Description: Dear community, I've made another simple trading bot for you to use. This bot is based on the Stochastic Oscillator. It only produces long trades currently. I changed the oscillation period to a much longer one, which in turn creates opportunities to trade long term trends. The bot goes long when the Entry lines is crossed from below and it will close its long...

Count:821
Name: NOT-ONLY-SHORT
Description: This script is the same as NOT-ONLY-LONG but without the security() function. It use the following indicators: RMI + ADX + RSI + ICHIMOKU cloud only. The fuchsia dot is the average price of the positions. The Take Profit is calculated from there. It does not have Stop Loss, instead it makes a re-entry to try to improve the liquidation price. Enjoy!

Count:820
Name: Fractal Breakout Strategy
Description: Fractal A type of pattern used in technical analysis to predict a reversal in the current trend. A fractal pattern consists of five bars and is identified when the price meets the following characteristics: 1. A shift from a downtrend to an uptrend occurs when the lowest bar is located in the middle of the pattern and two bars with successively higher lows are...

Count:820
Name: MACD+CCI Strategy
Description: a simple strategy based on Joseph Nemeth MACD+CCI strategy Reference reading: sites.google.com

Count:819
Name: Trend Lines [LuxAlgo]
Description: Our new "Trend Lines" indicator detects and highlights relevant trendlines on the user chart while keeping it free of as much clutter as possible. The indicator is thought for real-time usage and includes several filters as well as the ability to estimate trendline angles. 🔶 USAGE Trendlines can act as support/resistance, with a higher number of tests...

Count:817
Name: BEST ATR Stop Multiple Strategy
Description: Hello traders Here we go again.... with another strategy snippet. Reminder: it's an alternative of this Trailing Stop strategy script Entry logic The entry is based on a Simple Moving Averages (SMA) cross. This part doesn't matter here - as I wanted to focus on the ATR multiple stop loss component. ATR STOP This strategy snippet uses an entry stop loss...

Count:815
Name: DEMA Strategy with MACD
Description: The Double Exponential Moving Average (DEMA) indicator was introduced in January 1994 by Patrick G. Mulloy, in an article in the "Technical Analysis of Stocks & Commodities" magazine: "Smoothing Data with Faster Moving Averages" It attempts to remove the inherent lag associated to Moving Averages by placing more weight on recent values. The name suggests this is...


Count:813
Name: Cueing Off Support And Resistance Levels Backtest
Description: Cueing Off Support And Resistance Levels, by Thom Hartle modified by HPotter for trade signals. The related article is copyrighted material from Stocks & Commodities. You can change long to short in the Input Settings Please, use it only for learning or paper trading. Do not for real trading.

Count:812
Name: Smart Money Index (SMI) Backtest
Description: Attention: If you would to use this indicator on the ES, you should have intraday data 60min in your account. Smart money index (SMI) or smart money flow index is a technical analysis indicator demonstrating investors sentiment. The index was invented and popularized by money manager Don Hays. The indicator is based on intra-day price patterns. The main...

Count:808
Name: Swing/Scalper HULL + T3 avg Crypto Strategy
Description: This is a both a swing and a scalper strategy(depends on the timeframe that you use), that works with all timeframes, however I noticed that with swing 3h works the best on most crypto pairs, such as ETH, BTC and so on. Its main components are: Hull moving average T3 moving average Risk management With them I make an average and use it as the main moving...

Count:807
Name: No Nonsense NNFX VP Strategy for Back Testing | jh
Description: My first script, be kind :) Most of the rules are implemented: - Money management - ATR, Baseline, Confirmation, Volume, Exit More details...

Count:805
Name: Strategy Template - V2
Description: This is an educational script created to demonstrate few basic building blocks of a trend based strategy and how to achieve different entry and exit types. My initial intention was to create a comprehensive strategy template which covers all the aspects of strategy. But, ended up creating fully fledged strategy based on trend following. This is an enhancement on ...

Count:805
Name: Rocket Grid Algorithm - The Quant Science
Description: The Rocket Grid Algorithm is a trading strategy that enables traders to engage in both long and short selling strategies. The script allows traders to backtest their strategies with a date range of their choice, in addition to selecting the desired strategy - either SMA Based Crossunder or SMA Based Crossover. The script is a combination of trend following and...

Count:805
Name: robotrading ZZ-8 fractals
Description: This is another version of my ZZ type strategy. This script now uses Bill Williams' fractals. Strategy Step 1: Calculate Bill Williams' Fractals Step 2. A line is drawn from the fractal Step 3. Create a stop order to enter the position on the line Trading If the price is above the lime line, open a long position (and close a short position). If the price...

Count:805
Name: *Backtesting System
Description: ⚉ OVERVIEW ⚉ One of the best Systems for Backtesting your Strategies. Incredibly flexible, simple, fast and feature-rich system — will solve most of your queries without much effort. Many systems for setting StopLoss, TakeProfit, Risk Management and advanced Filters. All you need to do is plug in your indicator and start Backtesting . I intentionally left the...

Count:805
Name: TRAILING STOP LOSS TO LONG AND SHORT
Description: ##THIS SCRIPT IS ON GITHUB This TradingView strategy it is designed to integrate with other strategies with indicators. It performs a trailing stop loss from entry and exit conditions. In this strategy you can add conditions for long and short positions. The strategy will ride up your stop loss when price moviment 1%. The strategy will close your operation when...

Count:804
Name: Growth Producer
Description: Applicable to FTX:ETHPERP 15 min Relative volatility index (RVI) that will determine the entry and exit points only when the volatility will start to increase and Money Flow index as an additional point for entry. IMPORTANT • Input Partial take profits in your Bot settings • This is a trend strategy and works better in the trending market • We added the...

Count:803
Name: SPY 1 Minute Day Trader
Description: When scalping options, users are looking for where breakouts are going to occur instead of sitting thru areas choppy price action that drain delta and cause them to lose value even if price is up trending. This script tries to identify when a trend reversal is expected based on one minute price action on the SPY. It alerts users to prepare for potential breakout...

Count:802
Name: Qullamaggie Breakout V2
Description: After publishing the Qullamaggie Breakout script and seeing that it had some decent results, I wanted to explore it a bit further. There were a few things I didn't like about that methodology that didn't really jive with the way I like to trade. So what I did was combined the Breakout Trend Follower strategy I had been using for entries with the Qullamaggie...

Count:802
Name: Moving Average Displaced Envelope & ATRTS
Description: Moving Average Displaced Envelope. These envelopes are calculated by multiplying percentage factors with their displaced expotential moving average (EMA) core. How To Trade Using: Adjust the envelopes percentage factors to control the quantity and quality of the signals. If a previous high goes above the envelope a sell signal is generated. Conversely,...

Count:800
Name: MACD, RSI, & RVOL Strategy
Description: This strategy combines the use of MACD (12, 26, 9), RSI (14, 30, 70), and RVOL (14) to create Long Buy and Sell signals. This works well with many different time intervals but was developed with 15-minute intervals in mind. Using MACD as a reference, the strategy identifies when the MACD line crosses over (a factor in a buy signal) and under (a factor in a Sell...

Count:800
Name: Ichimoku Kinko Hyo + HULL-MA_X + MacD
Description: The Ichimoku Kinko Hyo system includes five kinds of signal, of which this strategy uses the most recent of ones i.e. Tenkan Sen / Kijun Sen Cross and price crosses the Kijun Sen. As the Chikou Span, Senkou Span A and Senkou Span B are shifted into the past/future, the trigger signals will be only be used for visual confirmation and not part of the strategy. The...

Count:798
Name: Martin Pring's Special K Backtest
Description: Pring's Special K is a cyclical indicator created by Martin Pring. His method combines short-term, intermediate and long-term velocity into one complete series. Useful tool for Long Term Investors Modified for any source. You can change long to short in the Input Settings Please, use it only for learning or paper trading. Do not for real trading.

Count:797
Name: [astropark] Moon Phases [strategy]
Description: Dear Followers, today I'm glad to present you an indicator which calculates Moon Phases and let's you backtest the simplest strategy over it: buy/sell on full moon and do the opposite on new moon. This is a public free indicator based on the public one by @paaax: I added my usual backtesting logic, plus some more customization inputs for easy coloring. The...

Count:791
Name: Breakout Trend Follower Strategy
Description: This strategy goes long when highs are broken and uses a trailing stop that follows swing lows. User can configure a back test date range and choose whether or not to only take trades above a selected moving average. The desire for me to make this script was to try to capture those extreme breakouts that can occur after a consolidation/equilibrium pattern. This...

Count:786
Name: Kozlod - Heikin-Ashi Bar Color Change Strategy
Description: You can use this script to backtest Heikin-Ashi bar color change strategy. You have to apply this script to usual candles and not Heikin-Ashi!!! Background color indicates HA bar color. On change you'll see green/red arrows and alert will be fired. Also you can find in the code calculations of all HA OHLC values.

Count:785
Name: ATR Trailing Stops Strategy
Description: Update of Average True Range Trailing Stops Strategy by HPotter to include backtesting support Opens longs when price crosses over trailing stop line, closes when price crosses below Option to open/close shorts when longs are closed/opened Option to specify a time range to test over. For example, set Max Days Back to 360 and Min Days Back to 180 to test...

Count:784
Name: Hash Ribbons Backtest - Bitcoin Beats YT
Description: Hello Hello Hello and welcome back to Bitcoin Beats! This is a script written by capriole_charles Go check out the original! I have added leverage and stoploss % but also made it a strategy so we can look back at past trades to see patterns and profit. Personally I feel this is not enough data to trade off as BTC is such a young asset. However I have seen other...

Count:782
Name: Fractal Breakout Strategy [KL]
Description: Fractal Breakout Strategy This strategy will enter into a Long position when (a) bullish fractal is formed, combined with (b) ATR is relatively low. Trailing stop loss is set based on ATR. Bullish fractal pattern : A bullish fractal pattern looks like this: It is formed when lower-low has reached a local minimum followed by higher-lows. By default, this...

Count:781
Name: quit your bullshit! Heikin-Ashi Backtest with Real Candle Values
Description: Made in a few minutes to debunk all the bullshit going around tradingview and everywhere about "heikin-ashi" being a holy grail trend indicator. Do not be deceived. Heikin-Ashi is a beautiful way to remove much of the noise in markets, and is light on the eyes. (nice and smooth!) I personally use heikin-ashi as a way to remove a lot of the clutter in the markets,...

Count:777
Name: NoNonsense Forex - high timeframe trading absurd NON-REPAINTING
Description: Some time ago I bumped into NoNonsense Forex - pretty good-looking course with well-designed videos, reasonable rules, etc. Nice explanatory videos, not selling anything, building indicators-only strategy. But there was one thing that really annoyed me - it was supposed to work only on Daily timeframe. What is the point in trading such high timeframe, if decisions...


Count:773
Name: Noro's RiskTurtle Strategy
Description: The idea of this strategy script was taken here: (PDF-Book, English) bigpicture.typepad.com Strategy 2 Donchian price channels are being created. Fast and slow. The number of candles for the channels is selected by the user. By default, 20 bars for fast and 50 bars for slow. Blue lines show a slow price channel . And used to enter positions. Using market...

Count:772
Name: Moving Average Strategy of BiznesFilosof
Description: What is brilliant is simple! Therefore, this strategy works very well. It is configured on bitcoin. But you can use it for other tools. Only need to change the settings. Remember that this is not a panacea, but only an assistant! You yourself have to choose which entry and exit points to choose. In more detail about strategy on my channel in YouTube. === Что...

Count:772
Name: Squeeze Momentum Strategy [LazyBear] Buy Sell TP SL Alerts
Description: -Modified version of Squeeze Momentum Indicator by @LazyBear. -Converted to version 5, -Taken inspiration from @KivancOzbilgic for its buy sell calculations, -Used @Bunghole strategy template with Take Profit, Stop Loss and Enable/Disable Toggles -Added Custom Date Backtesting...

Count:769
Name: Combo 2/20 EMA & Accelerator Oscillator (AC)
Description: This is combo strategies for get a cumulative signal. First strategy This indicator plots 2/20 exponential moving average. For the Mov Avg X 2/20 Indicator, the EMA bar will be painted when the Alert criteria is met. Second strategy The Accelerator Oscillator has been developed by Bill Williams as the development of the Awesome Oscillator. It...

Count:766
Name: Robot WhiteBox MultiMA
Description: Script for backtesting of the trading strategy of the robot. Strategy similar to the strategy of ShiftMA, but is used on 3 limit orders, instead of one. Lime lines - for opening of a long position. Red lines - for opening of a short position. The blue line (always one) - for closing of any positions.

Count:762
Name: Donchian MA Bands [LuxAlgo]
Description: The Donchian MA Bands script is a complete trend indicator derived from the popular Donchian channel indicator as well as various customizable moving averages to estimate trend direction and build support/resistance levels & zones. 🔶 USAGE The indicator outputs various elements, the main ones being a lower dynamic zone (blue by default), an upper...

Count:761
Name: Heikin/Kaufman Non-Repaint
Description: Non-repaint version of Heikin/Kaufman strategy published by Marco ()

Count:761
Name: MTF Trailing SL Strategy [QuantNomad]
Description: This is a Multi-Timeframe version of my Trailing SL Strategy. Few weeks ago I published Trailing SL Strategy. There I used only basic Trailing SL to enter positions. It worked pretty well so I tried to work on it a bit. I thought what if you can use the same ATR TSL on different timeframes and combine them into one signal. In this strategy you can use only ATR...

Count:761
Name: MultiCross v4.20
Description: Quad-HullMA-cross & VWMA & MacD & TSI combination Version 4.20 added script for strategy settings to be already correct when strategy loads onto chart: calc_on_order_fills= true, calc_on_every_tick=true, default_qty_type=strategy.percent_of_equity, default_qty_value=100, pyramiding=0

Count:756
Name: Forex Fractal EMA Scalper
Description: This is a forex scalper designed for very short timeframes 1-5 min max. At the same time due to the short timeframe, is recommend to re optimize it weekly . Its components are Fractals Triple EMA with different lengths Rules for entry: For long : we have an up fractal and all 3 ema are in ascending order For short: we have a down fractal and all 3 ema are in...

Count:756
Name: Linear trend
Description: By request of a user I just put this indicator which is a linear regression that work on same logic as super trend the control is by length (len) and the deviation there is alerts and signals try to find best settings according to your needs it can done in a different way as well this one seems to work nice on stocks

Count:753
Name: 14/28 Day SMA Divergence and RSI - No Repaint
Description: If you are interested in purchasing my algorithmic trading bot that receives Tradingview indicator alerts via email and then executes them in Bittrex, please visit my product page here: ilikestocks.com Additionally, I would love to create video/blog guides on creating Tradingview scripts or strategies. If you are a knowledgeable in finance or other related fields...

Count:748
Name: MACD + RSI + EMA + SMA + Ichimoku + overbought + buy, sell +Doji
Description: // MACD + EMA 200 *** buy and sell strategy (RSI, EMA, SMA) *** Doji Harami *** overbought and oversold *** trend direction *** divergence *** Ichimoku Use this script in time 1h

Count:745
Name: Stochastic Strategy of BiznesFilosof
Description: This strategy allows you to test the stochastic indicator, as well as adjust it to a specific trading pair. The parameters indicated in the books are too approximate and have nothing to do with modern reality. The optimal parameters for Bitcoin are now set. You can customize better for yourself. This strategy allows you to make settings. === Эта стратегия...

Count:745
Name: RSI Divergence Strategy
Description: what is "RSI Divergence Strategy"? it is a RSI strategy based this indicator: what it does? it gives buy or sell signals according to RSI Divergences. it also has different variables such as "take profit", "stop loss" and trailing stop loss. how it does it? it uses the "RSI Divergence" indicator to give signal. For detailed information on how it works, you...

Count:743
Name: Multi MA Trend Following Strategy Template
Description: Trend following is one of the better known technical trading strategies. But, which trend should you follow? Today I am sharing with the community a trend following template script that includes a selection of over 20 different trends / regressions. Some of these are in the Pine library, and some have been custom coded and contributed over time by the beloved Pine...

Count:740
Name: Mean Reversion w/ Bollinger Bands
Description: This is a more advanced version of my original mean reversion script. It employs the famous Bollinger Bands. This robot will buy when price falls below the lower Bollinger Band, and sell when price moves above the upper Bollinger Band. I've only tested it on the S&P 500, though you could try it out on other assets to see the backtest performance. During...

Count:738
Name: Oscillator Evaluator (Analysis tool)
Description: Oscillator Evaluator (Analysis tool) The oscillator evaluator is a tool that will help you analyse and compare the oscillator of your choice to another 2 oscillators. By selecting the strategy with which you will analyze the oscillators, you will be able to see the behaviour of the oscillators in different aspects. First there is a moving average increase or...

Count:738
Name: [STRATEGY]Kagi Emulator OCC & SLTP V3
Description: It is a Kagi candle emulator without resolution multiplier. Also with take profit and stop loss. Modify the value of "reversal" according to current symbol. It's the backtest, coming soon, same script but with no-repainting alerts Enjoy!

Count:733
Name: Squeeze Momentum Strategy based on Indicator [LazyBear][Bitduke]
Description: I improved Squeeze Momentum Indicator by LazyBear (momentum filter, changed data source to ohlc4) and transformed it into a strategy, adding a risk management system + ability to customize time frames for backtest. Shortly about Squeeze Momentum Indicator: This is a derivative of John Carter's "TTM Squeeze" volatility indicator, as discussed in his book...

Count:730
Name: Adaptive Zero Lag EMA v2
Description: This is my most successful strategy to date! Please enjoy and join the Open Source movement by sharing your code and ideas online! OPERATING PRINCIPLE The strategy is based on Ehlers idea that any indicator can be turned into a signal-producing trade system through smoothing and other filtering processes. In fact, I'm using his Zero Lag EMA (ZLEMA) as a baseline...

Count:727
Name: Noro's TrendMA Strategy
Description: The strategy uses 2 moving averages. Fast and slow. SMA or EMA - the user can select. Moving averages are needed to identify the direction of the trend. Trend If both moving averages are directed upwards, it 's uptrend. If both moving averages are pointing down, it 's downtrend. If the moving averages are directed in different directions, the trend has not...

Count:726
Name: Bollinger Band Breakout
Description: It is a long only strategy. 1. Buy when price breaks out of the upper band. 2. Exit has two options. Option 1 allows you to exit using lower band. Option 2 allows you to exit using moving average. 3. Option 1 preferred over option 2 if the instrument is highly volatile. 4. Slippage and commissions are not considered in the return calculation.

Count:725
Name: Simple Moving Average Crossover
Description: This strategy uses two moving averages of 21 and 8 to generate buy or sell signal. This is for purely intraday trades and best use in 15 min time frame This strategy uses angle/slope of ma to filter out period of sideways movement and only generate signals when the stock starts trending in one direction How to use this 1) Buy when the buy is generated 2)...

Count:724
Name: DRM Strategy
Description: One of the ways I go when I develop strategies is by reducing the number of parameters and removing fixed parameters and levels. In this strategy, I'm trying to create an RSI indicator with a dynamic length. Length is computed based on the correlation between Price and its momentum. You can set min and max values for the RSI, and if the correlation is close to 1,...

Count:723
Name: TrendLines with Alerts
Description: This isn't my own work, hence giving it in Open Source library for others to benefit from it too. I have tried to refin the output of trendlines in this Strategy The original Code is available at The script needs some modifications, so I'll be making further updates in future, but for now I'm publishing this because most people don't know how to track...

Count:721
Name: Pivot Point Reversal + RSI Strategy
Description: This strategy joins the Pivot Reversal strategy with the RSI indicator. We check RSI level at the pivot point level and only if RSI condition is satisfied we update levels for stop orders. The strategy works pretty good for crypto, 30m, 1h, 2h timeframes.

Count:719
Name: Volatility System by Wilder [LucF]
Description: The Volatility System was created by J. Welles Wilder, Jr. It first appeared in his seminal masterpiece, "New Concepts in Technical Trading Systems" (1978). He describes the system on pp.23-26, in the chapter discussing the first presentation ever of the "Volatility Index", built using a novel way of calculating a value representing volatility that he named...

Count:717
Name: SSL Hybrid Exit Arrow Strategy
Description: Basic concept: Use the SSL Hybrid indicator's EXIT ARROWS to determine trade entry and exit points. Rules: Enter LONG trades on BLUE exit arrows Enter SHORT trades on RED exit arrows Uses up to 3 DCA orders for trade entry Sets a stop loss Does not set any take profit. Relies on opposing arrow to exit current position When filters are set it affects...

Count:714
Name: Chandelier Exit - Strategy
Description: I created a strategy version for the Chandelier Exit indicator, originally owned by @everget . With the strategy I prepared, you can try both short-long and stop loss - trailing stop and take profit rates. I have also added a date filter feature so that you can test the strategy in the date range you want. Orjinali @everget 'e ait olan Chandelier Exit ...

Count:714
Name: [SMT] Buy & Sell Renko Based - Strategy
Description: This is a custom indicator that implements a trading strategy based on Renko charts, but they can be used on regular candlestick charts and on any time frame. Renko charts are known for filtering market noise and displaying price movements in a clearer way. However, it is important to note that this indicator is provided for educational and informational purposes...

Count:713
Name: KPL Swing Strategy
Description: The KPLSwing indicator is a simple trend following mechanical trading system which automates the entry and exit. The trading system is extremely simple and easy to use and removes emotions from trading. The trading or investing logic is simple.... buy on close above 20 days high and sell on close below 20 days low. No targets are given as profits are unknown...

Count:711
Name: Traling.SL.Target
Description: Trailing SL and Target I have seen few requests in PineScripters telegram group asking questions about implementation of trailing stop-loss (SL) and targets. This script is one of the way to implement the same. This script is developed based on dark color theme and is best viewed using dark color theme. How and where can this script be used: The script is built...

Count:709
Name: Squeeze Momentum on Reversal Strategy
Description: ** From the original work of LazyBear ** Thanks for his Squeeze Momentum indicator This strategy gives acceptable result on EUR/USD - 1H chart with default parameters

Count:709
Name: Volumetric Toolkit [LuxAlgo]
Description: The Volumetric Toolkit is a complete and comprehensive set of tools that display price action-related analysis methods from volume data. A total of 4 features are included within the toolkit. Symbols that do not include volume data will not be supported by the script. 🔶 USAGE The volumetric toolkit puts a heavy focus on price action, returning...

Count:707
Name: Nifty Volume profile + VWAP + EMA
Description: The script picks up nifty stocks with their current respective weights and plots a Volume Weighted Average Price line along with 2 EMAs and an alert when the EMAs cross over. You can customize the script for EMA lengths and to remove alert. Basic utility of the script is to analyse volumes driving the Nifty 50 index. Credits to @daytraderph and his script...

Count:706
Name: Range Breakout Signals (Intrabar) [LuxAlgo]
Description: The Range Breakout Signals (Intrabar) is a novel indicator highlighting trending/ranging intrabar candles and providing signals when the price breaks the extremities of a ranging intrabar candles. 🔶 USAGE The indicator highlights candles with trending intrabar prices, with uptrending candles being highlighted in green, and down-trending candles being...

Count:706
Name: 3 Candle Strike Stretegy
Description: Mainly developed for AMEX:SPY trading on 1 min chart. But feel free to try on other tickers. Basic idea of this strategy is to look for 3 candle reversal pattern within trending market structure. The 3 candle reversal pattern consist of 3 consecutive bullish or bearish candles, followed by an engulfing candle in the opposite direction. This pattern usually...


Count:703
Name: Double Supertrend
Description: This strategy is based on a custom indicator that was created based on the Supertrend indicator. At its core, there are always 2 super trend indicators with different factors to reduce market noise (false signals). The strategy/indicator has some parameters to improve the signals and filters. TECHNICAL ANALYSIS ☑ Show Indicators This option will...

Count:702
Name: Forex Master (EUR/USD)
Description: ATTENTION: This is a symmetrical algorithm designed only for trading EUR/USD on the 1h time frame. For other currency pairs and time frames, you need to re-calibrate the RSI-EMAs as well as the profit targets and stop losses. BACKTEST CONDITIONS: Initial equity = $100,000 (no leverage) Order size = 100% of equity Pyramiding = disabled TRADING RULES: Long...

Count:702
Name: TSI CCI Hull
Description: This Strategy is Using TSI and CCI and Hull Moving Average to make swing trades on 1H chart but can be used on any pair and timeframe just change settings to suit (Hull Period mostly)

Count:699
Name: REAL STRATEGY : Dow_Factor_MFI/RSI_DVOG_Strategy
Description: I'm actually one of those who think it's more important to extract clues from indicators than strategy, but I wanted to test the data about the probability and dow factor I've shared for a long time. Usually, Bitcoin is used as an eye stain for strategy success, since the graph has increased significantly from the beginning. To prevent this, I used a commission...

Count:699
Name: Davin's 10/200MA Pullback on SPY Strategy v2.0
Description: Strategy: Using 10 and 200 Simple moving averages, we capitalize on price pullbacks on a general uptrend to scalp 1 - 5% rebounds. 200 MA is used as a general indicator for bullish sentiment, 10 MA is used to identify pullbacks in the short term for buy entries. An optional bonus: market crash of 20% from 52 days high is regarded as a buy the dip signal. An...

Count:698
Name: Strategy MACD vs BB
Description: Strategy based on MACD and Bollinger Bands, where BBs are calculatend from macd signal. Strategy doesn't open at breakout of bands but it waits for a pullback. Upper and lower bands are used as resistance and support. There are various parameters that can be optimized. I have also a study with alerts. Please use comment section for any feedback or cointact me...

Count:698
Name: EASYMOKU INDICATOR
Description: This is the popular Ichimoku Indicator with an easier way to adjust the settings that can help you in your trading. Components of the Ichimoku indicator: Tenkan Sen: Basically it is a moving average that goes from 7 to 9 periods. Kijun Sen: Like Tenkan Sen, we are facing a moving average, but this time from 22 to 26 periods. Chikou Span: It is the one...

Count:697
Name: SRP Strategy [ ZCrypto ]
Description: Hello, I've been utilizing this DCA approach in my trading strategy for a while now, and I believe it's time to share it with the community. The VWMA Bands and RMF DCA Strategy is a powerful trading approach that combines the concepts of Volume Weighted Moving Average (VWMA) bands and the Relative Momentum Factor (RMF). This strategy employs Dollar Cost...

Count:697
Name: SuperTrend Cloud Strategy
Description: Experimental strategy to improve accuracy of SuperTrend Cloud. I am attempting to use STD deviation to manipulate the multiplier of the SuperTrend cloud. Greater STD Deviation = Oscillation in price action which can be applied to multiplier of SuperTrend to filter out bad trades and improve accuracy.

Count:695
Name: EMA RSI ATR Hidden Div Strat - 1 Min
Description: Hey there! Hereby I present you the EMA RSI Lowest Low Hidden Divergence strategy, which I discovered on a youtube channel. He has tested the strategy hundreds of times manually, herewith I try to automate the whole thing. Since I use the strategy with a bot, it can only enter long positions for now. But in the future I will add the possibility to trade short...

Count:693
Name: Camarilla Strategy - breakouts of H4 and L4
Description: Breakout strategy of H4 and L4 levels. Manual entries and exits - higher profits BUT because I am a novice in pinescript, Can someone please: 1. Show me how to add exit strategy lines : close> ema(close,3) for exit short and opposite for long. I added myself but I can't make it to work in relation to camarilla entries; instead it shows all ema crossings.. 2.Why...

Count:693
Name: Pivot Reversal Strategy + alerts via TradingConnector to indices
Description: Software part of algotrading is simpler than you think. TradingView is a great place to do this actually. To present it, I'm publishing each of the default strategies you can find in Pinescript editor's "built-in" list with slight modification - I'm only adding 2 lines of code, which will trigger alerts, ready to be forwarded to your broker via TradingConnector...

Count:691
Name: MACD_RSI strategy
Description: Use three indicator to entry a position EMA (20), MACD (12, 26, 20), RSI (14) apply ema20 on rsi as signal line Entry long when price above EMA20, MACD above signal line and RSI above signal line Entry short when price below EMA20, MACD below signal line and RSI below signal line Study only, use it under your own risk.

Count:690
Name: Grover Llorens Activator Strategy Analysis
Description: The Grover Llorens Activator is a trailing stop indicator deeply inspired by the parabolic SAR indicator, and aim to provide early exit points and reversal detection. The indicator was posted not so long ago, you can find it here : Today a strategy using the indicator is proposed, and its profitability is analyzed on 3 different markets with the main time frame...

Count:689
Name: Сalculation a position size based on risk
Description: This is an example how to calculate position size based on risk and stop loss for educational purpose .

Count:687
Name: Follow the Trend - Trade Pullbacks
Description: Kindly follow the rules stated below for entry, exit and stop loss. Not every Buy / Sell signal will be profitable. Timeframe of the chart acts as current timeframe. You need to choose 2 more as middle and higher timeframes. This indicator is based on candlesticks, ATR and CCI indicators and the logic provides buy / sell signals at the pullbacks of the trend...

Count:687
Name: Price Action + Bollinger Strategy
Description: Simple Price Action + Bollinger Band Strategy Buy Setup -------- - Price closes below Bollinger Band - Last candle closes in green, confirming bulls have returned - Buy trade is taken Short Setup -------- - Price closes above Bollinger Band - Last candle closes in red , confirming bears have returned - Short trade is taken Strategy open for suggestions and updation

Count:686
Name: Optimized RSI Strategy - Buy The Dips (by Coinrule)
Description: Buy low and sell high is every trader's mantra. While this approach looks straightforward in theory, it's sometimes challenging to put into practice. That requires stress-management to buy when price drops and resolution in selling when the price is rising. RSI is a useful tool to implement long-term and effective trading strategies. The script presents an...
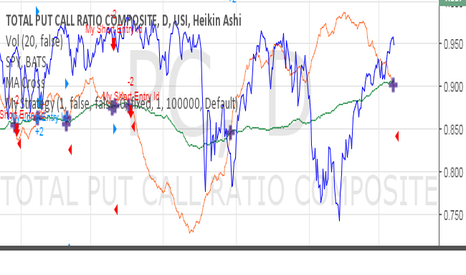
Count:686
Name: Put/call ratio cross - buy and sell SPY
Description: When 50DMA and 200DMA cross on PC, algo trades SPY accordingly

Count:684
Name: NVT Signal with RMA and Thresholds (Strategy / Backtest)
Description: This is the strategy w/ backtester and trailing-stop / stop-loss for kishin's NVT alerts

Count:683
Name: Previous Day High and Low Breakout Strategy
Description: Previous Day High and Low Breakout Strategy

Count:683
Name: Twin Range Filter Algo
Description: @Colinmck used two different ranges to generate signals. Read his release notes to find out what the original script does. I added one condition which seems to increase performance on 15m BTCUSD as well as 1h BTCUSD and that is ATR with 32 periods being smaller than ATR with 64 periods. I used my script Volatility Optimiser to discover this tendency. Both...

Count:682
Name: Crypto Squeeze Strategy
Description: This strategy was inspired by two famous Trading View contributors. Shout out to Lazy Bear and Crypto Face! The strategy includes a similar replication of the blue wave, and MFI indicator. The point of the strategy is to buy when the blue wave crosses up the zero value, and the MFI is greater than zero value. This indicates that there is strong bullish momentum...

Count:682
Name: GetTrend Strategy (modified & ported to PS4)
Description: This is a port to PS4 of an amazingly simple solution that may have good prospects as a standalone indicator, an add-on or an integral part of a trading system. Many thanks to its authors and contributors.

Count:680
Name: GetTrendStrategy 370 30 min
Description: Modificación de la estrategia “GetTrendStrategy” optimizada para Bitcoin.

Count:678
Name: Trend Following Breakout
Description: Easy Trend Following Strategy using Highs and Lows breakout of the last X candles to enter and exit trades. You can easily change the ENTRY and EXIT value in order to find the best settings. This strategy seems to be working well for $BTC and $ETH on the 4H and 1D. I didn't play with it too much as I am testing script to trade on the 15 minutes chart with...

Count:678
Name: Market Structure [TFO]
Description: The purpose of this indicator is to provide a simple approach to Market Structure. When price is closing over swing highs, we may categorize that as bullish structure; and when price is closing below swing lows, we may categorize that as bearish structure. We can easily find swing highs and lows via the following built-in Pine Script functions: ...

Count:677
Name: Renko Strategy T3 V1
Description: An interesting strategy using Renko calculations and Tilson T3 on normal charts targeted for cryptocurrencies but can work with different assets. Tested on Daily but can work with lower frames using Renko Size and T3 Length adjustments. == Description == Strategy get Renko close/open/high/low values and smooth them with T3 Tilson. Base on these results the...

Count:675
Name: RSI of VWAP
Description: This strategy inputs the vwap as source to RSI indicator. ENTRY When RSIofVwap crossover 70 and price is above ema200 partial exits when RSIofVwap reaches 90 level take a portion of profit Exit When RSIofVwap crossdown 30 stoploss defaulated to 5% Risk Level Defaulted to 10%. Based on this startegy calcuclates hiw many units can be purchased...

Count:671
Name: Elliott strategy
Description: It uses Elliott teory to shift two moving averages 8 positions (based on 5-3 fractal), and the crossing is close to reversions. And it keeps an eye on RSI level to be sure it is on hot level to sell/buy

Count:668
Name: Boom Hunter + Hull Suite + Volatility Oscillator Strategy
Description: TRADE CONDITIONS Long entry: Boom Hunter (leading indicator): Trigger line crosses over Quotient 2 line (white cross over red) Hull Suite (trend confirmation): Price closed above hull suite line and hull suite is green (represented by horizontal line at -10 in strategy pane) Volatility Oscillator (volatility confirmation): Volatility spike trigger line...

Count:668
Name: Ichimoku Backtester with TP, SL, and Cloud Confirmation Option
Description: Started with the Basic Ichimoku strategy from Mizuki32. Added Take Profit, Stop Loss (for both long and short), and a toggle to wait for confirmation from the cloud.

Count:667
Name: [STRATEGY][RS]MA Strategy test V0
Description: EXPERIMENTAL:Testing the strategy tester :D

Count:666
Name: Automated Bitcoin (BTC) Investment Strategy from Wunderbit
Description: Automated Bitcoin (BTC) Investment Strategy from Wunderbit Trading This strategy is designed for the automated long-term investment in Bitcoin. The BTC investment strategy is primarily suitable for long-term investors who want to increase the percentage of their investments through timely trading long-term transactions. The main feature is the difference from the...

Count:665
Name: All in One Strategy
Description: True improvement over my previous script. This script adds in all of the complementary indicators, makes it truly easy to adjust the inputs, and has produced a real world net gain using the TradingView bots paired with any broker's API that is supported. It has a selection for which strategy you'd like to use and due to limitations in Pine I cannot program in...

Count:664
Name: MACD EMA - TradingRush Strategy
Description: Hey there! Today I present you a rather simple, but very profitable MACD strategy. Since I trade it with cryptocurrencies, the settings have been adjusted. I discovered the strategy on a YouTube channel and tried to transfer it as a strategy into a script. Tested with the crypto pair ETH/USDT in the 15 minute chart. There is the possibility to switch between...

Count:662
Name: PercentX Trend Follower [Trendoscope]
Description: "Trendoscope" was born from our trading journey, where we first delved into the world of trend-following methods. Over time, we discovered the captivating allure of pattern analysis and the exciting challenges it presented, drawing us into exploring new horizons. However, our dedication to trend-following methodologies remains steadfast and continues to be an...

Count:662
Name: FX Sniper: T3-CCI Strategy Backtest
Description: This simple indicator gives you a lot of useful information - when to enter, when to exit and how to reduce risks by entering a trade on a double confirmed signal. You can use in the xPrice any series: Open, High, Low, Close, HL2, HLC3, OHLC4 and ect... You can change long to short in the Input Settings Please, use it only for learning or paper trading. Do...

Count:661
Name: RSI W Pattern strategy
Description: This strategy is similar to RSI V pattern strategy, but it looks for W pattern in RSI chart. RULES ====== BUY 1. ema20 is above ema50 2. RSI5 crossing up 30 from oversold area 3. and RSI5 must be below overbought area (default value set to 65) Add to existing Position 1. You can add on the next W pattern OR 2. if RSI5 is crossing up from below 20 Exit 1....

Count:661
Name: TSI HMA CCI
Description: Hi! This strategy has TSI and CCI indicators with the CCI being based on a HMA instead of the Price. There is a number of conditions that must combine to create buy or sell signals, but it is basically a couple of MA crossovers. The strategy opens new orders on each candle if the conditions are met, Either direction, so it is hedging. It wont open new orders if...

Count:659
Name: OBV Pyr
Description: the pyramide strategy based on coinrule script the strategy is based on OBV scalper that i publish in past seems very proftible for btc but the question is if this is because it bullish now if i remove the filter then it will lose but the filter make it very profitable wish all members best new year this script work best for 1-5 min chart

Count:659
Name: RMI Trend Sniper
Description: The "RMI Trend Sniper" is a powerful trend-following indicator designed to help traders identify potential buy and sell signals in the market. It combines elements of the Relative Strength Index (RSI) and the Money Flow Index (MFI) to provide a comprehensive view of market momentum and strength. 🔷 Key Features: 🔹 Customizable Settings : Tailor the indicator to...

Count:657
Name: Ichimoku Keltner Strategy
Description: Integrated Keltner Channels and Ichimoku Clouds

Count:657
Name: [RichG] Easy MTF Strategy
Description: As we all know, timeframe agreement is a powerful tool. This strategy uses 4 time frames and the Keltner ATR for entries and exits.

Count:656
Name: Bollinger Stop Strategy
Description: Classic trading strategy using the Bollinger Bands indicator. Strategy Only stop orders are used to enter and exit the market. If the price crossed the upper boundary of the Bollinger Bands, then enter into a long position (and close a short position). If the price crosses the bottom of the Bollinger Bands, then enter short (and close a long position). Short...

Count:654
Name: HTF High/Low Repaint Strategy
Description: Here is an another attempt to demonstrate repainting and how to avoid them. It happened few times to me that I develop a strategy which is giving immense returns - only to realize after few forward testing that it is repainting. Sometimes, it is well disguised even during forward testing. In this simple strategy, conditions are as below: Buy : When a 3M bar...

Count:651
Name: Noro's MA+ATR Strategy
Description: SMA = simple moving average ATR = average true range If low more than SMA+ATR is uptrend If high less than SMA-ATR is downtrend (red)

Count:651
Name: Só Trade Top - Média de 8 - Augusto Backes
Description: This strategy is an ADAPTATION of the EMA8 Setup from Augusto Backes (brazilian crypto youtuber). The strategy was designed to work on the daily timeframe with the weekly EMA8. Buy signals when there is a bullish candle above the weekly EMA8 - bullish candles in the script: engulfing candles, closing price reversal and bullish hammer. Exit signals when there is...

Count:649
Name: Yesterday’s High Breakout - Trend Following Strategy
Description: Yesterday’s High Breakout it is a trading system based on the analysis of yesterday's highs, it works in trend-following mode therefore it opens a long position at the breakout of yesterday's highs even if they occur several times in one day. There are several methods for exiting a trade, each with its own unique strategy. The first method involves setting...

Count:648
Name: Super 8 - 30M BTC
Description: Welcome to Super 8, the ultimate automatic trading script for Pine! This bad boy is designed to go both long and short, and it's equipped with all the tools you need to maximize your profits. Whether you're looking to take profit, set a trailing stop, or protect yourself with a stop loss, Super 8 has you covered. But that's not all! Super 8 is also loaded...

Count:648
Name: Linear Regression Pearson's R - Trend Channel Strategy
Description: This script takes advantage of the Pearson's R attribute of the data set you provide. Pearson's R attempts to find how correlated data is with a potential pattern. If the number is negative the correlation is upwards . If it's positive the correlation is downwards . Pearson's R can only be a number between -1 and 1. It should be impossible to ever...

Count:647
Name: Babypips: Inside Bar Momentum Strategy
Description: The strategy contained in this post comes courtesy of babypips (.com), an excellent resource for all thing forex related. If you are new to trading, the site is definitely worth checking out! Code commentary and an introduction to Inside Bars are available for this post on the Backtest-Rookies (.com) website. Note: If you are interested in custom development...

Count:645
Name: BotBot
Description: My version of ChopBot with a little of Gen Opt. Seems to be good for direction spotting during sideways and uptrend. Works only on 4h HA candles.

Count:645
Name: Master Supertrend Strategy [Trendoscope]
Description: Here is the strategy version of the indicator - Master Supertrend Options and variations are same throughout. 🎲 Variations Following variations are provided in the form of settings. 🎯 Range Type Instead of ATR, different types of ranges can be used for stop calculation. Here is the complete list used in the script. Plus/Minus Range* - Calculates plus...

Count:642
Name: Momentum Strategy (BTC/USDT; 1h) - MACD (with source code)
Description: Good morning traders. It's been a while from my last publication of a strategy and today I want to share with you this small piece of script that showed quite interesting result across bitcoin and other altcoins. The macd indicator is an indicator built on the difference between a fast moving average and a slow moving average: this difference is generally...

Count:642
Name: The Lazy Trader - Index (ETF) Trend Following Robot
Description: 50/150 moving average, index (ETF) trend following robot. Coded for people who cannot psychologically handle dollar-cost-averaging through bear markets and extreme drawdowns (although DCA can produce better results eventually), this robot helps you to avoid bear markets. Be a fair-weathered friend of Mr Market, and only take up his offer when the sun is shining!...

Count:637
Name: Bollinger Bands - Breakout Strategy
Description: The Bollinger Bands - Breakout Strategy is a trend-following optimized for short-term trading in the crypto market. This strategy employs the Bollinger Bands, a widely recognized technical indicator, as its primary instrument for pinpointing potential trades. It is capable of executing both long and short positions, depending on whether the market is in a spot or...

Count:637
Name: Strategy Template[Benson]
Description: A strategy template with following user inputs: 1. backtest start date 2. tp% and stop loss% 3. trail stop price and trail stop offset The long and short condition is ma crossover and corssunder by default. You can change the logic with your own.

Count:636
Name: Strategy Code Example 2 - Time Limiting
Description: *** THIS IS JUST AN EXAMPLE OF STRATEGY TIME LIMITING CODE IMPLEMENTATION *** This is a follow up to my example for risk management implementation here: Code remains mostly unchanged, but now includes a time limiting implementation. Relevant code blocks for the time factor are preceded with a comment stating: *** FOCUS OF EXAMPLE *** Cheers!

Count:636
Name: Senkou Span Cross Strategy [Krypt]
Description: A simple trading strategy oriented towards cryptocurrencies that uses log-space Ichimoku clouds Long position: when Senkou Span A crosses over Senkou Span B Short position: when Senkou Span A crosses under Senkou Span B The indicator used in this strategy is available as a standalone script:
Count:636
Name: Kozlod - 3MA strategy with SL/PT (7 MA types)
Description: Classic 3 MA strategy. Long - Short MA crossover Medium MA and cross is above Long MA Short - Short MA crossunder Medium MA and cross is below Long MA You can choose one of these MA types in params: Simple Moving Average ( SMA ) Exponential Moving Average ( EMA ) Weighted Moving Average ( WMA ) Hull Moving Average ( HMA ) Volume-weighted Moving...

Count:635
Name: Sniper & Strategy
Description: SniperTrading permite detectar los momentos exactos de compra y venta obteniendo un buen rendimiento. Como aplicarlo: * Realice una compra cuando el indicador de COMPRA aparezca en la pantalla. * Realice una venta cuando el indicador de VENTA aparezca en la pantalla.

Count:634
Name: M-SQUEEZE
Description: Script for Swing Trading. It use the following indicators: - SQUEEZE MOMENTUM INDICATOR (LAZYBEAR) - RSI VOLUME WEIGHTED (LAZYBEAR) - PARABOLIC SAR Settings for OANDA:SPX500USD at 2H

Count:634
Name: QuantNomad - Pivot Reversal Strategy - XBTUSD - 1h
Description: Pivot reversal strategy almost always works pretty good for crypto. Here is setup with 4 left, 4 right bars for pivot points for XBTUSD 1h chart. It shows a pretty nice performance of 350% with only 10% dd, Sharpe is 1.16. If you're interested in using this strategy in my scripts you can find alerts for it and a version with added backtesting range. And...

Count:633
Name: MA Candles Supertrend Strategy
Description: Simple strategy which is derived by below method: 1. Calculate moving average of High, Low, Open and Close and make candles of them. 2. Derive supertrend on the moving average candles. 3. Generate buy and sell signals based on supertrend direction combined with higher timeframe high-low condition

Count:633
Name: Powerfull strategy MACD+RSI+STOCH ATR stop best on Crude Oil
Description: My strategy uses a combination of three indicators MACD Stochastic RSI . The Idea is to buy when ( MACD > Signal and RSI > 50 and Stochastic > 50) occures at the same time the BUY STop we place on previous day HIGH and sell (short) when the opposite condition occurs we place SELL STOP on previous day LOW We exit on Take profit or Stop loss which is calculated...

Count:630
Name: MACD Multi-MA Strategy
Description: This script applies the average of each major MA (SMA, RMA, EMA, WVMA, WMA) to the MACD formula. The logic is simple. When all 5 MA's are in agreement in direction, then then script will notify users of change. I posted this as a strategy to help show how logic does in back test. If you use my simple yet effective solution to find take profit locations, you can...

Count:629
Name: VWMA with kNN Machine Learning: MFI/ADX
Description: This is an experimental strategy that uses a Volume-weighted MA (VWMA) crossing together with Machine Learning kNN filter that uses ADX and MFI to predict, whether the signal is useful. k-nearest neighbours (kNN) is one of the simplest Machine Learning classification algorithms: it puts input parameters in a multidimensional space, and then when a new set of...

Count:629
Name: Take profit Multi timeframe
Description: Republish: Take profit Multi timeframe: In this scipts, I build risk-reward system managemant. You can take profit in two way: percent or at resistant in higher timeframe or both. Strategy in this scripts, I use Wave trend indicator as example strategy.

Count:628
Name: FXFUNDINGMATE TREND INDICATOR
Description: A simple trend continuation strategy based on Ichimoku, moving average, Stochastic and MACD

Count:628
Name: Combo Backtest 123 Reversal & High and Low Levels
Description: This is combo strategies for get a cumulative signal. First strategy This System was created from the Book "How I Tripled My Money In The Futures Market" by Ulf Jensen, Page 183. This is reverse type of strategies. The strategy buys at market, if close price is higher than the previous close during 2 days and the meaning of 9-days Stochastic Slow...

Count:627
Name: Profit Maximizer PMax Strategy - Long-Short
Description: I developed a different strategy perspective for the Profit Maximizer PMax indicator prepared by Kıvanç Özbilgiç. When you come to the settings section; - You will see 2 options as Straregy Type. You can test the price and pmax intersections as different strategies. - I added the Long-Short option for spot traders to calculate the profitability rate correctly....

Count:626
Name: VWAP and RSI strategy
Description: This strategy combines VWAP and RSI indicators BUY RULE 1. EMA50 > EMA 200 2. if current close > vwap session value and close>open 3. check if RSI3 is dipped below 10 for any of last 10 candles (as defined rsi_buy_level) EXIT RULE 1. RSI3 crossing down 90 level (as defined in rsi_sell_level) STOP LOSS EXIT 1. default is set to 5% you need to add EMA...

Count:625
Name: Range Strat - MACD/RSI
Description: This strategy uses a trend based indicator (MACD) for entry/exit signals with a momentum oscillator (RSI) to act as confirmation. Although relying on a trend based indicator this has been created for range bound crypto markets, which have been in a period of chop since June 2022. Long/Short signals are generated from MACD with the RSI oscillator thresholds...

Count:624
Name: On Balance Volume Oscillator Strategy [QuantNomad]
Description: Looking for the way to use OBV Oscillator in a strategy. Here is my first try. I just enter to position of a cross of 2 emas based on OBV. Here is my original oscillator indicator:

Count:624
Name: Amazing scalper for majors with risk management
Description: Hello, Today I am glad to bring you an amazing simple and efficient scalper strategy. Best suited for 1M time frame and majors currency pairs. Its made of : Ema (exponential moving average) , long period 25 Ema(exponential moving average) Predictive, long period 50, Ema(exponential moving average) Predictive, long period 100 Risk management , risking % of...

Count:623
Name: KAMA Strategy - Kaufman's Adaptive Moving Average
Description: This strategy combines Kaufman's Adaptive Moving Average for entry with optional KAMA, PSAR, and Trailing ATR stops for exits. Kaufman's Adaptive Moving Average is, in my opinion, a gem among the plethora of indicators. It is underrated considering it offers a solution that intuitively makes a lot of sense. When I first read about it, it was a real 'aha!'...

Count:623
Name: Top 40 High Low Strategy for SPY, 5min
Description: This strategy is developed based on my High Low Index SPY Top 40 indicator Notes: - this strategy is only developed for SPY on the 5 min chart . It seems to work with QQQ as well, but it isn't optimized for it - P/L shown is based on 10 SPY option contracts, call or put, with strike price closest to the entry SPY price and expiry of 0 to 1 day. This...

Count:623
Name: Heikin Ashi + Price Action Crypto LONG Strategy
Description: This is a simple and efficient crypto strategy, designed for big timeframes like 12/24h. On history it beats buy and hold strategy in many ocasions, and because of a low DD, pyramid can be used to elevate our winnings while still keeping a low DD < 40% avg. For the purpose of this example, I used 100% of the capital on each trades, together with a comission of...

Count:622
Name: Candle Patterns Strategy
Description: The script allows you to test popular candlestick patterns on various instruments and timeframes. In addition, you can configure risk management (if the value is zero, it means the function is disabled), and you can also specify the time of the trading session (for example, so that the positions are not transferred to the next day). The author is grateful to...

Count:621
Name: Breakout Scalper
Description: first draft of a breakout scalper which uses a fast and slow window sets up some entry stops and then a trailing exit stop. performs a manual close when going sideways.

Count:620
Name: Scalping The Bull - Two EMA Strategy
Description: Name: Scalping The Bull - Two EMA "Gianno-Nano" Strategy from the Meeting Category: Trend Follower Operating mode: Spot or Future, only long or swing trading Trades duration: Multiday Timeframe: 4H Suggested usage: Mid-term trading, when the market is in trend and it is showing high volatility. Entry: When fast EMA crosses over slow...

Count:619
Name: Crypto momentum strategy
Description: This strategy is based on LazyBear's Squeeze Momentum indicator. It analyzes when the trend in the momentum is shifting, locating the peaks and the valleys, and takes those as sell and buy signals respectively. This is a long strategy, so it also takes into consideration the 50 period Exponential Moving Average to identify upward trends. If the closing price of...

Count:614
Name: Channel Break [for free bot]
Description: I present to you a script for testing the channel breakout strategy for the Bitmex exchange. Cryptocurrency itself is a trending tool, which is why breakout strategies generate the largest profits, and the channel breakout strategy is one of the most effective trend strategies. The optimization result shows the result of trading on a volume of 20% of the deposit....

Count:614
Name: AlphaTrend Strategy
Description: I turned the Alpha Trend indicator coded by our teacher Kıvanç Özbilgiç into a strategy. You can find the original version of the indicator here. It sends trading signals in the regions where AlphaTrend produces Buy and Sell signals. It is a two-way strategy. Buy Entry Long opens trade, Sell Entry Short opens trade.

Count:613
Name: RSI Strategy with alerts via TradingConnector to Forex
Description: Software part of algotrading is simpler than you think. TradingView is a great place to do this actually. To present it, I'm publishing each of the default strategies you can find in Pinescript editor's "built-in" list with slight modification - I'm only adding 2 lines of code, which will trigger alerts, ready to be forwarded to your broker via TradingConnector...

Count:611
Name: High/Low Channel Multi averages Crypto Swing strategy
Description: This is a swing strategy designed for trending markets such as crypto and stock, with big timeframes , like 8h. For this strategy we take SMA, EMA, VWMA, ALMA, SMMA, LSMA and VWMA and make an apply them all to both HIGH and LOW separately and make 2 averages, 1 applied to high and the other applied to low. With them we make a channel. Rules for entry For long:...

Count:610
Name: ADX | DMI Trend Strategy
Description: This strategy takes the ADX Indicator I wrote and applies it to a strategy for back testing purposes. I've also applied a date filter so you can back test specific date ranges and a moving average filter so you can choose whether to filter your longs/shorts based on a moving average.

Count:610
Name: Liquidation Levels [LuxAlgo]
Description: The Liquidation Levels indicator aims at detecting and estimating potential price levels where large liquidation events may occur. By analyzing liquidation Levels, traders can identify potential support & resistance levels, identify stop-loss levels, and gauge market sentiment and potential areas of price volatility. 🔶 USAGE Liquidation refers to the...

Count:608
Name: MACandles-LinearRegression-Strategy
Description: This is combination of multiple indicators and strategies. Mainly useful for indexes and to time the entry and exits of indexes. No stoploss used - makes it less desirable for leveraged trades or trading individual stocks. Let us rewind and look back at some of the indicators/strategies published earlier. 1. Moving Average Candles - this is one of my favourite...

Count:608
Name: ATR, Kijun-Sen, %R Strategy [No Nonsense FX]
Description: A strategy that employs the No Nonsense FX method as described by VP. 1. Risk: ATR 2. Baseline: Kijun-Sen 3. Confirmation #1: Williams % Range 4. Volume: TBD 5. Confirmation #2: TBD 6. Exit: TBD Give me a follow if you enjoy and please PM me for more info/collabs! Notes: The defaults seem to work...

Count:605
Name: Moving Stop-Loss mechanism + alerts to MT4/MT5
Description: "How to code moving stop-loss mechanism", is one of the most often repeating questions in private messages I receive, so just to focus on this mechanism, I made a spin-off from my previous script: TradingView-Alerts-to-MT4-MT5-dynamic-variables-NON-REPAINTING . The logic here moves the stop-loss each time a trade is running and a new pivot high/low is detected....

Count:605
Name: Doji strategy
Description: This is a simple strategy based on Doji star candlestick. It places two orders: buy stop at doji star high or previous candle high and sell stop at doji star low or previous candle low. Exit rules are with take profit and fixed stop loss or take profit and stop loss at doji min or max. This strategy works very well with high time frames like Daily and Weekly...

Count:605
Name: Stratergy CM_Ultimate_MA_MTF
Description: This is the script for the idea published by @ChrisMoody Below is the link to the idea () Try the scripts for longer periods (e.g. 1 D). The script still requires some tweaks as one of the issue is that the shorts and puts are being placed 2 candles after a confirmation is there. So use this strategy at your own risk. Any inputs will really be helpful. (Also...

Count:604
Name: EMA Crossover Strategy
Description: EMA Crossover Strategy This strategy will enter a long trade when the 21 EMA crosses over the 55 EMA and both EMAs and the close price are above the 200 EMA (long-term trend). It will enter a short trade when the 21 EMA crosses under the 55 EMA and both EMAs and the close price are below the 200 EMA. It will exit a long trade when the RSI crosses under from...

Count:603
Name: MOST Multi MAs
Description: MOST provides a useful platform to compare the performance of moving averages and/or determine optimum moving average with its parameters to a different markets. Now it has many different moving averages. As a fun, you can compete your favorite moving average with others! This indicator is free to use, and the code is visible and with mostly turkish syntactic...

Count:602
Name: Multi Supertrend with no-repaint HTF option strategy
Description: This is the strategy version of the multi supertrend indicator. The RoMDD looks good :) Checked in ETHUSDT 1hour with auto HTF ON. Have a look :)

Count:602
Name: Pro Trading Art Open Range Breakout Strategy
Description: This strategy is based on Selected Candle High Low Breakout with buffer point. You can select specific candle from input tab by giving time of that candle. Default Settings: Start Hour : Hour of starting candle means from this input you can specify opening candle. Default is 9. Start Minute: Minute of starting candle. Default is 15. Means Default opening...

Count:601
Name: Noro's Donchian Strategy
Description: The strategy uses Donchian price channel . The channel is shown in blue lines. All other lines use Donchian channel too. The red line is the center line between the channel lines. The lime line is a few percent further away. The percentage is set by the user in the strategy settings. Lines Blue line - to open position using market stop order Lime line -...

Count:599
Name: Gunbot - Bbands - Unlocked
Description: This is a repost, the first version was locked and I am unable to unlock it. So I'm simply publishing it anew. Original Post Original Description This is more of a test run than anything. Gunbot approximation courtesy of Vosechu and the original can be found here.

Count:598
Name: RSI Divergence X Ichimoku Cloud X 200EMA
Description: Hi all, This script is a combination of the RSI Divergence Strategy combined with Ichimoku Cloud and 200 EMA . A long position is entered only when the RSI identifies a bullish divergence (either regular or hidden), and that the Ichimoku Cloud is above the 200 EMA . This is to ensure that there is a confirmation of a bullish trend before an entry. Similarly, a...

Count:596
Name: Bull and Bear Fear Expert by Walter Downs Strategy
Description: Bull and Bear Fear Expert by Walter Downs Strategy

Count:593
Name: Hull Moving Average vs Candle
Description: A Hull moving average is applied to the chart with settings for user to change the period of the Hull MA. And a value of a previous candle is compared to the HMA. If the HMA is above the previous candle value, then the strategy will buy. If below, it will sell. The default setting for the HMA is 50 and the Candle is D1 (Daily timeframe) So basically if the HMA...

Count:593
Name: Noro's Fast RSI Strategy v2.0
Description: The doubled Noro's Fast RSI Strategy v1.7

Count:592
Name: Momentum BF
Description: The momentum strategy is simple, if price action is higher than it was for x bars back, and also higher than it was last candle, we have upwards momentum. This momentum will be positive until a candle closes lower than the previous candle and also lower than x bars back - at which point we have downwards momentum. The concept behind the Momentum Strategy is that...

Count:592
Name: ATR GOD Strategy by TradeSmart (PineConnector-compatible)
Description: This is a highly-customizable trading strategy made by TradeSmart, focusing mainly on ATR-based indicators and filters. The strategy is mainly intended for trading forex , and has been optimized using the Deep Backtest feature on the 2018.01.01 - 2023.06.01 interval on the EUR/USD (FXCM) 15M chart, with a Slippage value of 3, and a Commission set to 0.00004 USD...

Count:590
Name: Function Polynomial Regression Strategy
Description: To be clear I'm using the code from Richard Santos for the functional polynomial regression. I really loved his script idea (given that I'm into linear regression myself). I took his code and made a strategy which applies to bitcoin on the 5 minute chart (but you could adjust this for any asset), and you could make this work on anytime frame by adjusting the...

Count:590
Name: Customizable Non-Repainting HTF MACD MFI Scalper Bot Strategy v2
Description: Customizable Non-Repainting HTF MACD MFI Scalper Bot Strategy v2 This script was originally shared by Wunderbit as a free open source script for the community to work with. This is my second published iteration of this idea. WHAT THIS SCRIPT DOES: It is intended for use on an algorithmic bot trading platform but can be used for scalping and manual...

Count:587
Name: PlanB Quant Investing 101 v2
Description: This script has been Inspired by PlanB Article Quant Investing 101. With this script, I implemented Plan B strategy outlined in that article, trying to reproduce his findings independently and allowing TradeView Users to do the same. PlabB is aware of this effort, and he's positive about it, via Twitter commenting, liking and sharing of this resource . Trading...

Count:587
Name: Hull MA and Candle cross
Description: Hull MA vs price cossover . not 2 Hull MA's crossing, and also a price vs previous price crossover : current price higher than previous = buy current price lower than previous = sell Price value set to OPEN to avoid repaint during candle

Count:585
Name: TTM scalper indicator Backtest
Description: TTM scalper indicator of John Carter’s Scalper Buys and Sells. The methodology is a close approximation of the one described in his book Mastering the Trade. The book is highly recommended. Note the squares are not real-time but will show up once the third bar has confirmed a reversal. You can change long to short in the Input Settings WARNING: - For...

Count:585
Name: Scalping Dips On Trend (by Coinrule)
Description: Coinrule's Community is an excellent source of inspiration for our trading strategies. In these months of Bull Market, our traders opted mostly on buy-the-dips strategies, which resulted in great returns recently. But there has been an element that turned out to be the cause for deep division among the Community. Is it advisable or not to use a stop-loss...

Count:584
Name: Buy Tuesday Strategy (by ChartArt)
Description: This strategy is as simple as possible: Every Tuesday a new long trade is opened, when Monday (yesterday) closed higher than it opened the week. The strategy closes all orders when the next close is larger than the open. This strategy does not have any other stop loss or take profit money management logic and is therefore VERY risky, because it always waits to...

Count:583
Name: Gann Swing Oscillator
Description: The Gann Swing Oscillator has been adapted from Robert Krausz's book, "A W.D. Gann Treasure Discovered". The Gann Swing Oscillator helps define market swings. You can change long to short in the Input Settings Please, use it only for learning or paper trading. Do not for real trading.

Count:582
Name: EMA_cumulativeVolume_crossover[Strategy V2]
Description: This is variation of EMA_cumulativeVolume_crossover strategy. instead of cumulative volume crossover, I have added the EMA to cumulative volume of same EMA length. when EMA crossover EMACumulativeVolume , BUY when already in LONG position and price crossing over EMACumulativeVolume*2 (orange line in the chart) , Add more Partial Exit , when RSI 5 ...

Count:581
Name: EMA Cross + Divergence strategy (Div. signals by The Divergent)
Description: A sample strategy demonstrating the usage of The Divergent divergence indicator and The Divergent Library . The Divergent is an advanced divergence indicator which you can easily incorporate into your own strategies. In order to use this strategy (and to use the signals in your own strategy), you need to have the Pro version of The Divergent applied to...

Count:580
Name: Harmonic System Strategy
Description: Harmonic System Strategy Buy=crossover(X1,X2) Sell=crossunder(X3,X4)


Count:576
Name: MA Emperor insiliconot Strategy
Description: Converted EmperorBTC's EMA crossover indicator for easy backtesting and added ability to: Specify time period for backtesting Specify order quantity Toggle original indicators (default off) Quoting EmperorBTC: Entry is to be made when the 1. Cross over gives a P(Positive Sign) and the candle completely closes above the cross-over 2. When the Heikin...


Count:575
Name: Combo Backtest 123 Reversal & Stochastic Crossover
Description: This is combo strategies for get a cumulative signal. First strategy This System was created from the Book "How I Tripled My Money In The Futures Market" by Ulf Jensen, Page 183. This is reverse type of strategies. The strategy buys at market, if close price is higher than the previous close during 2 days and the meaning of 9-days Stochastic Slow...

Count:574
Name: Linda Raschke's Holy Grail
Description: Another script based on Linda Raschke's strategy with the same name from her book about swing trading.

Count:574
Name: Multiple MACD RSI simple strategy
Description: Simple strategy script I've had for a while but looks like I never published. Although it is one of my most simple it seems to have the best profitability. It is pretty rough though. the Stoch RSI has only a little weight to the trade trigger. I'll refine it more over time or you can by all means. Basically the Stoch RSI current K line has to be OVER 40 to...

Count:572
Name: Momentum Strategy (BTC/USDT; 30m) - STOCH RSI (with source code)
Description: Here's a strategy for low time frames (30min suggested) for BTC , based on momentum Analysis using Stochastic RSI By default the strategy will use the 50% of the specified capital for each trade; if "Gamble Sizing" is enabled, it will add the specified amount of capital (25% by default, until reaching the 100% limit or lower) for the next trade after having...

Count:571
Name: [Sniper] SuperTrend + SSL Hybrid + QQE MOD
Description: Hi. I’m DuDu95. ********************************************************************************** This is the script for the series called "Sniper". *** What is "Sniper" Series? *** "Sniper" series is the project that I’m going to start. In "Sniper" Series, I’m going to "snipe and shoot" the youtuber’s strategy: to find out whether the youtuber’s video about...

Count:570
Name: VWAP and BB strategy [EEMANI]
Description: This strategy combines VWAP and BB indicators BUY RULE 1. EMA50 > EMA 200 2. if current close > vwap session value 3. check if price dipped BB lower band for any of last 10 candles EXIT RULE 1. price closes above BB upper band STOP LOSS EXIT 1. As configured --- default is set to 5% warning: for the use of educational purposes only

Count:569
Name: [Advanced] Hilega-Milega Indicator
Description: This Indicator Name is Hilega Milega, and the original Idea given by Nitish Kumar, I just coded it and add some signals for backtesting. it works on RSI + WMA and EMA plotted. Default Values Used : RSI = 9 WMA = 21 EMA = 3 But i added some extra, now everyone can change the Type of WMA and EMA, also SMA for trend confirmation, How it works ?? Buy : When RSI...

Count:568
Name: Strategy Myth-Busting #6 - PSAR+MA+SQZMOM+HVI - [MYN]
Description: This is part of a new series we are calling "Strategy Myth-Busting" where we take open public manual trading strategies and automate them. The goal is to not only validate the authenticity of the claims but to provide an automated version for traders who wish to trade autonomously. Our sixth one we are automating is " I Tested ''7% Profit Per Day" Scalping...

Count:568
Name: CCU MFI + RSI + STOCH RSI
Description: This demonstrates the accuracy of entry signal of the MFI + RSI + STOCH RSI strategy

Count:567
Name: Golden Triangle Strategy
Description: Golden Triangle strategy setup is a variation of the buy-the-dip strategy, by Charlotte Hudgin. You can find the detailed explanation here by Thomas N. Bulkowski thepatternsite.com BUY === 1. price should be trading above sma50 2. when it touches sma50 first time , check the starting rallypoint of where it initiated 3. from the above point to current close ,...

Count:567
Name: True Strength Indicator BTCUSD 2H
Description: Script based on True Strength Index (TSI) and RSI A technical momentum indicator that helps traders determine overbought and oversold conditions of a security by incorporating the short-term purchasing momentum of the market with the lagging benefits of moving averages. Generally a 25-day exponential moving average (EMA) is applied to the difference between two...

Count:567
Name: ATR Trailing Stoploss Strategy
Description: I am sharing the strategy version of the indicator used before. It is very simple to use. These are the settings I use, you can change, test and use as you wish. Atr Period 5 Highest High Period 10 Multiplier 2.5 It can generate more signals in shorter time frames. The success rate will be higher in longer time frames.

Count:567
Name: Best SuperTrend BTCUSD
Description: Multi Chart view supported //Best profits for $BTCUSD examples: //res=165 view=30m fastPeriod=17 slowPeriod=9 profit %67.14 since 2017-08-14 //res=100 view=30m fastPeriod=16 slowPeriod=30 profit %57 since 2017-08-14 // If you want get access for super Trend with the best and optimazed values for: //LTCUSD profit +%120 //ETHUSD profit +%80 //OMGUSD profit...

Count:565
Name: [STRATEGY][RS]Roulette Martingale V0
Description: a solid strategy all across the majors. double the profits :p WARNING: use at your own discretion.

Count:564
Name: TradingGroundhog - Strategy & Wavetrend V2
Description: #-- Public Strategy - No Repaint - Fractals - Wavetrend -- Here I come with another script, a nice and simple strategy based on fractals and Wavetrends. #-- Synopsis -- A simple idea, on a small time frame (15 min) we buy when the opening price goes below a Bottom fractals and sell when it goes over a Top fractals, but in order to avoid bad and evil...

Count:564
Name: [LunaOwl] Support Resistance Strategy V4
Description: 作品: 支撐壓力策略 A simple Support Resistance Breakthrough Strategy, the only difference is that it is PineScript @version=4. interested parties can use it as a reference. Its logic is simple, wish your all the best. 一個簡單的支撐阻力突破策略,唯一的差異,在於它是PineScript第四版。有興趣的可以拿來當作參考,簡易的指標。祝你們順心。 Support level refers to the support price that the exchange rate may encounter when it...

Count:564
Name: [LunaOwl] 超級趨勢2 (SuperTrend2)
Description: It is very similar to the previous version. I changed the function from study to a strategy, and added the Average true range to RMA again. I don't know the academic suitability, but using this strategy to trade the Altcoins market may have a good effect. refer to Binance for 0.1% of fees, starting from Q4...

Count:561
Name: BTC Candle Correlation Strategy
Description: This is a special strategy adapted for crypto market, which instead of using the current chart candles, we use inside calculation a candle from different charts. For best usage I recommend a big timeframe like 1-4h+. In this case we take the high, low, open and close candles from different brokers for BTC, and with it we form up the candle that we are going to...

Count:561
Name: Chaikin Money Flow + MACD + ATR
Description: Here I present you on of Trade Pro's Trading Idea: Chaikin Money Flow + MACD + ATR. This strategy is not as profitable as it can be seen in one of his videos. In the forex market, the strategy could reach a maximum of 35% profitability. I have, as some of my followers have requested, created an overview of the current position, risk and leverage settings in the...

Count:561
Name: Linear Channel - Scalp Strategy 15M
Description: Simple way how to use Linear Regression for trading. What we use: • Linear Regression • HMA as a trend filter Logic: Firstly we make simple linear regression moving. It is the white line which appears on the chart. Then we make second line (named: band2) on the chart by multiplying linreg and value difference. The third step is to ad HMA as a trend filter. The...

Count:558
Name: scalping against trapped countertrend
Description: Abstract This script attempts to find the end of countertrend. This script uses oscillators to measure long term and short period trends. When the long term trend keeps positive and clear short term period is over, this script provides a buy signal. This script does not contain pullback, cut loss and re-enter. You need to add it manually. Introduction Many...

Count:557
Name: Order Block v1
Description: Hello Traders :) I am Only Fibonacci. While coding this indicator, I examined many concepts and decided to blend them. I took the method shared by most traders and added different perspectives and options. First of all, you can choose how many order block regions you want to see on the screen. Note: The levels displayed on the screen are the sum of bears and...

Count:557
Name: GMAE Original (By Kevin Manrrique)
Description: This script is called GMAE Original by me (Kevin Manrrique). I'm publishing this to the public because we are all traders and we need to support each other as a TVcommunity. This is something I built for fun. This script uses a series of EMA's. NO REPAINT, NO LAGGING! It works better for short-term trends as you can see. Please leave the copyright on the script at...

Count:551
Name: AK_ TREND ID AS A STRATEGY : FOR EDUCATIONAL PURPOSES ONLY
Description: Just converted the AK_ TREND ID into a strategy , to show the efficiency of this simple indicator. I used SPX in this example, to display that the indicator has been accurate for a long time.

Count:548
Name: Money Flow Indicator (Chaikin Oscillator)
Description: Indicator plots Money Flow Indicator (Chaikin). This indicator looks to improve on Larry William's Accumulation Distribution formula that compared the closing price with the opening price. In the early 1970's, opening prices for stocks stopped being transmitted by the exchanges. This made it difficult to calculate Williams' formula. The...

Count:548
Name: RePaNoCHa V4 [Backtest]
Description: This is the Backtest version of the previous one. It's important to correctly set the "TICKS / PIPS CORRECTION" parameter in each different chart. Enjoy!

Count:547
Name: yuthavithi BB Scalper 2 strategy
Description: If you are searching a high win rate strategy with good profit factor ratio strategy. this one may be your choice. Designed to be used with BTC or LTC. with 5 minute time frame or less. This BB strategy achieve win rate over 50% easily, with some tuning you can get even 60%+.

Count:545
Name: Fisher Transform Indicator by Ehlers Backtest v 2.0
Description: Market prices do not have a Gaussian probability density function as many traders think. Their probability curve is not bell-shaped. But trader can create a nearly Gaussian PDF for prices by normalizing them or creating a normalized indicator such as the relative strength index and applying the Fisher transform. Such a transformed output creates the...

Count:545
Name: YJ Mean Reversion
Description: Mean reversion strategy, based upon the price deviation (%) from a chosen moving average (bars). Do note that the "gains" are always relative to your starting capital, so if you set a smaller starting capital (e.g. $10000) your gains will look bigger. Also when the strategy tester has finished calculating, check the "Open P/L", as there could still be open trades....

Count:543
Name: WOMBO COMBO: EMA & VWAP & MACD & BB & STC
Description: Hello my fellow investors, After hours of reading, backtesting, and YouTube video watching I discovered that EMA, VWAP, BB, MACD, and STC produce the most consistent results for investment planning. This strategy allows you to pick between the aforementioned indicators or layer them together. It works on the pricipal of: 1) Always follow the market trend -...

Count:542
Name: Customizable OCC Non Repainting Scalper Bot v7.0b
Description: This strategy is intended to be used on an automated trading platform and should be run on a one minute chart for fastest confirmations and signal relay to crypto automation platform. The strategy has been modded to only go long at this time to focus on profitability for one direction. The open long and close long text fields allow you to use your own webhook...

Count:541
Name: wtfBUYorSELLffs
Description: Multiple timeframe Hull moving averages. 1 Hull period, 3 timeframes. With Info Panel This strategy is for any pair but the settings are tuned for DOGEUSDT It is 3 Hull moving averages crossovers. The first HMA is taken from the timeframe of the chart. The second and third HMA's have a setting for TIMEFRAME. For example the user can have the chart on 15m,...

Count:541
Name: Leverage Strategy and a few words on risk/opportunity
Description: Hello traders, I started this script as a joke for someone... finally appears it could be used for educational content Let's talk about leverage and margin call Margin Call A margin call is the broker's demand that an investor deposit additional money or securities so that the account is brought up to the minimum value, known as the maintenance margin. A...

Count:541
Name: Kozlod - Yet Another Moving Average Cross Strategy (9 MA types)
Description: You can choose one of these MA types in params: Simple Moving Average (SMA) Exponential Moving Average (EMA) Weighted Moving Average (WMA) Arnaud Legoux Moving Average (ALMA) Hull Moving Average (HMA) Volume-weighted Moving Average (VWMA) Least Square Moving Average (LSMA) Smoothed Moving Average (SMMA) Double Exponential Moving Average...

Count:540
Name: AK_RSI 2 Strategy ( based on Chris Moody RSI(2) indicator )
Description: Good Morning, Republishing this in the script section to make the code visible to everyone. This strategy is based on Chris Moody's RSi(2) indicator. Good success rate on SPY. Again, this is for educational purposes only . cheers Algo

Count:540
Name: B-Xtrender [Backtest Edition] @QuantTherapy
Description: Today I have published a Backtest edition of one of my scripts. For anyone looking into the indicators please have in the source below where the logic behind the indicator is nicely explained also the source of the inspiration of me coding it in tradingview. ifta.org Strategy Entry when both bars are in alignment both green = long / both red = short ...

Count:539
Name: MTF Diagonally Layered RSI - 1 minute Bitcoin Bot [wbburgin]
Description: This is a NON-REPAINTING multi-timeframe RSI strategy (long-only) that enters a trade only when two higher timeframes are oversold. I wrote it on BTC/USD for 1min, but the logic should work on other assets as well. It is diagonally layered to be profitable for when the asset is in a downtrend. Diagonal layering refers to entry and exit conditions spread across...

Count:538
Name: Super Trend 3
Description: Super Trend 3 Strategy migrates the version 2 script to a version 3 script to eliminate repainting.

Count:538
Name: SuperTrend Strategy
Description: This is almost the same strategy that Alex Orekhov (everget) sells to unnoticed newbies... The only thing he added was a tool that analyses the better performance of the indicator, that is the difference from his script, and i dont have it here, what i have is what is freely distributed in many communities... But as i follow him for more than 1 year i saw that...

Count:537
Name: Strategy Tester EMA-SMA-RSI-MACD
Description: On Tradingview I never saw a custom adjustable strategy script yet, so this is it, you can change different things and see if you'll get a good strategy or not Settings: First choose the source, you can choose out of: close, open, high, low, ohlc4, hlc3, hl2 Then choose you strategy: Long & Short, Long only or Short only Next, choose your entry "Buy/Long"...

Count:537
Name: Candlestick Signals Strategy
Description: This strategy allows you to pick from 9 different candlestick patterns, and test them against historical data from your chart. You can get a good idea what patterns work best for each chart by turning each pattern on and off in the settings.

Count:537
Name: MACD Signal with RSI Indicating Strategy
Description: This strategy looks for MACD signal crossover and RSI confirmation of oversold/overbought condition. Tune to your crypto/stock for best results using the strategy and sent an alert. Currently set up to use 25% of equity at each buy signal and will sell 1/3 of position at each sell signal. Initial investment is $1000, but adjust as necessary. Currently tuned to...

Count:536
Name: Combo Backtest 123 Reversal & Prime Number Oscillator
Description: This is combo strategies for get a cumulative signal. First strategy This System was created from the Book "How I Tripled My Money In The Futures Market" by Ulf Jensen, Page 183. This is reverse type of strategies. The strategy buys at market, if close price is higher than the previous close during 2 days and the meaning of 9-days Stochastic Slow...

Count:535
Name: Divergence for Many [Dimkud - v5]
Description: Strategy is based on "Divergence for Many Indicators v4 ST" strategy by CannyTolany01 which is based on "Divergence for Many Indicator" indicator by LonesomeTheBlue This strategy is searching for divergences on 18 indicators which you can select and optimise one by one. Additionally you can connect any other External Indicator value. (just add this indicator the...

Count:533
Name: Divergence for Many Indicators v4 ST
Description: Hello Traders. This is the Strategy version of Divergence for Many Indicators v4, an easy and comfortable indicator. - - - - *It's been modified a little bit from the original. *I got permission from the original author. *I'm not good at English, I'm sorry. - - - - < 4 things to check > 1. Since repainting is not performed, the first imprinted signal can be...

Count:533
Name: QuantNomad - SuperTrend - XBTUSD - 1m
Description: Interesting performance for Super Trend strategy for XBTUSD 1m chart. Params: ST Mult: 2, ST Period 14. Performance: 144% profit, 1988 trades, only 41% prof, 2.04% dd , 2.51 Sharpe. On its own, it might be not a very good strategy, but the big amount of trades allows you to add more filters and improve it. And remember: Past performance does not guarantee...

Count:532
Name: Robot WhiteBox Channel
Description: Price Channel The strategy uses the price channel indicator. In the chart, the price channel is displayed in black lines. Offset 1 candle to the right for clarity. The red line is the middle of the price channel. Trading You must use market stop orders. If the price is higher than the top black line, open the long position (and close the short position) If...

Count:531
Name: Volume fight strategy
Description: The Volume fight strategy looks for the predominance of bullish or bearish trading volume on the chart by dividing the trading volume in the bar into 2 parts - "bullish volume" and "bearish volume", and comparing the weighted average values by volume with each other at a given distance. This strategy is suitable for any instrument (cryptocurrency, Forex, stocks)...

Count:530
Name: Morun Astro Trend MAs cross Strategy
Description: Astrology machine learning cycles indicator signals with technical MAs indicators strategy, based on signals index of Github project github.com

Count:529
Name: MA Crossover Strategy
Description: Allows you to backtest different SMA & EMA crossover strategies.

Count:529
Name: Open Close Cross Strategy plus Explorer
Description: Open Close Cross Strategy plus Explorer V 1.0 There is a code that can control sensitivity. try to change 'ATR Multiplier' menu There is a code for prevent 'repaint'. If you want it check 'Forces Non-Repainting' menu thanks to PMax Explorer STRATEGY & SCREENER KivancOzbilgic Open Close Cross Strategy R5 revised by JustUncleL JustUncleL

Count:528
Name: [blackcat] L2 Reversal Labels Strategy
Description: Level: 2 Background There is a Chinese proverb that says: "The great way leads to simplicity". This indicator is the representative of this meaning. Through the processing of the most common MACD indicator data, it is possible to quickly determine the market price: whether the current price is at a historical high or low, whether a reversal will happen soon,...

Count:528
Name: Multiple %% profit exits example
Description: This example show how to make multiple take profits in percent.

Count:527
Name: Volume Difference Delta Cycle Oscillator
Description: Volume Difference Delta Cycle Oscillator indicator: Using the power of my Volume Difference Indicator and standard deviations based on Bollinger Bands and more, we present this wonderful indicator with the following features: Price Action Histogram: This is the bread and butter of this graph, if the PAH is above 0, this is considered a BULL cycle, and if below...


Count:527
Name: Ultimate Moving Average Strategy
Description: Converted famous indicator CM_Ultimate_MA_MTF to strategy. Works well only at big timeframes from 8H and with stop-losses.

Count:527
Name: 3 EMA + Stochastic RSI + ATR
Description: 3ESRA v0.2a Coded by Vaida Bogdan 3ESRA consists of a 3 EMA cross + a close above (for longs) the quickest EMA or below (for shorts). Note that I've deactivated the RSI Cross Over/Under (you can modify the code and activate it). The strategy also uses a stop loss that's at 1 ATR distance from the entry price and a take profit that's...

Count:526
Name: Amazing Crossover System - 100+ pips per day!
Description: I got the main concept for this system on another site. While I have made one important change, I must stress that the heart of this system was created by someone else! We must give credit where credit is due! Y'all know baby pips. @ForexPhantom published about this system and did both back and forward test around 10 years ago. I found it on the sit and now I put...

Count:526
Name: Backtest Signal To Noise
Description: This source code is subject to the terms of the Mozilla Public License 2.0 at mozilla.org © HPotter 05/01/2021 The signal-to-noise (S/N) ratio. And Simple Moving Average. Thank you for idea BlockchainYahoo WARNING: - For purpose educate only - This script to change bars colors.

Count:525
Name: Pyramiding BTC 5 min no security
Description: Since some say that the script with the security is repaint and the results too preety i decided to run the same script without it. still the best is when security set to 1 min but without the difference not so much. it just to show the concept of the strategy that based on linear regression cross hull as buy signal and the the take profit target. so maybe now its...

Count:525
Name: RSI Overbought Oversold Divergence Strategy w/ Buy/Sell Signals
Description: This indicator is a copy of my RSI Overbought/Oversold Divergence Indicator with-Alerts Only difference is that the alerts are disabled, instead it uses tradingviews strategy tester signals If you want alerts just use the other indicator

Count:525
Name: Backtesting Period Selector | Component
Description: Description It's nice to quickly be able to set the backtesting period when writing strategies. To make this process faster I wrote a simple 'component'. So this is not a strategy but rather code you can plug-into your strategy and use if you need that specific functionality. Then it's just a matter of selecting which dates you want to backtest. You can also...

Count:523
Name: Pivot Points Support + Resistance Strategy
Description: The WHAT =============> A strategy based off 3 indicators: 1) the original TV's "Pivot Points Standard" indicator 2) Cyclic RSI High Low With Noise Filter indicator ( ) from @RozaniGhani-RG as basis for determining uptrend or downtrend 3) Mesa Advanced Triggers indicator ( ) from @jordanfung to filter out the best high/low points where to open and close...

Count:521
Name: Hull MA-X + Ichimoku Kinko Hyo Strategy
Description: Hull MA-X: The Hull MA involves the weighted moving average ( WMA ) in its calculation. First, calculate the WMA with period (n / 2) and multiply this by 2. Remember ‘n’ is the time period configurable based on the trader’s requirement. Second, calculate the WMA for period “n” and subtract if from the first step. Thirdly, calculate the weighted moving average...

Count:521
Name: Qullamaggie Breakout
Description: The intent of this strategy is to buy breakouts with a tight stop on smaller timeframes in the direction of the longer term trend. Default longer term trend is the daily, but the user can choose any timeframe to use for the SMAs (which act as filters and trailing stops). Exit the trade using a trailing stop of a close below either the 10 MA or 20 MA (user...

Count:519
Name: 3LS | 3 Line Strike Strategy [Kintsugi Trading]
Description: What is the 3LS | 3 Line Strike Strategy? Incorporating the 3 Line Strike candlestick pattern into our strategy was inspired by Arty at The Moving Average and the amazing traders at TheTrdFloor . The Three Line Strike is a trend continuation candlestick pattern consisting of four candles. Depending on their heights and collocation, a bullish or a bearish...

Count:519
Name: Inside Bar Strategy w/ SL
Description: "Inside bars are a two -bar pattern. They can indicate either a continuation of the existing move or a reversal. A continuation occurs when there is no significant support or resistance level in sight, while a reversal occurs close to a strong sup- port or resistance level... ...A lot of traders are aware of inside bars but few manage to make money with them....

Count:519
Name: VWMA_withATRstops_strategy
Description: This strategy follows the trend when price is above VWMA indicator. I have modified entry and exit rules to get most out of it. Instead of entering LONG when price crosses above VWMA, I have used RSI(14) of VWMA . that way it skips the false signals. (some extent) ENTRY ======== 1. VWMA setting is 33 2. When RSIofVwma is above 30 enter Long ( and ...

Count:519
Name: The Flash-Strategy (Momentum-RSI, EMA-crossover, ATR)
Description: The Flash-Strategy (Momentum-RSI, EMA-crossover, ATR) Are you tired of manually analyzing charts and trying to find profitable trading opportunities? Look no further! Our algorithmic trading strategy, "Flash," is here to simplify your trading process and maximize your profits. Flash is an advanced trading algorithm that combines three powerful indicators to...

Count:518
Name: Super Trend Daily BF 🚀
Description: Super Trend is based on volatility and attempts to show the overall greater trend of a market. Thanks to everget for the idea of improving the Super Trend code. Thanks to kiasaki for ROC code. The idea here is to enter a trade upon trend reversal (unless we have a white background - this indicates choppy/sideways market). INSTRUCTIONS Follow the background color...

Count:518
Name: Noro's SRSI Strategy
Description: Indicator Blue line - common RSI indicator. Red line - SMA based on RSI Upper black line - 50% + limit (custom parameter, 65% by default) Lower black line - 50% - limit (custom parameter, 35% by default) Strategy If the red line (SMA) is higher than the upper black line, open a long position (and close the short position). If the red line (SMA) is lower than...

Count:517
Name: Ema Scalp
Description: This is another simple strategy based on ema Entry Buy - 1) when close crossover ema then buy and only open one trade till it not close 2) if previous buy trade is profitable open another trade and check again trade is profitable or not 3)if trade is not profitable reset and wait for sell condition... Entry Sell -1) when...
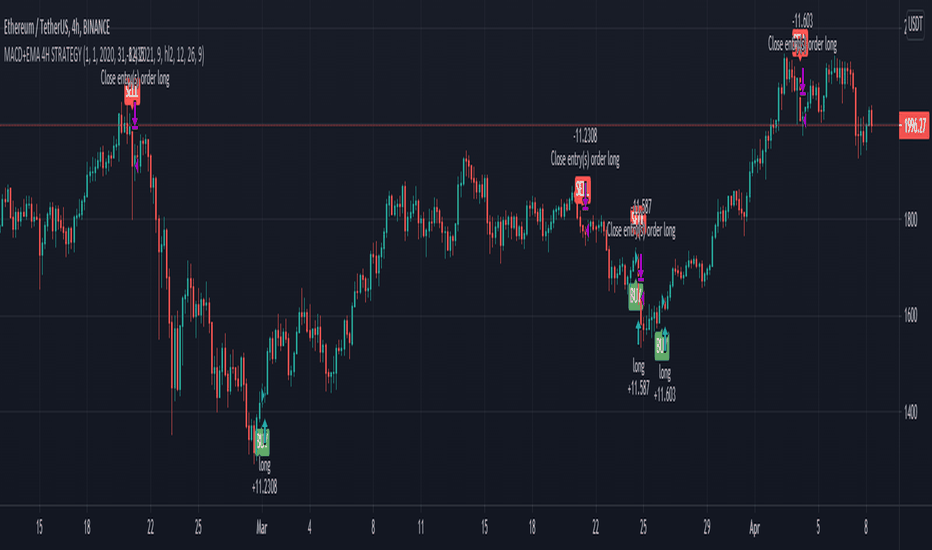
Count:516
Name: MACD oscillator with EMA strategy 4H
Description: This is a simple, yet efficient strategy, which is made from a combination of an oscillator and a moving average. Its setup for 4h candles with the current settings, however it can be adapted to other different timeframes. It works nicely ,beating the buy and hold for both BTC and ETH over the last 3 years. As well with some optimizations and modifications it...

Count:515
Name: [Pt] Premarket Breakout Strategy
Description: This is a 1 trade per day strategy for trading SPY or QQQ index. By default, this is designed for 1 min time frame. This was an experimental script that seems to be profitable at the time of publication. How it works: Pre-market high and low is defined per trading day between 9:00 to 9:30 EST. Then we looking for the first breakout on either PM high or PM...

Count:515
Name: Coppock Curve Strategy
Description: This strategy makes use of a not widely known technical indicator called "Coppock Curve". The indicator is derived by taking a weighted moving average of the rate-of-change (ROC) of a market index such as the S&P 500 or a trading equivalent such as the S&P 500 SPDR ETF. For more info: (www.investopedia.com) This strategy uses $SPY Coppock curve as a proxy to...

Count:515
Name: Loft Strategy V4
Description: This strategy is an advanced version of the Loft Strategy V1, I shared earlier. (Loft Strategy V1 consists of a kalman filter (by alexgrover ) and a "stop and reverse" line which is following and the kalman filter. If the price goes in the same direction as the position side, the "stop and reverse" line approaches the kalman filter as set on the "Approach...

Count:514
Name: Cowabunga System from babypips.com
Description: Please do read the information below as well, especially if you are new to Forex. The Cowabunga System is a type of Mechanical Trading System that filters trades based on the trend of the 4 hour chart with EMAs and some other familiar indicators (RSI, Stochastics and MACD) while entering trades base on 15 minute chart. I have coded (quite amateurishly) the basic...

Count:514
Name: Simple and Profitable Scalping Strategy (ForexSignals TV)
Description: Strategy is based on the "SIMPLE and PROFITABLE Forex Scalping Strategy" taken from YouTube channel ForexSignals TV. See video for a detailed explaination of the whole strategy. I'm not entirely happy with the performance of this strategy yet however I do believe it has potential as the concept makes a lot of sense. I'm open to any ideas people have on how it...

Count:511
Name: Optimized Trend Tracker - Strategy Version
Description: A brand new indicator from the developer of MOST (Moving Stop Loss) indicator Anıl Özekşi. Optimized Trend Tracker OTT is an indicator that provides traders to find an existing trend or in another words to ser which side of the current trend we are on. The original indicator was coded and published by Kıvanç Özbilgiç. You can access it from this link: I...

Count:511
Name: RSI of MACD Strategy [Long only]
Description: This strategy uses the RSI on MACD indicator. BUY ==== When RSI indicator crossing over 30 or 35 line and price above slow ema Note: when the position already taken, you may reenter on the purple candle Partial Exit ========== Partial profit taking option is available in settings. If this is selected , 1/3 position exited when RSI indicator crossing...

Count:510
Name: MACD Crossover Backtest
Description: MACD – Moving Average Convergence Divergence. The MACD is calculated by subtracting a 26-day moving average of a security's price from a 12-day moving average of its price. The result is an indicator that oscillates above and below zero. When the MACD is above zero, it means the 12-day moving average is higher than the 26-day moving average. This is...

Count:510
Name: MACD+STOCHASTIC
Description: A simple strategy that use MACD and STOCHASTIC to give buy/sell signal. Use fractals to put stop loss

Count:509
Name: Heikin-Ashi MACD
Description: "Heikin-Ashi, also sometimes spelled Heiken-Ashi, means "average bar" in Japanese. The Heikin-Ashi technique can be used in conjunction with candlestick charts when trading securities to spot market trends and predict future prices. It's useful for making candlestick charts more readable and trends easier to analyze. For example, traders can use Heikin-Ashi charts...

Count:509
Name: inwCoin Martingale Strategy ( for Bitcoin )
Description: ** Same as my previous martingale script but this version = opensource ** inwCoin Martingale Strategy is the proof of concept strategy that in the end, anyone who using martingale strategy will kaboom their portfolio. For those who don't know what is "martingale".. it's a simple double down strategy in the hope to cover the loss in previous entry. Example In the...

Count:509
Name: tradinghub-3 Structure mapping
Description: An Insight into Structure Mapping HUB3 with Smart Money Concepts - Inducements (IDM) - Break of Structure (BoS) - Change of Character (ChoCh) - Daily H & L

Count:508
Name: Fair Value Strategy Ultimate
Description: This is a strategy using an index's (SPX, NDX, RUT) Fair Value derived from Net Liquidity. Net Liquidity function is simply: Fed Balance Sheet - Treasury General Account - Reverse Repo Balance Formula for calculating the fair value of and Index using Net Liquidity looks like this: net_liquidity/1000000000/scalar - subtractor The Index Fair Value is then...

Count:508
Name: Aggresive Scalper/Swing Crypto Strategy
Description: This is a simple yet very efficient scalper long strategy adapted for low timeframes for crypto. Can also be used with bigger timeframes as a swinger. Its main components are: Price oscillator swing Vortex Risk management for TP/SL Rules for entry We calculate the difference between the oscillator from the lowest low and the highest high. If the difference is...

Count:508
Name: Simple RSI and SMA Long and Short (by Coinrule)
Description: The relative strength index ( RSI ) is a momentum indicator used in technical analysis . RSI measures the speed and magnitude of a security's recent price changes to evaluate overvalued or undervalued conditions in the price of that security. The RSI is displayed as an oscillator (a line graph) on a scale of zero to 100. The RSI can do more than point to...

Count:507
Name: Strategy NNFX Tester
Description: Strategy NNFX, Baseline, QQEs Fast C1, Slow C2, ATR, Volume and Exit This is a Strategy Tester designed to work with Study (Alerts) of the same. At time of creation based on Revision 8 of the Study. DO NOT USE the Currency/Money Management section under settings. use the position sizing under "Inputs" - "Money Management" - "Risk per trade" which is...

Count:507
Name: SuperTrend - Custom Screener and Dynamic Alerts
Description: Trading View today published a desktop Bad Internet connection indicator ?! which set me thinking… Despite recently introduced Dynamic Alerts many scripts do not leverage the information available for active traders and traders on the GO! So decided to share this script totally ALERT focused on one of the most popular DAY trading indicators. Of course no more BAD...

Count:506
Name: Kitchen [ilovealgotrading]
Description: OVERVIEW: Kitchen is a strategy that aims to trade in the direction of the trend by using supertrend and stochRsi data by calculating at different time values. IMPLEMENTATION DETAILS – SETTINGS: First of all, let's understand the supertrend and stocrsi indicators. How do you read and use Super Trend for trading ? The price is often going upwards when...

Count:506
Name: Combined Strategy Trading Bot (RSI ADX 20SMA)
Description: Trading Bot V1, This code implements a combined trading strategy that uses several indicators and strategies to make buy and sell decisions in the market. The code is written in Pine Script™, which is a programming language used in the TradingView platform. By BraelonWhitfield.Eth The strategy uses the Average Directional Movement Index (ADX) and the Pine...

Count:505
Name: NSDT HAMA Candles STRAT
Description: This is a STRATEGY based on our popular HAMA Candles Indicator. It is an "Always On" strategy, meaning it will stay in a Long position until the Short criteria shows up, and then it will close the Long position and immediately enter a Short position. Since this is a strategy, we added a few more components. The most notable one is the grid at the top right that...

Count:504
Name: MACDouble + RSI (rec. 15min-2hr intrv)
Description: Uses two sets of MACD plus an RSI to either long or short. All three indicators trigger buy/sell as one (ie it's not 'IF MACD1 OR MACD2 OR RSI > 1 = buy", its more like "IF 1 AND 2 AND RSI=buy", all 3 match required for trigger) The MACD inputs should be tweaked depending on timeframe and what you are trading. If you are doing 1, 3, 5 min or real...

Count:504
Name: High Gain Volume Strategy Only 2 Candles
Description: The result after having a good wine... Data with reliable volume required. to enjoy!

Count:503
Name: TradePro's 2 EMA + Stoch RSI + ATR Strategy
Description: Saw TradePro's "NEW BEST HIGHEST PROFITING STRATEGY WITH CRAZY RESULTS - 2 EMA+ Stochastic RSI+ ATR", and was curious on the back testing results. This strategy is an attempt to recreate it. This strategy uses 50 / 200 EMAs, Stochastic RSI and ATR. Long Entry Criteria: - 50 EMA > 200 EMA - Price closes below 50 EMA - Stochastic RSI has gone into oversold <...

Count:502
Name: Strategy Multiple Orders + Statistics Template - Educational
Description: Hello traders It's been a while We're back in a bear market so I have a bit more time to publish new Pine scripts for the TradingView community Special thanks to @fikira for his Multiple Orders script () and to @carnagecain for allowing me to publish this script we worked together on I got widely inspired by @fikira's script for that one This script is for...

Count:501
Name: Full strategy Psar+ adx + cmf + rsi
Description: This ia full strategy made with a combination of a trender, volume, volatility and oscillator. In this case we only go long. Indicators used: Default PSAR Default CMF Modified RSI logic, not using OB/OS ADX with EMA applied The rules are : we check if we are in a uptrend on psar, together with a positive value in volume, rsi is above the middle line(50), using...

Count:500
Name: Extremely high win rate FOREX swing strategy
Description: THis is a very simple yet extremely efficient FOREX strategy . In general it tends to work the best against NZD and AUD pairs, however other major pairs and crosses can work as well. It's made of a time management, together with MACD , moving average , a price action rule and a risk management. THe logic behind is the next one : For LONG: We have 3 ascending...

Count:499
Name: 4H CCI Strategy 1.5
Description: Included adaptive lot size based on ATR, and also ATR based stop and take profit levels. Risk/reward increased to 1:2 and should work in all ranging FX pairs as long as they are not trending. Once the market starts trending it'll eat this bot alive. Cheers, Ivan Labrie Time at Mode FX

Count:499
Name: Strategy based on the principles of Price Action
Description: It is considered the percentage of candles with low and high closure for a certain period. Then, a moving average is built from these values. When the moving average of the ratio of tall candles to low candles is greater than the ratio of low candles to high, then long (that is, when the green line crosses the red). And vice versa - a condition for short. It also...

Count:499
Name: Kahlman HullMA / WT Cross Strategy
Description: A strategy created using Hull Moving Average and WT Cross . Hull Moving Average turns green and WT Cross crossover this is a long. Otherwise short. Stop Loss and Take Profit settings are available. You can set it to the level you want or turn it off. According to my measurements, it shows the best performance in the 4-hour period. But you can find the best...

Count:497
Name: TKP McClellan Summation Index Stochastics Strategy
Description: This strategy uses NYSE McClellan summation Index as an input for Stochastics to produce Buy/Sell signals. Buy signal is produced when Stochastics K Line Closes over 50, and Sell signal when closes under 50. Info on McClellan Summation Index: www.investopedia.com Info on Stochastics: www.investopedia.com Simple yet effective strategy, let me know if you have...

Count:497
Name: Buy - Take Profit OR Stop Loss % Based
Description: Script looks back for a certain period of time and than enter when price close above that look back period ema. Once enter it does not care for how many times price cross above or below. Once entered, it will either hit percenatage based take profit of stop loss.

Count:496
Name: Combo Backtest 123 Reversal & Rainbow Oscillator
Description: This is combo strategies for get a cumulative signal. First strategy This System was created from the Book "How I Tripled My Money In The Futures Market" by Ulf Jensen, Page 183. This is reverse type of strategies. The strategy buys at market, if close price is higher than the previous close during 2 days and the meaning of 9-days Stochastic Slow...

Count:495
Name: RSI SMA Crossover Strategy
Description: Overview RSI SMA Crossover Strategy works the same way as traditional MA crossover strategies, but using RSI instead of price. When RSI crosses over the SMA, a long position is opened (buy). When RSI crosses under the SMA, the long position is closed (sell). This strategy can be very effective when the right inputs are used (see below). Be sure to use the...

Count:495
Name: DRSI DMA Scalping Strategy No Repaint
Description: This strategy compares the slope of a Moving Average (of your choosing) to the slope of a Momentum Indicator (of your choosing). Zero is the center line because 0 slope means sideways movement. When both lines cross your buy threshold, it buys. When both lines cross your Sell threshold, it sells. The lines may look choppy, but that is probably because it is...

Count:494
Name: Candlestick Patterns Strategy (revisited)
Description: This strategy is used as a benchmark to see how it compares with other strategies posted by me recently. In all, the below collection of candlestick patterns appears to be one of the best among the ones that can be found here, imho.

Count:493
Name: Nadaraya-Watson Envelope Strategy (Non-Repainting) Log Scale
Description: In the diverse world of trading strategies, the Nadaraya-Watson Envelope Strategy offers a different approach. Grounded in mathematical analysis, this strategy utilizes the Nadaraya-Watson kernel regression, a method traditionally employed for interpreting complex data patterns. At the core of this strategy lies the concept of 'envelopes', which are essentially...

Count:493
Name: Kozlod - Simple BB Strategy - XBTUSD - 1 minute
Description: Really nice performance for simple BB on XBTUSD Bitmex 1 minute chart. BB length = 55, BB mult = 4. No SL or PT used. Amazingly performance for the last week, 92% profitable. Tested on entire May percent profitable become 80%, still not bad. And remember: Past performance does not guarantee future results.

Count:493
Name: BEST Strategy Template Autoview
Description: Hello Traders I've build a strategy template building for you the AUTOVIEW commands I made this template based on this documentation: use.autoview.with.pink You can select whether you want to use an SL or not, a TP or not, using the borrow/repay feature (only for Binance), ... and it will build dynamically the Autoview commands and will send them when...

Count:493
Name: BollingerBands Strat + pending order alerts via TradingConnector
Description: Software part of algotrading is simpler than you think. TradingView is a great place to do this actually. To present it, I'm publishing each of the default strategies you can find in Pinescript editor's "built-in" list with slight modification - I'm only adding 2 lines of code, which will trigger alerts, ready to be forwarded to your broker via TradingConnector...

Count:492
Name: LinearRegressionChannelBreakout
Description: My first idea about the linear regression channel... It is free and available for everybody.

Count:492
Name: [MT] Strategy Backtest Template
Description: | Initial Release | | EN | An update of my old script, this script is designed so that it can be used as a template for all those traders who want to save time when programming their strategy and backtesting it, having functions already programmed that in normal development would take you more time to program, with this template you can simply add your favorite...

Count:491
Name: Combo Backtest 123 Reversal & N Bars Down
Description: This is combo strategies for get a cumulative signal. First strategy This System was created from the Book "How I Tripled My Money In The Futures Market" by Ulf Jensen, Page 183. This is reverse type of strategies. The strategy buys at market, if close price is higher than the previous close during 2 days and the meaning of 9-days Stochastic Slow...

Count:491
Name: X48 - Strategy | MA Type Cross + TPSL | Future&Spot | V.2
Description: Thank You For Open Source Code, This Strategy Ref. By 1.Simple Strategy Like MA Crossover For Long/Short or Spot Trade, 2. CDC Action Zone V.2 for BarPaint This Strategy Mixing With MA Crossover Strategy and BarPaint By CDC Action Zone and TP/SL by Varbara ### How To Use Strategy : Setting EMA/SMA Crossover EMA/SMA, Any Value If You Want For Long Position :...

Count:488
Name: The Pivot Reversal Strategy (Just changed it a bit)
Description: Just changed it a bit, no kudos to me, was literally five minutes changing parameters. Cheers

Count:487
Name: [laoowai]BNB_USDT_3m_3Commas_Bollinger_MACD_RSI_Strategy
Description: BNB_USDT _3m Release Notes: Time: 3min Pair: BNB_USDT Use: {{strategy.order.alert_message}} What's the difference with 3Commas Bollinger Strategy by tedwardd: 1. Initial capital: 1210 USDT (10$ Base order / 400$*3 Safety order), if you will change, please change JUST safety order volume or number of safety orders 2-3 2. Using just 2(3) safety...

Count:487
Name: Noro's ZZ-2 Strategy
Description: ZZ = ZigZag. Strategy uses the ZigZag indicator. From the top points of the ZigZag indicator lime lines are drawn. From the lower points of the ZigZag indicator red lines are drawn. Strategy market-stop-orders are necessary. Or it is very desirable. If the price became higher than the lime line - to open a long position. If the price became lower than the red...

Count:486
Name: Alert(), alertcondition() or strategy alerts?
Description: Variety of possibilities offered by PineScript, especially thanks to recent additions, created some confusion. Especially one question repeats quite often - which method to use to trigger alerts? I'm posting this to clarify and give some syntax examples. I'll discuss these 3 methods in chronological order, meaning - in the order they were introduced to...

Count:486
Name: Donchain Breakout
Description: It is a long only strategy. 1. Buy when price breaks out of the upper band. 2. Exit has two options. Option 1 allows you to exit using lower band. Option 2 allows you to exit using basis line. 3. Slippage and commissions are not considered in the return calculation.

Count:486
Name: [VJ] Gann Double Band Buy Sell
Description: Use the BB to get the channel and buy sell signals to trade. Only use it for reaffirmation . No live trade pls.

Count:485
Name: VWAP_X_EMA
Description: VWAP and EMA 50 combo indicators Long : if the close is above the VWAP and EMA Short : Viceversa

Count:485
Name: My EA Strategy for 3 minute BO
Description: I made an EA for my long term project on Binary Option trading. TimeFram = 1 minute Signals are: Green Spike = Buy (for 3 minutes expiration) Red Spike = Sell (for 3 minutes expiration) Strategy: VMWA (50&200) = Trend Indicators RSI (30) = pull back entry signal on a strong trend BackTest = 80% Winning Rate Improvements Needed: >> Better Entry...

Count:485
Name: Kirk65 UTBot Strategy Fixed
Description: Credits to @HPotter for the orginal code. Credits to @Yo_adriiiiaan for recently publishing the UT Bot study based on the original code. Credits to @TradersAITradingPlans for making UT Bot strategy. Strategy fixed with time period by Kirk65. UT Bot works great with 2 hour time frame with Heikin Ashi, but riskier. Use "Once per bar" In alerts with 1.5% stoploss....

Count:484
Name: TDI Hedge Strategy
Description: This is the incomplete version but upon multiple requests, I have released it early. All of the strategy and alert functions are yet to be written and I'll get around to it soon. This indicator aims to be the best TDI indicator on TradingView. It is a strategy or study. It will have all of the filter, entry, and exit conditions for the strategies around the...


Count:482
Name: Autoview Build-a-bot - 5m chart
Description: THIS IS NOT MINE i configured every input for the best performance on BTC/USD 5m chart the original is awesome (no repaint)

Count:482
Name: Risk Management Strategy Template
Description: This strategy is intended to be used as a base template for building new strategies. It incorporates the following features: Risk management: Configurable X% loss per stop loss Configurable R:R ratio Trade entry: Calculated position size based on risk tolerance Trade exit: Stop Loss currently configurable ATR multiplier but can be replaced...

Count:481
Name: Heikin Ashi EMA v5 no repaint
Description: This script was inspired by the "Heikin/Kaufman Strategy" from marco valente built on v2. The script was rebuilt on the v5 and most importantly removed the repaint function that was driving surrealistic backtesting inflated numbers. This script is now fully functional and not repainting - At the time of testing worked efficiently 90% WR and 2x profit factor on...

Count:481
Name: Ehlers Instantaneous Trendline Strategy
Description: Instantaneous Trendline Strategy by John Ehlers from his book "Cybernetic Analysis for Stocks and Futures". You can choose implementation of stop-loss. Don't forget to define correct spread for your instrument.

Count:478
Name: Three moving average strategies
Description: If the short term (Default 7) moving average cuts the medium term (default 25) moving average, BUY. Conversely, it generates the SELL signal. If the long term (Default 99) moving average cuts its short term moving average, Quick SELL. Conversely, it can be interpreted as Fast SELL. You can change the moving average and the number of days as you wish, and you can...

Count:478
Name: BBofVWAP with entry at Pivot Point
Description: This strategy uses BB of VWAP and Pivot point to enter and exit the Long position. settings BB length 50 BB Source VWAP Entry When VWAP crossing up BB midline and price/close is above weekly PivotPoint ( you can also use Daily pivot point ) Exit When VWAP is crossing down BB lower band Stop Loss Stop loss defaulted to 5% Note : Long will...

Count:477
Name: Moving Average Envelopes Backtest
Description: Moving Average Envelopes are percentage-based envelopes set above and below a moving average. The moving average, which forms the base for this indicator, can be a simple or exponential moving average. Each envelope is then set the same percentage above or below the moving average. This creates parallel bands that follow price action. With a moving...

Count:477
Name: 3 Duck's Trading System from Babypips.com
Description: The 3 Duck's Trading System from Babypips.com The 3 Duck's Trading System is the most popular and active trading system thread on the the babypips.com forum. It is a system that is mainly for beginners because it teaches you discipline, learning to cope with price moving against your position and learning to stay in a trade and keep profits running. For the...

Count:476
Name: Hull Moving Average Crossover Strategy
Description: Hull Moving Average Crossover, the Strategy version, so people can easily test the profitability of it. Use Indicator version for use with Alerts

Count:475
Name: 3Commas Visible DCA Strategy
Description: This strategy consists of the following elements and can all be set by the user. 1. Entry by moving average cross. 1) Selection of moving average line. - SMA(Simple Moving Average) - EMA(Exponential Moving Average) - HMA(Hull Moving Average) 2) Selection of Cross over / Cross under 2. Add Entry by DCA(Dollar Cost Averaging) - A DCA strategy is the...

Count:475
Name: Ichimoku Kinko Hyo Cloud + QQE
Description: Combination of two strategies with alerts. Those scripts are not mine, I just mixed them up for own purposes. I recommend use long alerts of Ichimoku in 15 minutes bars and short alerts of QQE strategy in 15 minutes bars as well. QQE strategy should be used for quick price movements and Ichimoku for litle longer ones. Good Luck!

Count:475
Name: Hancock - Filtered Volume OBV OSC [Strategy]
Description: Trading strategy based on Donchain channel price breakouts confirmed by an optionally configurable volume filtered OBV oscillator. Colored diamonds on charts represent signals where top side is buy side and bot side is sell side - green indicates open and red indicates close. Pretty simple but nicely demonstrates the volume filtered OBV oscillator found here...

Count:474
Name: Trend Bounce [racer8]
Description: I discovered this mechanical trading system titled "This Algo Strategy Has Only 3 rules and 62% Win Rate". I coded the trading system on Tradingview...and now I am introducing it to you guys. I modified the system so that it has both buy & sell signals. I've tested it repeatedly in different markets on TV including stocks, currency pairs, bitcoin, and...

Count:474
Name: Strategy Myth-Busting #1 - UT Bot+STC+Hull [MYN]
Description: This is part of a new series we are calling "Strategy Myth-Busting" where we take open public manual trading strategies and automate them. The goal is to not only validate the authenticity of the claims but to provide an automated version for traders who wish to trade autonomously. Our first one is an automated version of the " The ULTIMATE Scalping Trading...

Count:474
Name: ADX / RSI Strategy by Trade Rush (created by SirPoggy)
Description: This is one of many new strategies coming soon which were seen on Trade Rush This one is the ADX / RSI Strategy seen here: https:www.youtube.com/watch?v=uSkGE0ujyn4 While the strategy has been modified slightly to use the DMI instead of the ADX, the core of the strategy is essentially the same Long signals are generated when the RSI is above 70, close is...

Count:474
Name: BTCBOT2
Description: Watches 3 Symbols with separate timeframe control, with Hull Moving Average crossovers on each, DXY XAU/USD BTC/USD and a daily candle crossover. With StopLoss and Target Price and Backtesting history selection control. Entry and Exit rules visible in script (script open) So if DXY chart is going down and Gold chart going up and Bitcoin chart going up then...

Count:472
Name: SuperIchi Strategy
Description: TRADE CONDITIONS Long entry: Tenkan-Sen is above Kijun-Sen (blue line above red line) Price closes above both Tenkan-Sen and Kijun-Sen (price closes above both blue and red lines) Tenkan-Sen and Kijun-Sen is above Senkou Span (both blue and red lines are above cloud) Senkou Span is green (cloud is green) Price pulled back and closed below both...

Count:472
Name: ck - CryptoSniper Longs Only (Strategy) (Open Source)
Description: Republished to share code source.

Count:471
Name: SB_CM_MacD_Ult_MTF
Description: This strategy places the order based on the MACD signal. Original Indicator: MacD Custom Indicator-Multiple Time Frame+All Available Options! by ChrisMoody Link to the Indicator: If your risk appetite is high you can replace the first statement with the below statement: strategy(title="SB_CM_MacD_Ult_MTF", shorttitle="SB_CM_MacD_Ult_MTF", default_qty_type =...

Count:470
Name: Simple and efficient PSAR swing strategy
Description: This is a strategy build inside tradingview, which I found it works great with swing/position trading. It works based on parabolic sar indicator, when indicator is below the candle, is an uptrend and when its its above is a downtrend. At the same time it's very nice, because it has a sort of stop loss which is dynamic, because it triggers when candle crosses...

Count:468
Name: Super Momentum Strategy
Description: This is a strategy utilizing multiple of Evergets RMI (thanks to him for permission to publish) and a Chance Momentum. It buys when 4 of the RMIs are below their thresholds and sells when they are above. There is a 5th one I added last night that works in Reverse - buy when its above and sell when below, which should work better for pyramiding strats by using it...

Count:468
Name: Customizable Non-Repainting HTF MACD MFI Scalper Bot Strategy
Description: This script was originally shared by Wunderbit as a free open source script for the community to work with. WHAT THIS SCRIPT DOES: It is intended for use on an algorithmic bot trading platform but can be used for scalping and manual trading. This strategy is based on the trend-following momentum indicator . It includes the Money Flow index as an additional...

Count:468
Name: ANN RSI SUPER TREND STRATEGY BY che_trader
Description: Create a strategy for the good indicator created by @RafaelZioni Which is composed of ANN data taken from and the super trend shared by www.tradingview.com Feel free to share and copy this script! Enjoy!

Count:467
Name: Parabolic SAR Strategy with Bactesting Range
Description: Standard Parabolic SAR Strategy with SAR level plotted and backtesting range option.

Count:465
Name: Turtle Trend Trading System [racer8]
Description: This is the Turtle traders' actual system which uses a 55 period channel for entries & a 20 period channel for exits. Enjoy ;)

Count:464
Name: Momentum Strategy
Description: This strategy uses momentum to determine when to enter and exit positions. The default settings are set to look for a new 63 day high (~1 trading quarter) and a new 40 day relative high. If the stock is trending above the 50 day moving average it is a candidate to be bought. Stops are triggered when price closes below the 20 day or 50 day EMAs depending on how...

Count:464
Name: ONLY LONG V4 v1
Description: this is based on I just change the way to find lows as the strategy based on exit by % and pyramiding if you will play with % you will see that higher % exit like in this example of 20% make it to gain more profit (mainly due to pyramiding in the strategy ) in realistic strategy you will exit by much lower % out unless you are bot:) to convert it to study with...

Count:464
Name: Risk to Reward - FIXED SL Backtester
Description: Don't know how to code? No problem! TradingView is an excellent platform for you. ✅ ✅ If you have an indicator that you want to backtest using a risk-to-reward ratio or fixed take profit/stop loss levels, then the Risk to Reward - FIXED SL Backtester script is the perfect solution for you. introducing Risk to Reward - FIXED SL Backtester Script which will...

Count:463
Name: Updated Turtles
Description: This script has been updated to prevent double orders (short/long) from occurring and modifying backtests results. This is an update to the script that was written a few years ago to prevent double longs/shorts from occurring and skewin backtesting results. Check out the updated indicator here and let me know what you think. I also added: - date range inputs if...

Count:462
Name: Swing/Daytrading strategy with reversal option
Description: Hello, today I bring a swing reversal strategy that work on all financial markets. It uses timeframes starting from 1h, the bigger the better. Its very dangerous because it has no stop loss, neither a take profit. Our exit condition is based on the reversal on the entry . For entry we have 2 types : normal and reversal Lets say we want to go long , for that we...

Count:462
Name: ATR_RSI_Strategy v2 with no repaint [liwei666]
Description: 🎲 Overview 🎯 this is a optimized version based on ATR_RSI_Strategy with no-repaint. Sharpe ratio: 1.4, trade times: 116 , trade symbol: BINANCE:BTCUSDTPERP 15M you can get same backtesting result with the correct settings. 🎲 Strategy Logic 🎯 the core logic is quite simple, use ATR and RSI and SMA 1. when price is in high volatility ( atr_value > atr_ma); 2....

Count:460
Name: TICK strategy for SPY options
Description: Important notes: 1. This strategy is designed for same day SPY option scalping. All profit shown in back testing report is based on Profit/Loss (P/L) estimates from trading options with approximately 6 months of data. By default, it is set to 10 option contracts. By default the initial capital is set to $5000. Pyramiding is set to 3. 2. This strategy works better...

Count:459
Name: open>open[1]=BUY_else_SELL
Description: simple script. enter rule is open>open =BUY_else_SELL (open means open price 1 candle ago, so basically its if price now greater than price 1 candle ago...) exit rule is Trailing Stop. 1 trade per candle, here on daily chart BTCUSDT with binance commision included in result. 254 million percent profit.... 😲

Count:459
Name: MACD/EMA/SMA/Ichimoku Confluence Strategy
Description: This strategy uses a number of chart indicators to provide a Bullish/Bearish signal. Using a combination of the 200 SMA, the 20 EMA, the MACD and the Ichimoku cloud, the strategy logic will adjust the amount of confluence required between the indicators depending on how bullish or bearish the chart is looking. The logic looks for the following: - Are we above or...

Count:457
Name: RENKO strategy
Description: Standard simple strategy RENKO. Entry on the first reversing bar. No repaints. Caution arrows when price crossing RENKO levels

Count:457
Name: No Nonsense NNFX VP Strategy for Back Testing 3 x Indicators| jh
Description: After testing your individual indicators, it's time to build up your algo with additional indicators and further backtest the strategy. Using SSL twice here, faster SSL for 1st confirmation, slower SSL for 2nd confirmation and TDFI for volume validation.

Count:456
Name: HatiKO Envelopes
Description: Published source code is subject to the terms of the GNU Affero General Public License v3.0 This script describes and provides backtesting functionality to internal strategy of algorithmic crypto trading software "HatiKO bot". Suitable for backtesting any Cryptocurrency Pair on any Exchange/Platform, any Timeframe. Core Mechanics of this strategy are based on...

Count:455
Name: VuManChu Cipher B + Divergences Strategy
Description: A Strategy using VuManChu Cipher B + Divergences for backtesting purpose.

Count:452
Name: Bilateral Stochastic Oscillator Strategy
Description: Introduction Strategy based on the bilateral stochastic oscillator, this oscillator aim to detect trends and possible reversal points of the current trend. The oscillator is composed of 1 bull line in blue and 1 bear line in red as well as a signal line in orange, the strategy have many options such as two different strategy framework and a martingale mode. If...

Count:452
Name: BitCoin Simple Buyer
Description: Many people asking me: How to find the right time to exit BitCoin long position? First, that comes to mind is Do Not use simple Buy-and-Hold strategy, but make short-term trades. Here is the simple algorithm for D1 or 4H timeframes.

Count:451
Name: Ranged Volume Strategy - evo
Description: This is the strategy version for the ranged volume indicator I published a few days ago. Long : First yellow break-out after red Short : First red break-out after yellow Because this is volume, you want to be using this on an exchange with high volume for the best results. Default settings are not optimized but work great on bitcoins daily chart. A short...

Count:451
Name: RSI Classic Strategy (by Coinrule)
Description: One of the questions hobbyist traders more often ask is: what is the perfect trading indicator? Every indicator is just a tool, so its efficiency is proportional to your ability to read its signals and translate them into an actionable trading strategy. The RSI is likely the most flexible and easy to use among the technical indicators. This trading strategy...

Count:450
Name: Tendency EMA + RSI [Alorse]
Description: A very simple and highly effective strategy LONG & SHORT that combines only 2 indicators: RSI 3 Moving Average Exponential (EMA) LONG Entry conditions are: EMA 20 cross over EMA 10 EMA 10 is above EMA 100 LONG Exit conditions are: RSI greater than 70 Or when X number of candles have passed and the trade is in profit. (Check Settings) ...

Count:449
Name: Simple Fibonacci EMA Strategy
Description: This script gives a buy signal when the 21 EMA crosses above the 55 EMA and a sell signal when the 55 EMA crosses below the 21 EMA. This strategy works well for cryptocurrencies at all time frames. However, it does not work for stocks or forex. Sometimes, the simple strategies are the best strategies, especially in markets that have not been dominated by...


Count:448
Name: Coral Trend Pullback Strategy (TradeIQ)
Description: Description: Strategy is taken from the TradeIQ YouTube video called "I Finally Found 80% Win Rate Trading Strategy For Crypto". Check out the full video for further details/clarification on strategy entry/exit conditions. The default settings are exactly as TradeIQ described in his video. However I found some better results by some tweaking settings,...

Count:448
Name: 3Commas Bot DCA Backtester & Signals FREE
Description: This is a DCA Strategy backtester + signals, built to emulate the 3Commas DCA bots. It uses your choice of 4 different buy signals, 2 of which can be adjusted in the settings. Everything is customizable so you can backtest specific settings with different buy signals and find the best performing strategy for your risk tolerance and capital. It can be used to...

Count:448
Name: MTF MACD 2 By Yuthavithi
Description: If you want a good strategy without repaint. This one might be for you. Excellent profitable for BTCUSD3M for OKCoin. It uses multiple time frame MACD for trading decision. To avoid repaint, set the delay period = 1 for both long term and midterm. The idea is that, if long term, mid term and current time frame all agree on traidng direction, the trade will...

Count:447
Name: BTC and ETH Long strategy - version 2
Description: I wrote my first article in May 2020. See below BTC and ETH Long strategy - version1 After 6 months, it is now time to check the result of my script for the last 6 months. XBTUSD (4H): 14/05/2020 --> 22/11/2020 = +78% in 4 trades ETHXBT (4H): 14/05/2020 --> 22/11/2020 = +21% in 9 trades ETHUSD (4H): 14/05/2020 --> 22/11/2020 = +90% in 6 trades Using the...

Count:447
Name: robotrading body
Description: This is a very simple and universal strategy. Good for crypto. For BTC/USD, shitcoin/BTC. Strategy Long positions only. If the candle is falling and the candle body is 3 or more times the average candle body, then open a long position. If the candle is rising, we should close a long position. Short positions are not used. This is a counter-trend strategy. The...

Count:447
Name: (IK) Base Break Buy
Description: This strategy first calculates areas of support (bases), and then enters trades if that support is broken. The idea is to profit off of retracement. Dollar-cost-averaging safety orders are key here. This strategy takes into account a .1% commission, and tests are done with an initial capital of 100.00 USD. This only goes long. The strategy is highly customizable....

Count:446
Name: Bollinger Band Breakout
Description: This strategy buys when price crosses above an upper Bollinger Band and sells when the lower band is breached. What makes this strategy different than others: Long only with filtering for only showing strong tickers Filter out trades below a moving average on both the current timeframe and a longer period timeframe to keep you out of bear markets Optional...

Count:446
Name: Scaled Normalized Vector Strategy
Description: This is a scaled Normalized Vector Strategy with a Karobein Oscillator Original: Drkhodakarami (www.tradingview.com) Repainting: in general there two types of repainting: * when the last candle is constantly being redrawn * when the indicator draws a different configuration after it has been deactivated/reactivated, i.e. refreshed. The former is a natural...

Count:446
Name: Williams Fractals Strategy
Description: This indicator made with using Williams Fractals, 20 50 100 Moving Averages and Relative Strength Index. You can easily find entry points by using Long (L), Short (S) signals. Note : Settings are optimized for BTC:USDT Perpetual 15min TF. For use different pairs or TFs you may need to change settings.

Count:446
Name: Noro's Trend MAs Strategy v1.9 Extreme
Description: Extreme version of Noro's Trend MAs strategy. Don't use on pairs of type "crypto/crypto"! Only for pairs like "crypto/fiat" ("BTC/USD", "BTC/CNY", "ETH/USD", "ETH/CNY", etc) Trade strategy which uses only 2 MA. The slow MA (blue) is used for definition of a trend The fast MA (red) is used for an entrance to the transaction For: - For H1 - For...

Count:445
Name: MA Cross - ***Programmers*** Please help with alertcondition()
Description: Hello Traders and coders, Here is a fundamental version of a moving average cross trading strategy that works on 1H and 4H timeframes. It's very simple and would be well paired with proper technical analysis and risk management. I am looking to use this to alert me of potential setups. I could not get the alertcondition function to work properly. If anyone can...

Count:444
Name: EA_Binary Option Spfrat Strategy
Description: This somehow my Phase 1 of Clean EA on Binary Option using Spyfrat Idea and with Help Trading View Community. Timeframe = 1 minute Strategy: (Momentum) 1) BB 50 0.2 2) RSI (30) 3) Time Squeeze - to somehow disregard consolditation

Count:444
Name: Single SMA cross with BB Strategy
Description: This is a light weight code and strategy. I tuned it for NZDUSD on a 15 min chart. NZDUSD is a slow moving low volatility pair. A single SMA cross over + crossing a .9 BB + the single SMA is increasing. I will be manually trading this with alerts and once I have LUA down I will set it free with FXCM and see what it can do on it own. ** I use BB as a means of...

Count:444
Name: robotrading body-limit
Description: This is a very simple and universal strategy. Good for crypto. For BTC/USD, shitcoin/BTC . Strategy Long positions only. If the candle is falling and the candle body is 3 or more times the average candle body, then open a long position by limit order. If the candle is rising, we should close a long position. Short positions are not used. This is a...

Count:443
Name: Donchian Channel Strategy
Description: Ride the trend with full potential. Filter out false signals using long period ema. Lower bands take care of the stop loss. Use this strategy for banknifty futures for consistent quarterly returns.

Count:441
Name: Simple way to BEAT the market [STRATEGY]
Description: This script has been created to demonstrate the effectiveness of using market regime filters in your trading strategy, and how they can improve your returns and lower your drawdowns This strategy adds a simple filter (A historical volatility percentile filter, an implementation of which can be found on my trading profile) to a traditional buy and hold strategy of...

Count:440
Name: BitMEX pump catcher - MACD
Description: This is a modified version of the BitMEX pump catcher by Jomy . I have tweaked the algorithm to use the difference in MACD to get the correct direction of entries rather than using direction of candles which are not always indicative of trend direction. These changes increase net profit, profitable trades, while reducing drawdown. Below is a copy and paste...

Count:440
Name: Squeeze Backtest by Shaqi v1.0
Description: The script is for backtesting price gap's with a determined bind to the previous bar.

Count:440
Name: Automated - Fibs with Market orders
Description: This script was recently shared for limit only orders here: This version does not worry about keeping orders in the books and moving them around, instead it will simply market in and out. I am sharing this to reveal the difference between the 2 setups.

Count:439
Name: Triple Threat
Description: This indicator provides buy and sell signals for Bitcoin based on confluence from well-known momentum, volatility, and trend indicators. It has successfully captured the major directional trends on Bitcoin's daily chart since 2018, and the settings are currently optimized for this chart in particular. This indicator implements RSI to gauge momentum, BBWP to gauge...

Count:438
Name: Moving Average Cross Strategy
Description: Simply define your fast and slow M then backtest the strategy. *First script, work in progress. Will allow you to combine two TV indicators into one.

Count:435
Name: Ichimoku EMA RSI - Crypto only long Strategy
Description: Hey there! Here I show you an Ichimoku Cloud Strategy. I discovered the strategy on a YouTube channel and tried to transfer it as a strategy into a script. He said in his video that you would make more profit with this strategy than holding the coin. Tested with the crypto pair ETH/USDT in the four hour chart. Period: beginning of 2017 until today. The...

Count:435
Name: Scripting Tutorial B - TManyMA - Commission/Fees
Description: This script is for a triple moving average strategy where the user can select from different types of moving averages, price sources, lookback periods and resolutions. Features: - 3 Moving Averages with variable MA types, periods, price sources, resolutions and the ability to disable each individually. - Crossovers are plotted on the chart with detailed...

Count:433
Name: Bollinger Bands strategy with RSI and MACD v1.0
Description: This is a strategy based on the Bollinger Bands, where buy trades are made when the price crosses the lower line of the Bollinger Bands upwards, and sell trades are made when the price crosses the upper line downwards. In addition, it is possible through the inputs to enable trading with RSI and MACD, so that buy or sell trades are supported by these two...


Count:432
Name: CCI & EMA strategy by Tradeswithashish
Description: This strategy is extremely useful for positional traders or traders using timeframe 15-minute of higher. It uses following combo of values: VWAP, CCI, Volume and Moving average (simple and exponential) Caution: Avoid taking trade if candle size is greater than twice the average candle size. for that wait for the retracement to near trailing stoploss

Count:432
Name: 5min Williams Fractals scalping (3commas)
Description: Another strategy I'm learning Pine Script on. It is inspired by a MoneyZG youtube strategy called "Easy 5 Minute Scalping Strategy (Simple to Follow Scalping Trading Strategy)". Again this is a one order per trade strategy compatible with the 3commas bot (works also with the free 3commas subscription). This strategy is based on the signals from Williams Fractals,...

Count:432
Name: Average True Range Reversed Strategy
Description: Average True Range Trailing Stops Strategy, by Sylvain Vervoort The related article is copyrighted material from Stocks & Commodities Jun 2009 Please, use it only for learning or paper trading. Do not for real trading.

Count:432
Name: Ruckard TradingLatino
Description: This strategy tries to mimic TradingLatino strategy. The current implementation is beta. Si hablas castellano o espanyol por favor consulta MENSAJE EN CASTELLANO más abajo. It's aimed at BTCUSDT pair and 4h timeframe. STRATEGY DEFAULT SETTINGS EXPLANATION max_bars_back=5000 : This is a random number of bars so that the strategy test lasts for one or two...

Count:430
Name: Supertrend + RSI Strategy [Alose]
Description: This strategy combines the best of both indicators (Supertrend & RSI). As we know, Supertrend is excellent at finding changes in the market trend and thus finding the best entries, however in my opinion it has a great weakness and it is that it does not know how to find the best exit point. For this reason I decided to combine it with the RSI that we know...

Count:430
Name: Decent Martingale Strategy [Pinescript v3]
Description: In my experimentation to add some sort of hedging to trades, I stumbled on the Martingale roulette betting strategy. If it works in the casino, why not here? The principle is simple: If you lose a trade, immediately go the opposite direction and double your bet. In this case, we're just applying a multiplier. The strategy is a simple EMA crossover - defaulted...

Count:429
Name: Full Forex scalper Strategy
Description: THis is a FOREX scalping system that can be optimized with almost all majors and crosses pairs. Its made of multiple elements such as : MACD Stochastic RSI Fast VW moving average Slow VW moving average Time management( forex sessions as inputs) Rules for entry Long Last 2 MACD values were ascending, fast moving average is below moving average and stochastic RSI...

Count:428
Name: Combo Backtest 123 Reversal & Dynamo
Description: This is combo strategies for get a cumulative signal. First strategy This System was created from the Book "How I Tripled My Money In The Futures Market" by Ulf Jensen, Page 183. This is reverse type of strategies. The strategy buys at market, if close price is higher than the previous close during 2 days and the meaning of 9-days Stochastic Slow...

Count:426
Name: Andean Scalping
Description: Andean Scalping Implementation - BETA - Uses Andean Oscillator: alpaca.markets - Implements a threshold moving average (SMA 1000) on the Andean Signal line at 1.1 factor to filter out small moves - TP/SL using ATR bands at 3x multiplier

Count:425
Name: robotrading trendweek
Description: The blue line is the closing price of the week. Strategy If the price is above the blue line - this is uptrend. If the price is below the blue line - it is downtrend. If the low candlestick is above the line - you should open a long position (and close a short position, if open). If the high candle is below the line - you should open a short position (and...

Count:425
Name: ADX strategy (considering ADX and +DI only )
Description: I have been checking the strategies on ADX indicator. I have found that +DI crossing above ADX line under threshold 30 and exit on crossdown when ADX above 30 has better results than just following crossovers of +DI and -DI , ADX crossing above 30 . BUY Rule ======== fast ema is above slow ema (default 13 and 55 , you can change these values...

Count:424
Name: Strategy Myth-Busting #12 - OSGFC+SuperTrend - [MYN]
Description: This is part of a new series we are calling "Strategy Myth-Busting" where we take open public manual trading strategies and automate them. The goal is to not only validate the authenticity of the claims but to provide an automated version for traders who wish to trade autonomously. Our 12th one is an automated version of the "The Most Powerful Tradingview Buy...

Count:424
Name: Monthly Returns with Benchmark
Description: I keep working on trying to make TradingView strategies look fancier. A few months ago I published the first version of the Monthly Returns for Strategies in Pine Script. I received quite a lot of good feedback and quite a lot of requests to update it. This is a more advanced version of the Monthly Returns, in it, you can: Display monthly returns of your...

Count:424
Name: Channel Break Out Binary Strategy
Description: I am learning pine script at the moment and this is my first attempt at creating an expire time based strategy for binary options based on a simple example like the built-in Channel Break Out Strategy.

Count:423
Name: Darvas Box Strategy
Description: What Is the Darvas Box? The Darvas Box strategy was developed by Nicholas Darvas. Aside from being a well known dancer, he began trading stock in the 1950s. Based on his success in trading, he was approached to write a book on his strategy. The book, “How I Made $2,000,000 in the Stock Market,” outlines his rather simple approach … simple once you understand the...

Count:423
Name: Patient Trendfollower (7)(alpha) Backtesting Algorithm
Description: This is an alpha version of backtesting algorithm for my Patient Trendfollower (7) strategy. It can help you adapt the indicator to other charts than EURUSD. Please bear in mind that price action, volume profiles and supzistences are a catalyst for successful trading, not an indicator. You can get significantly better results if you use these things in your...

Count:420
Name: SuperTrend Multi Time Frame Long and Short Trading Strategy
Description: Hello All This is non-repainting Supertrend Multi Time Frame script, I got so many request on Supertrend with Multi Time Frame. This is for all of them ..I am making it open for all so you can change its coding according to your need. How the Basic Indicator works SuperTrend is one of the most common ATR based trailing stop indicators. In this version...

Count:420
Name: Scalping using RSI 2 indicator with TSL
Description: This strategy implements a simply scalping using the RSI (calculated on two periods), the slopes of two MAs ( EMA or SMA ) having different lengths (by default, I use 50 and 200). A trailing stop loss (%) is used. Entry conditions: .) Fast MA > Slow MA and Price > Slow MA and RSI < Oversold Threshold ------> go Long .) Fast MA < Slow MA and Price < Slow MA...

Count:419
Name: multiple orders - strategy - educational
Description: Hi, Here is a 'template', using array's, for multiple orders and different SL/TP levels per trade (This is an example with max 5 open trades) The 'switch' makes sure that the first available position will be used, for example, when 'L1' is closed in the past, and a buy condition is triggered, position 'L1' will be filled, should it be that 'L1', 'L2', 'L3' are...


Count:419
Name: Strategy Hull Bollinger
Description: This is the strategy of the Bollinger and Hull cross each other no repaint as no mtf or security the issue here is to make allot of buy and sell with high % of win

Count:419
Name: BEST Strategy Template w/ Custom SL/TP Size - Educational
Description: Hello traders I'm getting this question at least once per week: "how to define a custom exit quantity for my stop loss and a different one for my take profit" Instead of answering every day the same question in my DMs, I've decided to publish an educational strategy template script using this Features - Select to use or not the SL and/or TP - Define how many...

Count:418
Name: WMX Williams Fractals strategy V4
Description: There are some magic numbers out there! Guys, Check this out! if you like it please support me with a like or leave your comments below

Count:418
Name: Combo Backtest 123 Reversal & Market Facilitation Index
Description: This is combo strategies for get a cumulative signal. First strategy This System was created from the Book "How I Tripled My Money In The Futures Market" by Ulf Jensen, Page 183. This is reverse type of strategies. The strategy buys at market, if close price is higher than the previous close during 2 days and the meaning of 9-days Stochastic Slow...

Count:417
Name: RSI Alligator Strategy
Description: Hello trading family! Just wanted to give a quick write up and share the new code for the RSI Alligator Strategy. I amended it to show every crossover signal, weak and strong, so we can accurately gauge its effectiveness. Having played with this for a couple hours now I have learned a few things -Using Heikin Ashi seems to smooth it out a bit and provides about...

Count:415
Name: Multi MA MTF SandBox Strategy
Description: A moving averages SandBox strategy where you can experiment using two different moving averages (like KAMA, ALMA, HMA, JMA, VAMA and more) on different time frames to generate BUY and SELL signals, when they cross. Great sandbox for experimenting with different moving averages and different time frames. == How to use == We select two types of moving averages on...

Count:415
Name: Strategy Myth-Busting #10 - InsideBar+EMA - [MYN]
Description: This is part of a new series we are calling "Strategy Myth-Busting" where we take open public manual trading strategies and automate them. The goal is to not only validate the authenticity of the claims but to provide an automated version for traders who wish to trade autonomously. Our 10th one we are automating is the " 75% Win Rate High Profit Inside Bar...

Count:412
Name: Simple Price Momentum - How To Create A Simple Trading Strategy
Description: This script was built using a logical approach to trading systems. All the details can be found in a step by step guide below. I hope you enjoy it. I am really glad to be part of this community. Thank you all. I hope you not only succeed on your trading career but also enjoy it. docs.google.com

Count:412
Name: Advanced VWAP_Pullback Strategy_Trend-Template Qualifier
Description: General Description and Unique Features of this Script Introducing the Advanced VWAP Momentum-Pullback Strategy (long-only) that offers several unique features: 1. Our script/strategy utilizes Mark Minervini's Trend-Template as a qualifier for identifying stocks and other financial securities in confirmed uptrends. Mark Minervini, a 2x US Investment Champion,...

Count:411
Name: QuantCat Chande Swinger Strategy
Description: QuantCat Chande Swinger This strategy is designed to be used on the 1 minute with mainly bitcoin, and cryptocurrencies. But parameters can be adjusted to ANY pair. After some long research about chande momentum oscillator, I decided to create a strategy using normal distribution percentage levels to snipe entries. This in turn on the 1 minute can create a nice...

Count:410
Name: Multi Moving Average Crossing (by Coinrule)
Description: Moving Averages are among the most common trading indicators. They are straightforward to interpret and effective to use. One of the limitations of using moving averages is they can provide buy and sell signals with a relatively high lag , making it very difficult to spot the lows and tops of the trend. Moving averages calculated with a low number of periods...

Count:410
Name: BTC and ETH Long strategy - version 1
Description: I will start with a small introduction about myself. I'm now trading cryto currencies manually for almost 2 years. I decided to start after watching a documentary on the TV showing people who made big money during the Bitcoin pump which happened at the end of 2017. The next day, I asked myself "Why should I not give it a try and learn how to trade". This was in...

Count:409
Name: SSL + Wave Trend Strategy
Description: Strategy incorporates the following features: Risk management: Configurable X% loss per stop loss Configurable R:R ratio Trade entry: Based on strategy conditions below Trade exit: Based on strategy conditions below Backtesting: Configurable backtesting range by date Trade drawings: Each entry condition indicator can be...

Count:409
Name: Inverse Fisher RSI-MTF2
Description: I wish this results were true . but it seems to be nice

Count:409
Name: SuperTrend Trapping Candle Strategy
Description: Hello traders! How this indicator works? The main functionality of this indicator is to find entry based upon SuperTrend indicator. This indicator helps us to find trapping candle to enter into the market. What is a trapping candle? A trapping candle is a candle that shows strength in opposite direction to SuperTrend. This helps us to enter in a trade before...

Count:407
Name: Simple and efficient swing RSI system
Description: Hello there, I am glad to bring you another simple and efficient algorithm. Its made purely from RSI which can be used directly or inversed. Its suited for swing trading 15 min chart or more minimum. Can be adapted to all types of financial markets. Rules for entry are easy : First we have the stop loss and take profits levels. Based on SL , we have the risk %...

Count:407
Name: RSI Mean Reversion Bot Strategy
Description: I started developing this strategy as a way to plug in and test values before defining them in the bots on 3Commas, Coinrule, and Quadency. None of those bots performed the same way my script did and I kept working on it until the strategy finally yielded the same simulated results when paired with the Tradingview bot on Quadency. I looked at all the different RSI...

Count:407
Name: Buy&Sell Bullish Engulfing - The Quant Science
Description: 🇺🇸 GENERAL OVERVIEW Buy&Sell Bullish Engulfing - The Quant Science It is a Buy&Sell strategy based on the 'Bullish Engulfing' candlestick pattern. The main goal of the strategy is to achieve a consistent and sustainable return over time, with a manageable level of risk. Bullish Engulfing The template was developed at the top of the Indicator provided by...

Count:406
Name: Decision Threshold
Description: // Hull_MA_cross & Daily_Candle_cross combination with TP$ & SL$ setting // the theory is that SL$ can be reduced to low amount, to show actual trading results (reducing effect of repaint on results)

Count:405
Name: Kijun-Sen Strategy [DasanC]
Description: This strategy employs the Kijun-Sen line (from Ichimoku cloud) as a baseline for decisions. In essence, the Kijun-Sen is a kind of moving average based on the High/Low range, similar to Donchian channels. We wait for a crossover or crossunder to enter a new trade, then exit upon the next cross. It works on 1H timeframe and above. It also works for all the Major...

Count:405
Name: Mean-Reversion Swing Trading Strategy v1
Description: A port of the TradeStation EasyLanguage code for a mean-revision strategy described at traders.com "In “Mean-Reversion Swing Trading,” which appeared in the December 2016 issue of STOCKS & COMMODITIES, author Ken Calhoun describes a trading methodology where the trader attempts to enter an existing trend after there has been a pullback. He suggests looking...

Count:404
Name: JD Aggressive Sequential Setup [NeoButane]
Description: Difference vs. TD Sequential: faster trade exits and a unique entry. Made for low timeframes. Highs or lows are compared instead of close. Count maxes out at 7 instead of 9. Version 1.0 does it like this: S/R on 7 count Entry on 7 count Exit on 5 count or S/R cross Not based off official Tom DeMarke documentation for Aggressive. As such, I have named the...

Count:403
Name: SupterTrend
Description: I created this script for basically two reasons 1. there is not simple suptertrend indicator available on tv rather you will find many fancy suptrend indicators with confusing other indicators and absurd background colors i dont know why some of the trader coders are obsessed with is using over the top color and designing phenomena. 2. I want to let people...

Count:402
Name: ABCD Strategy
Description: One from many harmonic pattern that consists of two equivalent price legs. The ABCD pattern that helps traders predict when the price is about to change direction. Tracing And Calculation This code using pivot high and pivot low built-in method and calculate with Fibonacci Retracement. Limitation To find ABCD pattern is very difficult, just coming up a few...

Count:402
Name: QuarryLake v4
Description: As some of you requested, I will make the code for QuarryLake Open for you all. I have also updated the script in version 4. This strategy consists of 3 indicators that I found works quite well together. Keltner Channel, Waddah Attah Explosion, and Volatility Stop . KC Period = 200 KCATR = 5 Vstop Period = 3 Vstop Mult = 1.5 Long when close > KC, close >...


Count:401
Name: Line Break Strategy
Description: Line Break Strategy Entry rule: Long on a bullish line and short on a bearish line. Backtest: Profit factors are shown below for three-line break. Daily time frame, FXCM broker. EURUSD: 1.267, USDJPY: 1.039, GBPUSD: -0.816, AUDUSD: -0.959 S&P500: -0.783, Nikkei225: 1.099 CrudeOil: 1.03, Gold: 1.196 BTCUSD: -0.883 Reference: Steve Nison,...

Count:401
Name: Super Auto Breakout Day Trade Volatile stocks
Description: This strategy is looking at MA and distance from MA to determine entry and exit for highly volatile day trade stocks. This trading strategy is not good for big-cap stocks as the movement there is not much in terms of %. The target for open trade is to close at a 10% gain or at 2.8% loss which is a good risk to reward ratio.

Count:400
Name: Combo Backtest 123 Reversal & MACD Crossover
Description: This is combo strategies for get a cumulative signal. First strategy This System was created from the Book "How I Tripled My Money In The Futures Market" by Ulf Jensen, Page 183. This is reverse type of strategies. The strategy buys at market, if close price is higher than the previous close during 2 days and the meaning of 9-days Stochastic Slow...

Count:399
Name: volume spread analysis
Description: volume spread analysis volume spread analysis volume spread analysis

Count:399
Name: ATR and T3 strategy
Description: T3 Moving Average indicator was originally developed by Tim Tillson in 1998/99. T3 Moving Average is considered as improved and better to traditional moving averages as it is smoother and performs better in trending market conditions. It offers multiple opportunities when the price is in the state of retracement and therefore allows to minimize your exposed risk...

Count:399
Name: HiLo
Description: Hi Everyone, Do you guys know how can I add an exit strategy to this hilo. I would like it to exit either with hilo invertion (already does) or with profit/loss (it doesn't work) Thank you

Count:399
Name: Investments/swing trading strategy for different assets
Description: Stop worrying about catching the lowest price, it's almost impossible!: with this trend-following strategy and protection from bearish phases, you will know how to enter the market properly to obtain benefits in the long term. Backtesting context: 1899-11-01 to 2023-02-16 of SPX by Tvc. Commissions: 0.05% for each entry, 0.05% for each exit. Risk per trade:...

Count:397
Name: Rob Booker - ADX Breakout updated to pinescript V5
Description: Rob Booker - ADX Breakout. The strategy remains unchanged but the code has been updated to pinescript V5. This enables compatibility with all new Tradingview features. Additonally, indicators have been made more easily visible, default cash settings as well as input descriptions have been added. Rob Booker - ADX Breakout: (Directly taken from the official...

Count:397
Name: Follow The Ranging Hull
Description: This is a scalping strategy, trying to make quick points based on momentum and trend trading. Entry Points are when either the range filter or the the following line changes colour. And the Hull is in that same direction. --The Strategy Only enters on range filter entry point for now. This Strategy has been tested on the NASDAQ 1 min, And works best with low...


Count:396
Name: Simple Moon Phases Strategy
Description: Simple Moon Phases Strategy This strategy is very basic and needs some filters to improve results. It was created to test the Moon Phase theory compared to just a buy and hold strategy and it did not beat the buy and hold. However, if you flip the entry and exit signals to the opposite signals it performs a lot worse, so there might be some validity to the Moon...

Count:396
Name: HMA+CCI strategy v0.1
Description: Simple HMA (Hull MA) and CCI based strategy. Currency: USD/GBP, USD/JPY, GBP/JPY Timeframe: 15min Backtest Result: USDJPY 15min: profit every month from 03/2018 to 07/2018 GBPUSD 15min: profit every month from 03/2018 to 07/2018 GBPJPY 15min: loss on 03/2018, profit every month from 04/2018 (It's beta version!) I'm also developing Indicator version, so please...
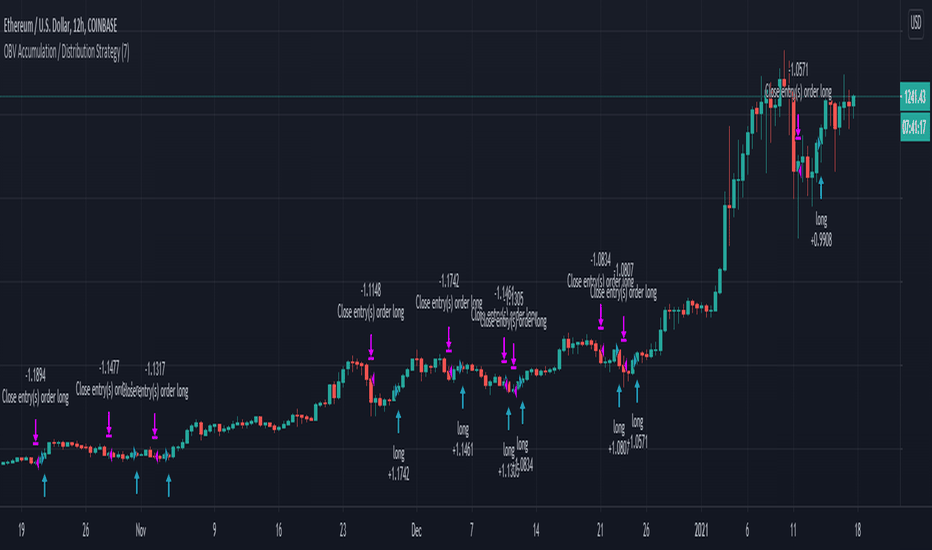
Count:396
Name: OBV Accumulation / Distribution Strategy Crypto
Description: This version its made for 8-12h and works amazingly on the ETH pairs. Can be adapted to others as well For this example, I used an initial 1$ account, using always full capital on each trade(without using any leverage), together with a 0.1% commission/fees for each deal, on Coinbase broker. This is a long only strategy The components for the inside of the...

Count:396
Name: No Nonsense NNFX VP Strategy for Back Testing Baseline | jh
Description: Strategy for the NNFX Baseline Script - Moving Averages Does not enter when price is > 1 ATR away. Adapted the "Many Moving Averages" script to VP's NNFX No Nonsense Forex method. Includes: - ATR bands and labels - Price is > 1 ATR away from baseline indication Available MAs "ALMA", "EMA", "DEMA", "TEMA", "WMA", "VWMA", "SMA", "SMMA", "HMA", "Kijun", "McGinley"

Count:395
Name: Noro's RiskDonchian Strategy
Description: The strategy uses Donchian price channel . The channel is shown in blue lines. All other lines use Donchian channel too. The red line is the center line between the channel lines. The lime line is a few percent further away. The percentage is set by the user in the strategy settings. Lines Blue line - to open position using market stop order Lime line -...

Count:395
Name: [tradinghook] - Renko Trend Reversal Strategy
Description: - Renko Trend Reversal Strategy Short Title: - Renko TRS Description: The Renko Trend Reversal Strategy ( - Renko TRS) is a powerful and original trading approach designed to identify trend reversals in financial markets using Renko charts. Renko charts differ from traditional time-based charts, as they focus solely on price movements and ignore time,...

Count:393
Name: Pure Morning 2.0 - Candlestick Pattern Doji Strategy
Description: The new "Pure Morning 2.0 - Candlestick Pattern Doji Strategy" is a trend-following, intraday cryptocurrency trading system authored by devil_machine. The system identifies Doji and Morning Doji Star candlestick formations above the EMA60 as entry points for long trades. For best results we recommend to use on 15-minute, 30-minute, or 1-hour timeframes, and are...

Count:393
Name: PSAR + EMA/TEMA/RSI/OBV
Description: The Parabolic Stop-and-Reservse (PSAR) is a trend indicator, intended to capture reversal signals and show entry and exit points. The PSAR is bullish when the PSAR is below the candle body (usually indicated by a dot) and bearish when the PSAR is above the candle body. The PSAR generally only moves in the direction of the trend, making it useful for markets with...

Count:393
Name: Bollinger Bands And Aroon Scalping (by Coinrule)
Description: Many technical indicators can be profitable in certain market conditions while failing in others. No indicator is perfect alone. All the best trading strategies involve multiple indicators and leverage the benefit of each of them. The following is an optimised strategy based on Bollinger Bands and the Aroon indicator. The Bollinger Bands are among the most...

Count:393
Name: Ichimoku Cloud with RSI (By Coinrule)
Description: The Ichimoku Cloud is a collection of technical indicators that show support and resistance levels, as well as momentum and trend direction. It does this by taking multiple averages and plotting them on a chart. It also uses these figures to compute a “cloud” that attempts to forecast where the price may find support or resistance in the future. The Ichimoku...

Count:392
Name: Donchian Channel Strategy
Description: Long and Short entries based on the Donchian Channel indicator. The entry can be set to Higher High/Lower Low or the basis line.

Count:392
Name: iMoku (Ichimoku Complete Tool) - The Quant Science
Description: iMoku™ is a professional all-in-one solution for the famous Ichimoku Kinko Hyo indicator. The algorithm includes: 1. Backtesting spot 2. Visual tool 3. Auto-trading functions With iMoku you can test four different strategies. Strategy 1: Cross Tenkan Sen - Kijun Sen A long position is opened with 100% of the invested capital ($1000) when "Tenkan Sen"...

Count:392
Name: VXD Supercycle
Description: VXD is a brand new indicator and still developing. to minimize stop losses and overcome sideways market conditions, Higher Timeframe are recommended Trend lines -using Rolling VWAP as trend line to determined if Volume related to a certain price. -you can switch RVWAP to EMA in the setting ATR -trailing 12*ATR and 2.4 Mutiplier Pivot point and Rejected...

Count:391
Name: Ratings
Description: This strategy script is a modified version of the built-in 'Technical Ratings' strategy script. English: www.tradingview.com Russian: www.tradingview.com Changes: 1) Added option to disable long and short positions (checkboxes 'Long' and 'Short'). 2) Added date selection option. 3) The default commission is 0.1% (original 0%). 4) 100% of capital is used by...

Count:391
Name: TRM Strategy
Description: This is a strategy version of the "True Relative Movement" script: It is virtually identical to the original script, except now you can back test different conditions and parameters. TRM has 3 different conditions:Buy (Blue Bars), Hold/Take Profit (Gray Bars), and Sell (Pink Bars). This script is only coded for Long only condition. It will exit the position...

Count:391
Name: Auto Fib Golden Pocket Band - Strategy with Buy Signals
Description: this strategy is based on the Indicator "Auto Fib Golden Pocket Band - "Autofib Moving Average" it's the same as the indicator but with: - the strategy tester included - several entry Signal filter - Dynamic SL

Count:391
Name: Lancelot vstop intraday trending strategy
Description: Dear all, Free strategy again. I found using 3 volatility stop with different settings could be very helpful when trading an intraday trending market. With the ATR setting or 5, 10, 15, we can weed out many false break. Vstop setting is OHLC4. On the other hand, this strategy also utilize Renko as part of the strategy, so you could say this strategy is...

Count:391
Name: Bollinger Bands + RSI Double Strategy (by SlumdogTrader)
Description: // SlumdogTrader's Bollinger Bands + RSI Double Strategy - Profit Trailer // // Version 1.0 // Script by SlumdogTrader on July Fri 13(!), 2018. // // This strategy uses a normalise Bollinger Bands + RSI. // // Bollinger Band triggers // SELL - when the price is above the upper band. // BUY - when the price is below the lower band. // // RSI triggers // SELL -...

Count:390
Name: [TH] IMF(In Market Forever)
Description: If you want to be in market forever , Set Entry/Profit/Loss in advance. This strategy is a profit and loss strategy indicating P&L Ratio on chart. You can use webhook for auto-trade using my opensource webhook server(TradingHook). Manual add to chart set entry price using mouse click on your chart set profit price using mouse click on your chart ...

Count:390
Name: XAU/USD RSI EMA 1hour strategy
Description: This is a strategy made for gold 1h. Its made of RSI and EMA . The rules are simple we are above ema and the rsi > oversold area we enter long. For short we are belowe ema and rsi < oversold area IF you have any questions private message me !

Count:390
Name: No-lose trading targets (Based on EoRfA) By Mustafa ÖZVER
Description: I simulated the NLTTa_EoRfA indicator with the Bitcoin-USD For details about the indicator, visit my profile on tradingview For Simulation, with default settings, we order When on Long setup and price on green area - open a long position that closes on red area When on Short setup and price on red area - open a short position that closes on green area And we...

Count:390
Name: JS-TechTrading: Supertrend-Strategy_Basic version
Description: Are you looking for a reliable and profitable algorithmic trading strategy for TradingView? If so, you might be interested in our Supertrend basic strategy, which is based on three powerful indicators: Supertrend (ATR), RSI and EMA. Supertrend is a trend-following indicator that helps you identify the direction and strength of the market. It also gives you clear...

Count:390
Name: Strategy RSI Backtest
Description: The RSI is a very popular indicator that follows price activity. It calculates an average of the positive net changes, and an average of the negative net changes in the most recent bars, and it determines the ratio between these averages. The result is expressed as a number between 0 and 100. Commonly it is said that if the RSI has a low value, for...

Count:389
Name: Stoch.RSI+RSI+DoubleStrategy+CMWilliamsVixFix+MFI
Description: //////////////////////////////////////////////////////////////////////////////////////////////////////////////////////////////////////////// //// STOCHASTIC_RSI+RSI+DOUBLE_STRATEGY+CM_WILLIAMS_VIX_FIX+MFI //////// ...


Count:389
Name: Noro's Accuracy Strategy v1.0
Description: Strategy with a piramiding (leverage is necessary) Only long Than the accuracy is more the there are more profitable trades the there are less signals the profit is less For: - any asset (forex, stocks, crypto, etc) - any timeframe Recomended: Accuracy = 1-10 MA period = 100-1000

Count:388
Name: Everyday 0003 _ MAC Pullback
Description: I recently posted a Moving Averge Crossover strategy for my Everyday project - a project I've given myself where I try to create one strategy everyday in between 15 minutes and 2 hours. In the comments of my last published idea, user SignalTradersUK was very kind and suggested I try the following in my next study: "i think your next study should be, to workout...

Count:388
Name: MACD + DMI Scalping with Volatility Stop by (Coinrule)
Description: Trend-following strategies are cool because they allow you to catch potential high returns. The main limit of such strategies are: False signals > the asset is not experiencing a strong trend. The strategy gets stuck with a sideways move or, worst, with the beginning of a downtrend. The sell signal may come later than the actual top, leading in some cases...

Count:388
Name: Super BitMoon v1
Description: Quantitative momentum trading strategy for BTC 12h (long and short).

Count:388
Name: Golden X BF Strategy
Description: This is a Strategy version of my Golden X/Death X indicator. The strategy goes long on a golden cross and short on a death cross. You can change the MA types and periods in settings.

Count:387
Name: RSI of VWAP [SHORT selling]
Description: This is SHORT selling version of RSIofVWAP strategy. Settings and Logic are totally different from LONG side version , hence I am publishing it as a new strategy. Settings ============ VWAP of RSI Length 15 Slow EMA Length 200 Short entry level 25 Cover short level 70 stop loss 5 SHORT Entry ============ condition1 : When RSIofVWAP crossdown below...

Count:387
Name: Nifty & BN 2 Candle Theory Back Testing and Alert Notification
Description: How To Initiate Long Trade-in Index Future/ Buy Call Options – 3 Min TF ▪ If The Index Futures Trades Above The VWAP, the Following Parameters are Checked For 2 Candle Theory on the long side ▪ RSI Trades Above 50 & Between 50-75/80 ▪ Volume Of 2 Consecutive Bars Is Above 50 K for BN & 125 K For Nifty ▪ All the indicators (Parabolic SAR, Super Trend, VMA, VWAP)...

Count:387
Name: SSL Hybrid Strategy
Description: Strategy based on the SSL Hybrid indicator by Mihkel00 Designed for the purpose of back testing Strategy: Enters both long and short trades based on SSL1 crossing the baseline Stop Loss calculated based on ATR multiplier Option to allow moving of Stop Loss to break even on TP1 Option to turn off Stop Loss and Take Profit which will rely on indicator...

Count:386
Name: Low Scanner strategy crypto
Description: This is the last script of the Low scanner series I have shown in script 1 the best strategy for stocks on 1 hour script for forex 1 hour (if you look on comments you will find settings which are perfect for low TF (1 min system ) This strategy is the perfect weapen for crypto no repaint as I shown the scanner do not use security this system will buy and sell...

Count:386
Name: Accurate BUY & SELL 5 mins TF by RR
Description: Always trade using 5 mins Time frame of chart. For Buy entry always buy 1 point above the candle closing price & SL would be previous candle low or 30 points. For Sell Entry Always Sell 1 point below the candle opening price & SL would be previous candle high or 30 points. Do not take trades using 3 mins Time frame, as there is lot of noise. It works best with 5...

Count:386
Name: BTC WaveTrend R:R=1:1.5
Description: In this strategy, I used Wavetrend indicator (Lazy Bear). It is very simple and easy to understanding: Long when Wavetrend1 crossover Wavetrend2 and they are less than a limit value (not buy when price overbought). Stoploss at lowest 3 bar previous. R:R = 1:1,5. About other shortterm strategies for crypto market, you can view my published strategies.

Count:386
Name: Daytrade strategy RSI CCI EMA 4/8
Description: This strategy is designed for daytrade charts. Its made from EMA 4 / EMA 8 to check for crosses RSI levels for overbough/oversold CCI levels For entry, we check first if the ema 4 crossed ema 8 Secondly we confirm by checking the level of RSI level Finally we confirm with CCI level If all of them are on the same page we enter. For exit we have a fixed...

Count:385
Name: EMA+RSI Pump & Drop Swing Sniper (SL+TP) - Strategy
Description: This is the strategy version of the 'EMA-RSI-Pump-Drop-Swing-Sniper-With-Alerts': Some additions with this strategy: ~Added Stop loss & Take profit control. In Settings > Inputs if the Stop Loss is at .051 that means it's 5.1% and the Take Profit at .096 is 9.6%. If you wish to remove the TP and SL just change the value to 1.00 and it would be the same as it...

Count:385
Name: Bollinger Bands + EMA 9
Description: A 1 minute scalping strategy. Uses Bollinger Bands (no basis line) and a 9 period EMA. Waits for price to close below the lower Bollinger Band and the next candle to close bullish above the lower Bollinger Band but below the 9 Period EMA. If all conditions are met, the script enters a long position with TP at the 9 Period EMA.

Count:384
Name: Donchian Channels Strategy by KrisWaters
Description: Doncian Channels is a trend tracking indicator developed by Richard Doncian. The upper line of the channel is determined by the highest value seen by the price in the defined period, the lower line of the channel is determined by the lowest value seen by the price in the defined period. The middle line takes the average value of the lower and upper channels. ...


Count:383
Name: Bollinger Band strategy with split, limit, stop
Description: Entering a short position after breaking the upper Bollinger Band, entering a long position when entering after breaking the lower Bollinger Band Provides templates for how to display position average price, stop loss, and profit price using the plot function on the chart, and how to buy splits After entering the position, if the price crosses the mid-band...

Count:383
Name: Breakout Trend Follower V2
Description: This is a variation on my other Breakout Trend Follower script. In the other script, you can use a moving average to act as a filter for your trades (i.e. if the price is below the moving average, it won't go long). After making the tool that detects trends on higher timeframes, I wanted to see if that might be a better filter than a moving average. So this...

Count:383
Name: GT 5.1 Strategy
Description: ═════════════════════════════════════════════════════════════════════════ █ OVERVIEW People often look an indicator in their technical analysis to enter a position. We may also need to look at the signals of one or more indicators to verify the signals given by some indicators. In this context, I developed a strategy to test whether it really works by choosing...

Count:383
Name: Strategy Myth-Busting #5 - POKI+GTREND+ADX - [MYN]
Description: This is part of a new series we are calling "Strategy Myth-Busting" where we take open public manual trading strategies and automate them. The goal is to not only validate the authenticity of the claims but to provide an automated version for traders who wish to trade autonomously. Our fifth one we are automating is one of the strategies from "The Best 3 Buy And...

Count:382
Name: Dhananjay Volatility stop strategy v1.0
Description: Sharing one more strategy after getting good feedback on my earlier published strategy. This is simple volatility stop strategy where in we are using VStop as entry and exit point. Again smart traders can add MA to decide the trend and can avoid trading in opposite direction of trend which will help them to minimize loss making trades. There are more than...


Count:380
Name: Directional Trend Index (DTI)
Description: This technique was described by William Blau in his book "Momentum, Direction and Divergence" (1995). His book focuses on three key aspects of trading: momentum, direction and divergence. Blau, who was an electrical engineer before becoming a trader, thoroughly examines the relationship between price and momentum in step-by-step examples. From this...

Count:379
Name: rsi+bb st
Description: added BB in rsi . if rsi touch green, sell. if rsi touch red, buy. also it has stop-loss function.

Count:379
Name: Days Trader 1.0
Description: Simple program to look for day of week or day of month patterns in chart data. All original work by Boffin Hollow Lab Author: Tarzan

Count:379
Name: supertrend with multiple filter strategy
Description: this indicator filters buy and sell signal from the supertrend base on various condition that the user can manually select. as of now the following filter are included buy and sell filter; -Macd -CCI -EMA200 -LUX TRAMA -Stochastic rsi -MFI EXIT SIGNAL CAN BE CHOSE BETWEEN ATR BAND OR BOLLINGER BAND i am planning on keeping to add filters so if you have...

Count:378
Name: Triple SSMA Strategy
Description: A simple trading strategy based on an idea by @sentineli

Count:378
Name: Noro's RiskChannel Strategy
Description: Indicator The Donchian price channel is used. There are 2 methods available to close the position. The user can choose a method. Wikipedia: en.wikipedia.org Strategy #1 (stop-loss type = channel) Old classic trading strategy, using breakouts of the Donchan price channel. If the price is above the price channel top line, open the long position (and close...

Count:377
Name: Peterbolic SAR Strategy
Description: This is a strategy version of the Peterbolic SAR:

Count:376
Name: Strategy PyramiCover
Description: Strategy for pyramidization and coverage. (Indicator PyramiCover) Recommended time frame 60 min.

Count:375
Name: Parabolic SAR Strategy w/ EMA
Description: Long when above EMA and SAR is in long state. Short when below EMA and SAR is in short state.

Count:375
Name: TradersVenue_Renko_Strategy 5M
Description: TradersVenue Renko strategy for intraday and positional trading. It generates buy/sell signals basis Renko ATR and 5M timeframe.

Count:374
Name: Robot BitMEX Fast RSI v1.0 (overlay)
Description: Copy of a script of Robot BitMEX Fast RSI. Differences - overlay

Count:374
Name: Noro's Turtles Strategy
Description: Original idea from book «Way of the Turtle: The Secret Methods that Turned Ordinary People into Legendary Traders» (2007, CURTIS FAITH, ISBN: 9780071486644) Strategy 2 positions types are used. Fast and slow. The period for fast and slow user specifies separately. For example for quick: if the price is higher than the highest price in the last 10 candles, then...

Count:374
Name: Combo Backtest 123 Reversal & Psychological line
Description: This is combo strategies for get a cumulative signal. First strategy This System was created from the Book "How I Tripled My Money In The Futures Market" by Ulf Jensen, Page 183. This is reverse type of strategies. The strategy buys at market, if close price is higher than the previous close during 2 days and the meaning of 9-days Stochastic Slow...

Count:373
Name: Directional Movement Index
Description: ADX is an oscillating indicator, displayed as a single line, ranging from 0 to 100, it only indicates the strength of the trend and does not indicate its direction. In other words, the ADX is non-directional, meaning that it measures the strength of a trend, but doesn’t distinguish between uptrend and downtrends. So, during a strong uptrend, the ADX rises and...

Count:372
Name: DMI Modified Strategy
Description: As promised a strategy of my DMI Modified indicator! (See link below for indicator). === How does it work? === Instead of plotting the positive direction of +DI and negative direction for -DI, we subtract the +DI with the -DI on scales of 100 to -100. The result is plotted with a oscillator to identify the current trend. DMI Modified supports multiple moving...

Count:372
Name: CRYPTO HA Strategy money maker long term
Description: Today I bring you another amazing strategy. Its made of 2 EMA in this case 50 and 100. At the same time, internaly for candles we calculate the candles using the HA system ( while still using in live the normal candles). This way we can assure that even if we use HA candles, we avoid repainting, and its legit. We first calculate the HA candles based on the EMA...

Count:371
Name: Noro's CryptoBottom Strategy
Description: - 80-100% of profitable trades - low risk - low profit - for crypto/fiat - for W1, D1, H4 timeframe

Count:371
Name: Stoch-RSI 4h/1h/15min
Description: !!!! Note: Run this on the 15min timeframe (Important) !!!! Note the default settings on this indicator are best for BTC/USDT. For other pairs it might take some fiddling with variables to get a useful result (if a useful result is obtainable with the selected pair) Generally, select between the options (RSI/Stoch) and (15min/1hour) and (1hour/4hours) - to find a...

Count:370
Name: Keltner Channel Backtest
Description: The Keltner Channel, a classic indicator of technical analysis developed by Chester Keltner in 1960. The indicator is a bit like Bollinger Bands and Envelopes. You can change long to short in the Input Settings WARNING: - For purpose educate only - This script to change bars colors.

Count:370
Name: simple bot
Description: the AI= value of close of candle < value of close of candle previous by 1 = sell close > close1 = buy closeorder on SL closeorder on AutoProfit closeorder on signal reverse (if openorder not in profit)

Count:370
Name: Moving Average Crossover 0001
Description: The first strategy for my (also first) Everyday project. During the rest of 2016 I plan to create a new strategy everyday and I give myself between 15 minutes and 2 hours to complete the idea. The goal is to improve my knowledge of Pine Script, become a faster strategy coder, and experiment with different strategic trading ideas. I'm new to strategies and...

Count:370
Name: Webhook Starter Kit [HullBuster]
Description: Introduction This is an open source strategy which provides a framework for webhook enabled projects. It is designed to work out-of-the-box on any instrument triggering on an intraday bar interval. This is a full featured script with an emphasis on actual trading at a brokerage through the TradingView alert mechanism and without requiring browser plugins....


Count:369
Name: GMS: Moving Average Crossover Strategy
Description: This is a moving average crossover system built the way I would want it to be. - The moving averages included are SMA, EMA, WMA, VWMA. - You can select either for the first moving average or the second moving average. - You can also select to see the Long trades, Short trades, or both at the same time. - There is also a simple moving average trend filter. When...

Count:368
Name: Combo Backtest 123 Reversal & Ichimoku2c
Description: This is combo strategies for get a cumulative signal. First strategy This System was created from the Book "How I Tripled My Money In The Futures Market" by Ulf Jensen, Page 183. This is reverse type of strategies. The strategy buys at market, if close price is higher than the previous close during 2 days and the meaning of 9-days Stochastic Slow...

Count:368
Name: Chaloke System Strategy
Description: Chaloke System Strategy This is a trend indicator Atr and 3 moving averages are used Short 9-day moving average,Medium 15-day moving average,Calculated with a long 24-day moving average. Atr period : 5 Sht,Mid,Lng calculation method is different Buying Strategy long = crossover(Sht,Mid) and close > Sht Selling Strategy short = crossunder(Sht, Lng ) or close <...

Count:368
Name: Center of Gravity BF 🚀
Description: Thanks to HPotter for the code I based this strategy on. Center of Gravity calculation is based here on a linear regression function using the least squares method. We use this to calculate a channel consisting of 2 lines, green and red on the chart This strategy employs a dynamic stop loss function that measures stop loss placement based on recent ATR. How...

Count:367
Name: Noro's Triple RSI Top/Bottom v1.1
Description: In 1.1 added: + Leverage-parameter + Indicators-parameter Strategy It is the indicator. Threefold RSI . 3 different RSI indicators are used: 1) The RSI indicator with the period 2 2) The RSI indicator with the period 7 3) The RSI indicator with the period 14 If at the same time RSI-2 < 10 and RSI-7 < 20 and RSI-14 < 30 = a bottom If at the same time...

Count:367
Name: 2x take profit, move stop loss to entry
Description: Two take profit targets moving stop loss to entry after first take profit hit This strategy shows a method to achieve the following trade management: 1) Open a position with two take profit targets 2) When first take profit is hit, move the stop loss to entry price 3) Position is closed when either second take profit is hit or position is stopped out at entry ...

Count:366
Name: Up & Down Trend Trading Strategy - BNB/USDT 15min
Description: This strategy will focus on up trend trading and down trend trading based on several indicators such as; for up trend 1. SAR indicator 2. Super trend indicator 3. Simple moving average for the period of 100 down trend 1. RSI Indicator 2. Money flow index 3. Relative volatility index 4. Balance of powder

Count:365
Name: Pivot Reversal Strategy - TimeFramed
Description: This is Pivot Reversal Strategy including the time frames for backtesting.

Count:365
Name: Bullish Engulfing Backtest
Description: This is a bullish reversal pattern formed by two candlesticks. Following a downtrend, the first candlestick is a down candlestick which is followed by an up candlestick which has a long real body that engulfs or contains the real body of the prior bar. The Engulfing pattern is the reverse of the Harami pattern. WARNING: - For purpose educate...

Count:364
Name: 2-Period RSI strategy (with filter)
Description: 2-period RSI strategy backtest described in several books of the trader Larry Connors . This strategy uses a 2 periods RSI , one slow arithmetic moving average and one fast arithmetic moving average. Entry signal: - RSI 2 value below oversold level (Larry Connors usually sets oversold to be below 5, but other authors prefer to work below 10 due to the higher...

Count:364
Name: MACD + RSI TS
Description: A simple strategy that use EMAs convergence/divergence and RSI peeks to take position. Fractals are really useful to positioning your stop loss. It works well on commodities and forex markets.

Count:364
Name: Gap Down Reversal Strategy
Description: A "Gap down Reversal" is when the current days candle, opens, below the prior days close, and "finishes up" on the day with the close greater than the open. This type of price action can provide traders with favorable entry points to trade long, as anyone who was short the prior day, can get squeezed or panic out of the trade as they would see profits erode...

Count:364
Name: Big Whale Purchases and Sales
Description: Big Whale Purchases and Sales - plots big whale transactions on your chart! People that hold more than 1% of a crypto currencies circulating supply are considered whales and have a huge influence on price, not just because they can move the market with their huge transactions, but also because other traders often track their wallets and follow their example....

Count:363
Name: ARR VWAP Intraday
Description: Intra day VWAP Strategy Strategy is Buy when vwap goes up and RSI above 50 (Can be modified) . Sell wehn vwap goes down and rsi bellow 50 (Can be modified) Exit all at market close hour specified

Count:363
Name: Combo Backtest 123 Reversal & SMI Ergodic Oscillator
Description: This is combo strategies for get a cumulative signal. First strategy This System was created from the Book "How I Tripled My Money In The Futures Market" by Ulf Jensen, Page 183. This is reverse type of strategies. The strategy buys at market, if close price is higher than the previous close during 2 days and the meaning of 9-days Stochastic Slow...

Count:363
Name: Macd Divergence + MTF EMA
Description: MACD Divergence + Multi Time Frame EMA This Strategy uses 3 indicators: the Macd and two emas in different time frames The configuration of the strategy is: Macd standar configuration (12, 26, 9) in 1H resolution 10 periods ema, in 1H resolution 5 periods ema, in 15 minutes resolution We use the two emas to filter for long and short positions. If 15 minutes ema...

Count:362
Name: PineScript v4 - Forex Pin-Bar Trading Strategy
Description: PineScript v4, forex trading robot based on the commonly used bullish / bearish pin-bar piercing the moving averages strategy. I coded this robot to stress-test the PineScript v4 language to see how advanced it is, and whether I could port a forex trading strategy from MT4 to TradingView. In my opinion, PineScript v4 is still not a professional coding...

Count:362
Name: EMA Strategy
Description: This strategy is in testing and development. **USE AT YOUR OWN RISK. ** This defaults to a 13/48 EMA using the closing price. When the fast EMA crosses above the slow it triggers a buy. When it crosses below the slow EMA it triggers a sell and potentially a short, but that is not implemented. Stops, trailing stops, and pyramiding to be added. The purpose of...

Count:362
Name: RSI Buy and Sell
Description: This is sooooooooo simple. Buy when RSI is above 70 and don't sell til it'sunder 30.

Count:362
Name: Moving Average Cross Strategy
Description: Simply choose your moving averages and backtest shorting and longing the crossing of these MA's. Meant for dialing in MA crosses as part of a trading setup and not reason enough to take the trade. First script, work in progress.

Count:362
Name: RSI5_50 with Divergence
Description: This is variation of RSI Divergence strategy. I have added a filter (long term RSI) to the Rules. strategy BUYs when RSI 50 period is above 50 line and there is divergence on the short term RSI settings ========= short term RSI period 5 long term RSI period 50 stopLoss is 8% --- if setting is enabled BUY Rule ======== RSI 50 is above 50 line short...

Count:361
Name: Squeeze Breakout using BB and KC [v1.0][Bishnu103]
Description: Squeeze Breakout using BB and KC

Count:361
Name: LowFinder_PyraMider_V2
Description: This strategy is a result of an exploration to experiment with other ways to detect lows / dips in the price movement, to try out alternative ways to exit and stop positions and a dive into risk management. It uses a combination of different indicators to detect and filter the potential lows and opens multiple positions to spread the risk and opportunities for...

Count:360
Name: Grid System With Fake Martingale
Description: The proposed strategy is based on a grid system with a money management that tries to replicate the effect of a martingale without having to double your position size after each loss, hence the name "fake martingale". Note that a balance using this strategy is still subject to exponential decay, the risk is not minimized, as such, it would be dangerous to use this...

Count:360
Name: Supertrend adapted to strategy
Description: Supertrend from KivancOzbilgic adapted to strategy so people can accurately maximise its profit regardless the asset and time-frame. Hope it helps


Count:359
Name: Maximized Moving Average Crossing (by Coinrule)
Description: Using the crossings of two Moving Averages to trade in a trading strategy is a Trend-Following approach. As the name would suggest, to be successful, it requires the asset to be on-trend. The general limit of a common strategy based on Moving Averages is that they underperform when the market is less volatile or trading sideways. When volatility compresses, the...

Count:359
Name: MACD 50x Leveraged Strategy Real Equity Simulation
Description: Hello, I wrote this script to merge the two scripts I shared before. The aim here is to see the real value of the state of the capital as a result of leveraged transactions and to combine both long and short directions. Scripts : MACD Long 50x Leverage Strategy : MACD Short 50x Leverage Strategy : The parameters have not changed so they are the same...

Count:359
Name: RSI V Pattern strategy
Description: This strategy based on RSI for swing trading or short term trading Strategy Rules ============= LONG 1. ema20 is above ema50 --- candles are colored green on the chart 2. RSI value sharply coming up previous candle1 low is previous candle2 low and previous candle1 RSI value is less than previous candle2 current candle RSI value is greater...

Count:358
Name: Stochastic CCI BF 🚀
Description: Simply a Stochastic RSI and CCI mix with a Rate of Change filter to stay out of choppy sideways markets. SIGNALS For a long signal we need both the CCI above 0 and the stochastic line to be higher than the last candle. For a short signal we need both the CCI below 0 and the stochastic line to be lower than the last candle. INSTRUCTIONS Pay attention to...

Count:358
Name: MacD Short and/or Long with Bi-Directional TP and SL
Description: This tool allows you to test any variable value for MacD and Signal for going Long or Short with each market direction having customizable values for stop loss and take profit. For example, sometimes the MacD and Signal values are better with different lengths between Short and Long. You can use this tool to see them overlaid and determine the best settings for...

Count:358
Name: Guerilla Fear/Greed Index Strategy
Description: This strategy combines NAAIM Exposure Index and the Equity Put/Call Ratio into Fear/Greed Index that oscillates between 0 and 100. It smooths all of these values and enters a trade when Fear reaches a certain threshold and exits when Greed reaches a certain threshold. I don't really know if this is a great indicator or not, but the results on various indexes...

Count:358
Name: Binary Option EMA/Stoch strategy Corrected
Description: Previous indicator was flawed I mistakenly misplaced the script which was giving opposite signals. This on is corrected version of previous EMA/Stoch strategy.

Count:358
Name: BuyTheDip
Description: Well, I often had arguments in online forum with a guy who claimed to time the market perfectly without any technical analysis or prior experience. He often claimed that technical analysis does not work and it only works when you trade on other's emotions. He also argued that algorithmic trading isn't profitable - if so, everyone would do that. Hence, I thought I...

Count:357
Name: Abdoli's Heikin Ashi Smoothed Buy & Sell Strategy Rev.4
Description: This simple strategy is just based of a single indicator, my dear Heikin Ashi Smoothed! Just try and enjoy it ;)

Count:357
Name: Double EMA CROSS
Description: Double EMA CROSS (DEC) Useful for identifying and receiving alerts about uptrends and downtrends. This script uses two Exponential Moving Averages (EMAs) to find price uptrends and downtrends. An Exponential Moving Average ( EMA ) is a type of moving average that places a greater weight and significance on the most recent data points. The script produces...

Count:356
Name: Trendlines Strategy
Description: Using the clever calculations and code by BacktestRookies, here is a strategy that buys when the price breaks above the trend line and sells (or shorts) when it crosses below. This logic can be reversed, which seems to work better with recent market conditions.

Count:356
Name: Pyramiding Entries On Early Trends (by Coinrule)
Description: Pyramiding the entries in a trading strategy may be risky but at the same time very profitable with a proper risk management approach. This strategy seeks to spot early signs of uptrends and increase the position's size while the right conditions persist. Each trade comes with its stop-loss and take-profit to enforce a proportional risk/reward profile. The...

Count:356
Name: RSI w MA Strategy
Description: This strategy is mostly for cryptocurrencies, it applies a moving average to an rsi and trades based on the crossings. It includes the indicator that it is made from.

Count:355
Name: Power X Strategy Back-test
Description: This script back-test the Power X Strategy developed by Markus Heitkoetter and Rockwell Trading. For more detail about the strategy, please refer to "The PowerX Strategy: How to Trade Stocks and Options in Only 15 Minutes a Day" written by Markus Heitkoetter. Note that this script is not publish, develop or maintain by Rockwell Trading, and may have different...


Count:355
Name: Volatility Breakout Strategy
Description: This is a strategy used by Larry R. Williams called Volatility Breakout. By identifying a strong uptrend that exceeds 'a certain level' on a daily basis as a breakout signal, enter long position, take advantage of long at the the next day's open. 'a certain level (Entry Price)' is calculated by { close + 'k' * high -low }, and applied logarithmic...

Count:355
Name: 3 EMA Stochastik RSI ATR SL TP only LONG
Description: Hey there! Here i will show you the 3 EMA RSI Stochastic Crossover strategy with an ATR SL and TP. The strategy works as follows: For long positions, the EMA's must be in the following order: The 8 E M A must be above the 14 E M A and the 14 E M A must be above the 50 E M A. The buy signal is given to us by the Stochastic RSI indicators. The K line must cross...

Count:354
Name: Strategy: Range Breakout
Description: What? In the price action, levels have a significant role to play. Based on the price moving above/below the levels - the underlying instrument shows some price-action in the direction of breakout/breakdown. There are plenty of ways level can be determined. Levels are the decision point to take a trade or not. But if we make the level derivation complex, then...

Count:354
Name: Noro's TrendTrader Strategy v1.0
Description: It is the modified by me TrendTrader strategy.

Count:354
Name: BO - Bar's direction Signal - Backtesting
Description: BO - Bar's direction Signal - Backtesting Options: A. Factors Calculate probability of x bars same direction 1. Periods Counting: Data to count From day/month/year To day/month/year 2. Trading Time: only cases occurred in trading time were counted. B. Timezone 1. Trading time depend on Time zone and specified chart. 2. Enable Highlight Trading Time to check your...

Count:354
Name: Sweat Dreams
Description: It is based on the intersection of the kagi function and the weighted moving average Available for all time frames Available for all crypto currency pairs High-yield on all time frames The script is the dream of all traders Repaints like a boss. Use at your own risk, or dont use at all! ------------------------------ Основан на пересечении функции каги...

Count:353
Name: ALMA/EMA/SRSI Strategy + Indicator
Description: Back with another great high hit rate strategy!! Disclaimer* This strategy was sampled using source code written by @ClassicScott , as referred to in the script, there is a clear line where the source code was scripted by myself. This Strategy consists of three key factors, the ALMA, EMA crossover, and a Stochastic Rsi ALMA: The Alma is the step line...

Count:353
Name: Pivot Point V2 Backtest
Description: Pivot points simply took the high, low, and closing price from the previous period and divided by 3 to find the pivot. From this pivot, traders would then base their calculations for three support, and three resistance levels. The calculation for the most basic flavor of pivot points, known as ‘floor-trader pivots’, along with their support and resistance...

Count:353
Name: [Sniper] SSL Hybrid + QQE MOD + Waddah Attar Strategy
Description: Hi. I’m DuDu95. ********************************************************************************** This is the script for the series called "Sniper". *** What is "Sniper" Series? *** "Sniper" series is the project that I’m going to start. In "Sniper" Series, I’m going to "snipe and shoot" the youtuber’s strategy: to find out whether the youtuber’s video about...

Count:353
Name: GetTrendStrategy Fast
Description: GetTrendStrategy but much much much faster, and much more productive. Works perfect on 1m charts (YaroslavG)

Count:352
Name: Renko Level Strategy 2
Description: Renko Level Strategy Main change of my previous strategy, that it look to one level of RENKO and use ATR value from each previous candle. I think it is more correct than use levels that appears in first candle of new RENKO level, cause it base on current volatility, but not on volatility that was many candles ago.

Count:352
Name: 4H CCI Strategy
Description: Just a test...I'm not sure this will work 100%. I think the backtest is flawed (the exit parameters look suspicious) Anyway, the strategy does make sense, maybe in live trading it'll toss good signals. Can we apply it to our demo account here? (trading panl) Anyone?

Count:350
Name: XPloRR MA-Trailing-Stop Strategy
Description: XPloRR MA-Trailing-Stop Strategy Long term MA-Trailing-Stop strategy with Adjustable Signal Strength to beat Buy&Hold strategy None of the strategies that I tested can beat the long term Buy&Hold strategy. That's the reason why I wrote this strategy. Purpose: beat Buy&Hold strategy with around 10 trades. 100% capitalize sold trade into new trade. My buy...

Count:348
Name: BTFD strategy [3min]
Description: Hello I would like to introduce a very simple strategy to buy lows and sell with minimal profit This strategy works very well in the markets when there is no clear trend and in other words, the trend going sideways this strategy works very well for stable financial markets like spx500, nasdaq100 and dow jones 30 two indicators were used to determine the best...

Count:348
Name: Mix1 : Ema Cross + Trend Channel [Gu5] - Backtest
Description: Backtest of the indicator "Mix1: Ema Cross + Trend Channel " Trend indicator, by the crossing of moving averages SMA200 with a channel as a filter confirms the trend. The crossing of two moving averages, give alert only in trend.

Count:348
Name: Noro's Fishnet Strategy
Description: 20 lines are JMA. Green color - a uptrend. Red color - a downtrend. Color filter If this checkbox is chosen, then long positions will be open only if a red candle. Short positions will open if a green candle. If this checkbox is not chosen, then positions will open at change of a trend. Color of a candle will not matter.
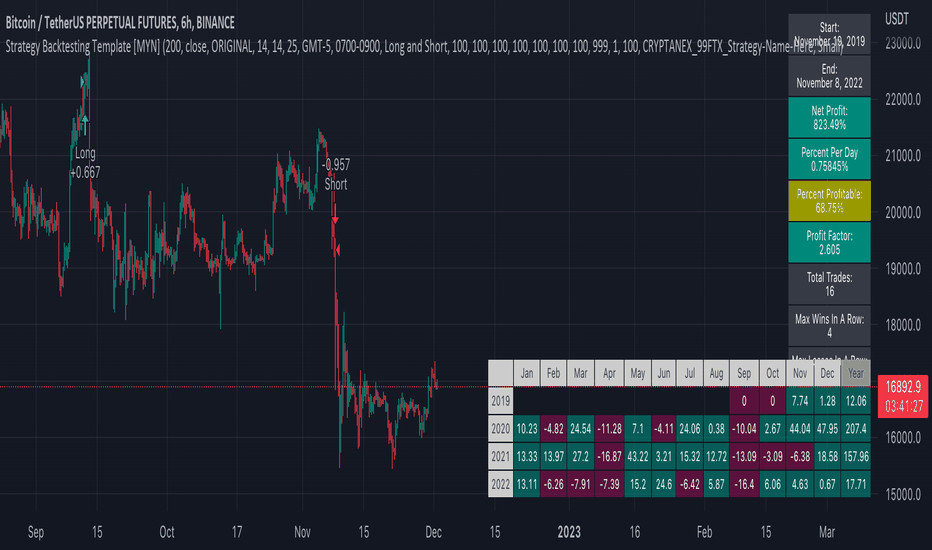
Count:348
Name: Strategy Backtesting Template [MYN]
Description: A few people have been asking me to share my backtesting template. Currently I use this as my starting point for validating existing strategies and developing new ones. Features: Trading Date Range Trade Direction 4 progressive take profits with target percents and percentage of position to take profit on (Thanks adolgo) Variable percentage Stop...

Count:347
Name: BuyHigh-SellLow Strategy
Description: Yeah. You read it right. It's not a mistake. It is buy high and sell low strategy. Main entry condition is to buy when price hits 40 day Donchian channel top. This is combined with my other regular filters which are aligned moving average and new high/low filter and yearly high/low filter. Exit condition can be based on two things: Donchian channel : Set...

Count:347
Name: HalfTrend Strategy
Description: BTCUSD -- 5 min BUY POSITION 1 : The price is above the ema 2 : A buy signal appears on the HalfTrend (blue triangle) SELL POSITION 1 : The price is bellow the ema 2 : A sell signal appears on the HalfTrend (red triangle)

Count:346
Name: Noro's Fast RSI Strategy v1.6
Description: In 1.6: + Profit became bigger + BarColor Strategy For: - crypto/fiat - crypto/crypto - timeframes: 1hour, 45min, 30min, 15min, 5min


Count:346
Name: Linear Regression Channel Breakout Strategy
Description: This strategy is based on LonesomeTheBlue's Linear Regression Channel Indicator. First of all, I would like to thank LonesomeTheBlue. Breaking the Linear Regression Channel to close the candle triggers a Long or Short signal. If the slope of the Linear Regression Channel is positive, it is Short when it breaks out the lower line, and when the slope is negative, it...

Count:346
Name: Combo Backtest 123 Reversal & ECO Strategy
Description: This is combo strategies for get a cumulative signal. First strategy This System was created from the Book "How I Tripled My Money In The Futures Market" by Ulf Jensen, Page 183. This is reverse type of strategies. The strategy buys at market, if close price is higher than the previous close during 2 days and the meaning of 9-days Stochastic Slow...

Count:344
Name: SPX Fair Value Strategy Ultimate
Description: This is a strategy using the SPX Fair Value derived from Net Liquidity. Net Liquidity function is simply: Fed Balance Sheet - Treasury General Account - Reverse Repo Balance Formula for calculating the fair value of SPX using Net Liquidity looks like this: net_liquidity/1000000000/1.1 -1625 The SPX Fair Value is then subtracted from the SPX value which creates...

Count:344
Name: action zone - ATR stop reverse order strategy v0.1 by 9nck
Description: ACTION ZONE-ATR MOD v0.1 DOCUMENTATION Overview This tradingview pine script strategy is mainly created to enrich my coding skill. It is a combination of “CDC-ACTIONZONE” and my personal studies of trading techniques in various sources e.g.book, course or blog. This strategy purposefully built to connect with my automatic trading bot. However, It will be very...

Count:344
Name: TDI - Traders Dynamic Index - Roshan [Mehdi]
Description: This method is based on Mr. Roshan's technique which use TDI with upper timeframe

Count:343
Name: IFTS+TS Strategy Overlay
Description: Inverse Fisher transform on stochastic with Hull MA and Donchian Channels with oversell/overbuy levels and dynamic trailing stop Options: Fixed trailing stop Dynamic, based on ATR trailing stop Re-enter after trailing stop Includes Hull MA Hull MA filtration for re-entering after trailing stop Donchian channels, with overbuy/oversell levels No repaints

Count:342
Name: Combo Backtest 123 Reversal & EMA & MA Crossover
Description: This is combo strategies for get a cumulative signal. First strategy This System was created from the Book "How I Tripled My Money In The Futures Market" by Ulf Jensen, Page 183. This is reverse type of strategies. The strategy buys at market, if close price is higher than the previous close during 2 days and the meaning of 9-days Stochastic Slow...

Count:342
Name: How To Set Trade Dates
Description: Example how to backtest specific date(s) which can be useful for testing seasonality strategy ideas such as "Sell in May", etc. If using Daily period with wild card dates it will not trade on 1st day of month. If market is closed will trade on next open day. Works only with Daily or lower timeframes. When using on Daily timeframe set dates 1 day earlier to...

Count:342
Name: All in One Strategy no RSI Label - For higher dollar crypto
Description: This is the All in One Strategy without the RSI suggestion label that will work well for any of the crypto currencies trading above $500 so the overlay shows up better. I am using ETH as an example on this. Based on some comments on my previously published script that has been replaced I have added Alert Conditions to this version that can be used in other bots....

Count:342
Name: Noro's Trend MAs Strategy v2.3
Description: Don't use on pairs of type "crypto/crypto"! Only for pairs like "crypto/fiat" ("BTC/USD", "BTC/CNY", "ETH/USD", "ETH/CNY", etc) Trade strategy which uses only 2 MA. The slow MA (blue) is used for definition of a trend The fast MA (red) is used for an entrance to the transaction For: - For H1 - For crypto/fiat - Good for "BTC/USD", "ETH/USD" ...

Count:342
Name: Grid Spot Trading Algorithm V2 - The Quant Science
Description: Grid Spot Trading Algorithm V2 is the last grid trading algorithm made by our developer team. Grid Spot Trading Algorithm V2 is a fixed 10-level grid trading algorithm. The grid is divided into an accumulation area (red) and a selling area (green). In the accumulation area, the algorithm will place new buy orders, selling the long positions on the top of the...

Count:342
Name: How To Auto Set Date Range
Description: Example how to automatically set the date range window to be backtested from X days or weeks ago to present. Additional options are also included to manually set the date range or to show entire range available. Normally when you change chart period it changes the number of days being backtested, which means as you increase the chart period (for example from 5min...

Count:341
Name: Simple RSI Strategy Buy/Sell at a certain level
Description: Simple Strategy based on RSI, using overbought or oversold levels, defined by us, sell or buy an asset. Backtest: ETHUSD (Bitmex) - 3h


Count:341
Name: Bill Williams. Awesome Oscillator (AC) Strategy Backtest
Description: This indicator plots the oscillator as a histogram where blue denotes periods suited for buying and red . for selling. If the current value of AO (Awesome Oscillator) is above previous, the period is considered suited for buying and the period is marked blue. If the AO value is not above previous, the period is considered suited for selling...

Count:340
Name: 5 Minute Scalping Strategy
Description: Taking entrys based on the 1 minute timeframe MACD only taking longs when all emas are in the correct order and there is a bigger than usual MACD downtick and the RSI is above 51 only taking shorts when all emas are in the opposite order and there is a bigger than usual uptick on the MACD and the RSI is bellow 49 bigger than usual ticks are defined by bollinger...

Count:340
Name: Click Draw TrendLine [UhoKang] v2
Description: This is an indicator that directly draws a trend line by clicking on the candle. Click to Create Trend lines !! Create a trend line by connecting A, B, and C with three vertices. 1. Draw Bear Trend line Click pivot high : First pivothigh of the downtrend line Click pivot low : pivotlow of the downtrend line Click pivot high : Second pivothigh of the...

Count:339
Name: Optimized Keltner Channels SL/TP Strategy for BTC
Description: This strategy is optimized for Bitcoin with the Keltner Channel Strategy, which is TradingView's built-in strategy. In the original Keltner Channel Strategy, it was difficult to predict the timing of entry because the Buy and Sell signals floated in the middle of the candle in real time. This strategy is convenient because if the bitcoin price hits the top or...

Count:339
Name: Noro's Squeeze Momentum Strategy v1.0
Description: This strategy uses 3 different indicators: 1) Squeeze Momentum Indicator (by LazyBear) 2) Color of a candle as filter of signals 3) Candle body size as filter of signals (EMA Body) Strategy If Squeeze Momentum Indicator is indicated uptrend both at the same time by a candle red and at the same time more than a third of a body of an average candle - to open...

Count:339
Name: ATR Trailing Stop Bands Strategy [R]
Description: Originally based on a script by HPotter for an ATR Trailing Stop, which itself was based on an article by Sylvain Vervoort, but I adapted it to add Bands, to add extra optional Wick Protection, and have now made it a Strategy. It's not great for entries/exits, but as a Trailing Stop that can let winners ride, it's great.

Count:339
Name: STR:EMA Oscilator [Azzrael]
Description: Strategy based on EMA and EMA Oscilator (EMA - close) + Std Dev + Factor = detecting oversell/overbuy Long only! Pyramiding - sometimes, depends on ... There're 2 enter strategies in one script: 1 - Classic, buy on entering to OverSell zone (more profitable ~> 70%) 2 - Crazy, buy on entering to OverBuy zone (catching trend and pyramiding, more net profit) Exit...

Count:339
Name: Big Candles v1
Description: This script simply takes a user-defined bar height number (variable barHeight) to find large candles. Automatically colors large bullish and bearish candles green or red, respectively. The barHeight can be modified to fit your needs. Use this in a variety of ways: - Confirm breakouts of support / resistance - Identify new trends

Count:339
Name: Heiken Ashi MTF Strategy- Indicator
Description: Hello, this is both a strategy and indicator that revolves around Heikin Ashi candles. In this case we take 3 different time frames, in this example we use daily , weekly and monthly. The conditions for entry are : For long : we check that we have a green daily candle, at the same time we check that the weekly and monthly candles are also green. For short : We...

Count:338
Name: MACD Crossover Strategy with EMA200 Trend Detection
Description: Simple MACD Strategy Indicator. Rules: - MACD Crossover with Signal Line If - MACD Crossover above zero line - Price is below EMA200 => Sell If - MACD Crossover below zero line (buy) - Price is above EMA200 => Buy

Count:338
Name: Automated - Fibs with Limit only orders
Description: Automated - Fibs with Limit only orders This script was designed to demonstrate how you can use a single alert to move your limit orders around. It is not meant to be traded live and has been built to work with Binance Futures Testnet. You will notice a lot of plots with 5 different titles. New = Place your limit buy at a fixed-price. Move = Cancel the current...

Count:337
Name: Noro's BottomSensivity v0.6 strategy + rsi + Alarm
Description: The original indicator is Noro's BottomSensivity v0.6 I simply turned noro's bottom sensibility 6.0 indicator, which I consider a great tool to find market bottom, into a strategy. I also added an additional RSI filter with inputs that can be set by the user for entry and exit from the market. I have tried to insert an alarm so that I can be notified when this...

Count:337
Name: Combo Backtest 123 Reversal & T3 Averages
Description: This is combo strategies for get a cumulative signal. First strategy This System was created from the Book "How I Tripled My Money In The Futures Market" by Ulf Jensen, Page 183. This is reverse type of strategies. The strategy buys at market, if close price is higher than the previous close during 2 days and the meaning of 9-days Stochastic Slow...

Count:337
Name: Big Bar Strategy
Description: // This strategy detects and uses big bars to enter a position. When the Big Bar // is bearish (red candle) the position will be long and viceversa // for short positions. The stop loss (optional) is placed on the low of the // candle used to trigger the position and user inputs allow you to modify the // size of the SL. Take profit is placed on a reward ratio...

Count:336
Name: Av3
Description: Based on the ANNE EA v3 for MT4. For use on FOREX.
if ATR is greater than ATR average taken from last 5 candles, then market considered as trending, and so Open(0)>Close(1)=buy Open(0)Close(1)=sell Open(0)

Count:336
Name: Turtle Strategy Short Sell Version
Description: This is a short-sell version of the strategy based on the famous turtle system. www.tradingblox.com In a nutshell, it a trend trading system where you are shorting on strength (in the downtrend), selling on weakness (that it might be reversing). positions should be entered when the price crosses under the 20-day low (S1 low) or 55-day low (S2 low). positions...

Count:336
Name: Stochastic Pop and Drop by Jake Bernstein v1 [Bitduke]
Description: I found a simple strategy by Jake Bernstein, modified it a little and created a strategy with Risk Management System (SL+TP); After that I test it on the different cryptocurrency pairs. About the Indicator Basically it's the strategy of 2 indicators: Stochastic Oscillator to define the bias and Average Directional Index to confirm it. One again, It uses...

Count:336
Name: 3-Bar-Reversal-Pattern Strategy Backtest
Description: This startegy based on 3-day pattern reversal described in "Are Three-Bar Patterns Reliable For Stocks" article by Thomas Bulkowski, presented in January, 2000 issue of Stocks&Commodities magazine. That pattern conforms to the following rules: - It uses daily prices, not intraday or weekly prices; - The middle day of the three-day pattern has the lowest...

Count:335
Name: FFT Strategy Bi-Directional Stop/Profit/Trailing + VMA + Aroon
Description: This strategy uses the Fast Fourier Transform inspired from the source code of @tbiktag for the Fast Fourier Transform & @lazybear for the VMA filter. If you are not familiar with the Fast Fourier transform it is a variation of the Discrete Fourier Transform. Veritasium on youtube has a great video on it with a follow up recommendation from...

Count:335
Name: Laguerre RSI by KivancOzbilgic STRATEGY
Description: Backtesting. " Laguerre RSI is based on John EHLERS' Laguerre Filter to avoid the noise of RSI . Change alpha coefficient to increase/decrease lag and smoothness. Buy when Laguerre RSI crosses upwards above 20. Sell when Laguerre RSI crosses down below 80. While indicator runs flat above 80 level, it means that an uptrend is strong. While indicator runs flat...

Count:334
Name: 3x Supertrend and Stoch RSI
Description: Based on the strategy if Trade pro "HIGHEST PROFIT Triple Supertrend Trading Strategy Proven 100 Trade Results" Your entry long signal will show when two of the three supertrend are green and the stochastic rsi cross up and the candle is above the ema Your entry short signal will show when two of the three supertrend are red and the stochastic rsi cross down and...

Count:334
Name: HL MovingAvg2Line Cross Dhananjay
Description: Sharing the simple trend following trading strategy, traders can add their own rules in this, to minimise the losses and maximise the profits. Like below. 1. Go long only if price is above 189 days EMA/SAM 2. Exit position when high or low of previous candle is breached in the opposite direction of the trend. 3. Go long only if price is in up trend on higher...
Count:334
Name: Combo 2/20 EMA & Bull Power
Description: This is combo strategies for get a cumulative signal. First strategy This indicator plots 2/20 exponential moving average. For the Mov Avg X 2/20 Indicator, the EMA bar will be painted when the Alert criteria is met. Second strategy Bull Power Indicator To get more information please see "Bull And Bear Balance Indicator" by Vadim Gimelfarb. ...

Count:334
Name: SuperTrend Enhanced Pivot Reversal - Strategy [PresentTrading]
Description: - Introduction and How it is Different The SuperTrend Enhanced Pivot Reversal is a unique approach to trading that combines the best of two worlds: the precision of pivot reversal points and the trend-following power of the SuperTrend indicator. This strategy is designed to provide traders with clear entry and exit points, while also filtering out potentially...

Count:334
Name: Soheil PKO's 5 min Hitman Scalp - 3MA + Laguerre RSI + ADX [Pt]
Description: Someone sent me this strategy found on YouTube. It is Soheil PKO's "The Best and Most Profitable Scalping Strategy" Best way to find out is to code it =) This strategy uses Moving Average Ribbon, Laguerre RSI, and ADX. This script only displays the MA ribbon, you will need to add Laguerre RSI and ADX separately. Long Entry Criteria: - 16 EMA > 48 EMA > 200...

Count:334
Name: Noro's SuperTrend Strategy v2.0 Limit
Description: This strategy same as "Noro's SuperTrend Strategy v1.0". But it is used limit orders. The price for the limit orders is the price of closing of the previous bar. The color filter of a candle is used.

Count:333
Name: Up & Down Trend following trading strategy for BTC/USDT 3h
Description: This strategy is based on multi time frame technical indicators such as; 1. RSI (10,50,100) 2. MFI (10,50,100) 3. RVI (10,50,100) 4. BOP (10,50,100) 5. Super Trend 6. SAR indicator 7. Higher highs and lower lows 8. SMA (9,500) 9. EMA (9,200) After evaluating different parameters provided by those indicators, script is in a possition to determine optimul...

Count:333
Name: Noro's DEX Strategy
Description: The lime line is the high-price candle of the previous day. The red line is the low-price candle of the previous day. If the price is above the lime line, open the long position (and close the short position). If the price is below the red line, open the short position (and close the long position). Market stop orders are recommended.

Count:333
Name: SAR Trend Trader Strategy By: jhanson107
Description: This strategy utilizes Parabolic SAR (Stop and Reverse) along with EMA filtering to improve accuracy. Use the strategy to find optimal settings for the pair your are trading. Long: 1. SAR below price action 2. Above slow EMA (Default 100 EMA) 3. Update trailing stop daily and exit trade once stopped out. Short 1. SAR above price action 2. Below slow EMA (Default...

Count:333
Name: HMA_ATR Strategy
Description: ATR with HMA experimental minimalist bot for ETHBTC . A strategy for use by Automated Algorithm systems. Different from normal ATR as it uses HMA for smoothing. Example settings result shown here on chart include commission 0.5%

Count:333
Name: SB_RSI/MFI with Volatility Version 1.0
Description: Take on LazyBear's SB_RSI/MFI with Volatility Indicator. The original indicator is coupled with the Bollinger Band strategy. Original Idea: Wanted to test the indicator with bbstrategy. Message if you think of any modifications/ enhancements/ any opportunities. :) Donations/Tips... :) - BTC: 1BjswGcRR6c23pka7qh5t5k56j46cuyyy2 ETH:...

Count:333
Name: Extended Recursive Bands Strategy
Description: The original indicator was created by alexgrover . All credit goes to alexgrover for creating the indicator that this strategy uses. This strategy was posted because there were multiple requests for it, and no strategy based on this indicator exists yet. The Recursive Bands Indicator, an indicator specially created to be extremely efficient, I think you...

Count:332
Name: RSI+STOCHRSI v2
Description: RSI + STOCHASTIC RSI combination v2 ( for v1 ) For 5 min Changes Stcoh RSI creates signal with crossover RSI created signal with an equation ( above or below the line) ,crossover was added.

Count:332
Name: Wave Trend w/ VWMA overlay
Description: This is a trend-following strategy and indicator which combines the Wave Trend Strategy (Lazy Bear) by thomas.gigure with the cRSI + Waves Strategy with VWMA overlay by Dr_Roboto . You may update the parameters of the Wave Trend oscillator or the VWMA indicator to match your own preferences. You may also adjust the Base Quantity used for determining...

Count:332
Name: [AutoView] MovingAvg Cross - Video Attached
Description: There is nothing special or spectacular about this script. It's your standard Moving Average Cross Strategy. It is actually a built in script everyone has access to already. I only changed some of the settings and flipped the orders. The reason I actually published this, is because people have been asking me what the best way to find the best settings for a...

Count:332
Name: Bollinger Bands Fibonacci Ratios Strategy
Description: Hello, everyone! We have just released an innovative strategy for TradingView. It allows you to identify price pivot points and volatility. This strategy is: User-friendly Configurable Equipped with Bollinger Bands and smoothed ATR to measure volatility Features Thanks to the BB Fibo strategy, you can: Trade stocks and commodities. Identify...

Count:332
Name: Stochastic Moving Average
Description: Hi all, This Strategy script combines the power of EMAs along with the Stochastic Oscillator in a trend following / continuation manner, along with some cool functionalities. I designed this script especially for trading altcoins, but it works just as good on Bitcoin itself and on some Forex pairs. ______ SIGNALS ______ The script has 4 mandatory conditions...
Count:331
Name: RSI of Ultimate Oscillator [SHORT Selling] Strategy
Description: This is SHORT selling strategy with Ultimate Oscillator. Instead of drectly using the UO oscillator , I have used RSI on UO (as I did in my previous strategies ) Ultimator Oscillator settings are 5, 10 and 15 RSI of UO setting is 5 Short Sell ========== I have used moving averages from WilliamAlligator indicator --- settings are 10(Lips), 20(teeth) and 50...

Count:331
Name: Strategy Myth-Busting #7 - MACDBB+SSL+VSF - [MYN]
Description: This is part of a new series we are calling "Strategy Myth-Busting" where we take open public manual trading strategies and automate them. The goal is to not only validate the authenticity of the claims but to provide an automated version for traders who wish to trade autonomously. Our seventh one we are automating is the "Magic MACD Indicator: Crazy Accurate...

Count:331
Name: Keltner bounce from border. No repaint. (by Zelibobla)
Description: WARNING: despite of strategy doesn't use future data (not repaints) it doesn't consider broker`s commissions, which can be harmful for real life high frequency trading. Strategy works well on ES futures short bars like 1min.

Count:331
Name: DSS Bressert (Double Smoothed Stochastic) Strategy Backtest
Description: Double Smoothed Stochastics (DSS) is designed by William Blaw. It attempts to combine moving average methods with oscillator principles. You can change long to short in the Input Settings Please, use it only for learning or paper trading. Do not for real trading.

Count:330
Name: Hucklekiwi Pip - HLHB Trend-Catcher System
Description: The strategy was authored by Hucklekiwi Pip back in 2015 and is still being updated today. She says that the system was designed to simply catch short-term forex trends. At its heart, the system is a simple EMA crossover strategy with a couple of other indicators used for confirming entries. Strategy Rules See her original post here: www.babypips.com Be...

Count:330
Name: Simple Alt Coin Strategy - EMA and MACD w/Profit and Stop
Description: This script prints BUY and SELL signals based on settings you input. I use it to save time while scrolling through charts deciding what alts I want to look at. BUY SIGNALS Positive EMA Crossover Positive MACD Crossover Single Candle Gains SELL SIGNALS Profit Capture Stop Loss I don't trade based just on the BUY or SELL from this strategy, but I have found...

Count:329
Name: Forex SWING Trader
Description: This strategy is mainly designed for swing trading applied to FOREX. In this case we make use of 2 moving averages but with different time frame, lets say 1h and 1 day. When they cross above we would initially have a long trade, but in this strategy we trade it in reverse, so we would actually enter a short position. The same for short trade. At the same time...

Count:329
Name: Breakout Trend Trading Strategy - V2
Description: This is an alternate version of Breakout Trend Trading Strategy - V1 Only difference is, this strategy places stop orders based on calculated targets whereas V1 waits for price to close target levels and then places market orders. Hence, you will receive the target prices before trade executes in strategy. Parameters are same as that of Breakout Trend...

Count:328
Name: Ichimoku Kinko Hyo: ETH 3h Strategy by tobuno
Description: Ichimoku Kinko Hyo strategy for long term trend trades of Ethereum . Optimized for 3H ticks.

Count:328
Name: Lawyers Trend Pro Strategy
Description: This indicator basilcy has 1 line This indicator basicly using 2 different calculations average. And you can see this average as line on this script. This line has 2 functions 1. Buy and Sell Strategy -İf the line colored BLUE this means you can BUY (Long) -İf the line colored RED this means you can SELL (Short) As you can see the picture you can...

Count:328
Name: Renko Strategy with Ema against price crossover/under
Description: Renko Strategy with Ema against price crossover/under

Count:327
Name: MultiCross
Description: Quad-HullMA-cross & VWMA & MacD & TSI combination Made for 4H - other timeframes unkown result.

Count:327
Name: BankNifty 5min Supertrend Based Strategy
Description: BankNifty 5min Supertrend Based Strategy, Intraday. Work Best at 5mint chart on BankNifty. The strategy is designed to trade using the Supertrend indicator with session-based rules, and risk management. It allows for customization through input variables and aims to provide a clear visual representation of the Supertrend by changing the color . The...

Count:327
Name: breakout crossover 4H 1D
Description: Hi, this script is crossover between breakouts of 4H and Day timeframe. It also checks candlestick patterns before opening trades. Red horizontal line acts as support and resistance of Daily timeframe. You can close trades at next signal or at High/Low. Enjoy trading.

Count:326
Name: robotrading ZeroCCI
Description: It was not me who authored the strategy. I do not know who the real author of this strategy is. I read about it on wikipedia :) And decided to test the strategy on the cryptocurrency market. It turned out that this strategy really works. The strategy is very simple. Indicator CCI indicator with default settings is used. The settings can be changed. Nothing...

Count:326
Name: Setup Trend Following Bollinger Bands - Valente
Description: Buy when the candle closes above upper BB Sell when the candle closes bellow lower BB Stop always on base line

Count:325
Name: Multifactor Inverse Fisher Strategy (ps4)
Description: Best for higher time frames - 30m, 1H, 2H, 3H, 4H, D this strategy uses several factors that are pushed through an Inverse Fisher Transform (IFT). The higher the TF, the better the performance, up to 98%, but the number of deals tends to drop). Middle time frames (5m, 15m) look viable with Scaled Price (Scaled %P) and MFI factors. The factor list can be extended...

Count:325
Name: VCP pivot buy
Description: It will buy the breakout of the pivot in a bullish trend which is defined by the Mark Minervini stage 2 template Set the stop loss% and Target% in your favor ( recommend the stoploss% as the low percentile atrp ) It helps indicate the contraction point so that we can have a low-risk entry of a buy point. It followed the strategy of Mark Minervini. changing the...

Count:325
Name: Simple SuperTrend Strategy for BTCUSD 4H
Description: Hello guys!, If you are a swing trader and you are looking for a simple trend strategy, you should check this one. Based in the supertrend indicator, this strategy will help you to catch big movements in BTCUSD 4H and avoid losses as much as possible in consolidated situations of the market This strategy was designed for BTCUSD in 4H timeframe Backtesting...

Count:325
Name: MACD, backtest 2015+ only, cut in half and doubled
Description: This is only a slight modification to the existing "MACD Strategy" strategy plugin! found the default MACD strategy to be lacking, although impressive for its simplicity. I added "year>2014" to the IF buy/sell conditions so it will only backtest from 2015 and beyond ** . I also had a problem with the standard MACD trading late, per se. To that end I modified the...

Count:324
Name: [RichG] Easy MTF Strategy v1.1
Description: This is a second attempt at an easy to understand multiple time frame strategy. This one uses ATR for exits. If the position is long, and the price closes below the ATR multiplier, it triggers a close. If the position is short, and the price closes above the ATR/multiplier, it triggers a close. This generates a lot of little trades but is useful because it...

Count:324
Name: MARKET DYNAMICS HH LL BREAKOUT
Description: This strategy is designed for Bank nifty and Nifty Indices on 5 min chart.This positional strategy ,go long when the long signal came and exit your buy position when sell signal generated by the strategy and again go short for next trade e g . when long signal came buy bank nifty 25 quantity ,book your profit or loss in next sell signal and again made SELL...

Count:324
Name: Bull Flag v1.00
Description: Identifies the chart pattern we recognize as a Bull Flag, enters long, then exits 6 bars later. I do not claim this to be a good strategy, but a lot of people think the Bull Flag is (statistically) meaningful. This is a tool for you to test that claim. The exit after 6 bars is somewhat arbitrary, but it's basically "hold this position for a little bit to see if...

Count:324
Name: Volatility Range Breakout Strategy [wbburgin]
Description: The "Volatility Range Breakout Strategy" uses deviations of high-low volatility to determine bullish and bearish breakouts. HOW IT WORKS The volatility function uses the high-low range of a lookback period, divided by the average of that range, to determine the likelihood that price will break in a specific direction. High and low ranges are determined by...

Count:323
Name: Fancy strategy alerts example [QuantNomad]
Description: Alerts on strategies were introduced just recently in TradingView. These alerts have an alert_message placeholder which allows you to compose in PineScript very complex alerts and insert quite a lot of information in them. This is just very simple example of how they can look like.

Count:321
Name: Autoview Build-a-bot - 1m chart
Description: THIS IS NOT MINE i configured every input for the best performance on BTC/USD 1m chart the original is awesome (no repaint)

Count:320
Name: [STRATEGY] Follow the Janet Yellen
Description: In the era of central bank's helicopter money, the market will always be skyrocketing up and up given enough time. What's the strategy to profit from indices? Only short the market when its in a state of euphoria /irrational exuberance bubble, or sell when it is confirmed (20% drawdown). Otherwise, you really have no reason not to long at every chance. ...

Count:319
Name: MVRV Z Score and MVRV Free Float Z-Score
Description: IMPORTANT: This script needs as much historic data as possible. Please run it on INDEX:BTCUSD , BNC:BLX or another chart of sufficient length. MVRV The MVRV (Market Value to Realised Value Ratio) simply divides bitcoins market cap by bitcoins realized market cap. This was previously impossible on Tradingview but has now been made possible thanks to...

Count:319
Name: [ZL] ADX+RSI (Long Entries and Exits only)
Description: A popular strategy which combines Average Directional Index and RSI. In this version, we coded for only LONG entries and exits. Created by Shanghai Reed Asset Management Co., Ltd.

Count:318
Name: Exit Strategy is important than Entry Strategy!
Description: Exit Strategy is important than Entry Strategy! Simple strategy get large profit!

Count:318
Name: Combo Backtest 123 Reversal & TEMA1
Description: This is combo strategies for get a cumulative signal. First strategy This System was created from the Book "How I Tripled My Money In The Futures Market" by Ulf Jensen, Page 183. This is reverse type of strategies. The strategy buys at market, if close price is higher than the previous close during 2 days and the meaning of 9-days Stochastic Slow...

Count:318
Name: Excitement - Crypto Surfer v1
Description: For those of us who need more excitement in our crypto journey besides just HODL, here’s a simple crypto robot that trades on the hourly (1H) candles. I call it the Crypto Surfer because it uses the 20 and 40 EMAs (Exponential Moving Averages) to decide when to enter and exit; price tends to “surf” above these EMAs when it is bullish, and “sink” below these EMAs...

Count:318
Name: Powerfull strategy MACD + RSI + Stoch buy on High exit on ATR
Description: My strategy uses a combination of three indicators MACD Stochastic RSI . The Idea is to buy when ( MACD > Signal and RSI > 50 and Stochastic > 50) occures at the same time the BUY STop we place on previous day HIGH We exit on Take profit or Stop loss which is calculated by ATR (10) or on the opposite signal "Volatility breakout" This strategy works well on...

Count:318
Name: MacD 200 Day Moving Average Signal Crossover Strategy
Description: This works on most time frames, but I noticed the 4 hour for BTCUSD on coinbase seems to work well as an example. The strategy is pretty simple. I was inspired by a youtube video that said to backtest their strategy so I did. Most of the time it doesn't work but sometimes it's pretty good as in the case I showed. Basically, you buy if the MacD crossers over...

Count:318
Name: Channels Strategy [Dimkud]
Description: Channels trading Strategy. Based on "Channels Strategy" by JoseMetal. To the original strategy added additional options and filters : Static SL/TP in percents (%), time delay between orders, ATR Filter, second Keltner Channel (Multi TimeFrame). Interface translated to English. Were good backtest results on many crypto tokens on 15m - 45m - 1h periods. Mostly...

Count:318
Name: PSAR BBPT ZLSMA BTC 1min
Description: Long entry: PSAR gives buy signal BBPT prints green histogram ZLSMA is below the price ZLSMA has uptrend SL is smaller than the max SL Optional Sessions and EMA filters Short entry PSAR gives sell signal BBPT prints red histogram ZLSMA is above the price ZLSMA has downtrend SL is smaller than the max SL Optional Sessions and EMA filters SL: Placed below...

Count:317
Name: Low Scanner strategy
Description: This is the strategy I made using low scanner there is no repaint as there is no security at all the exit is by using multiple exit point by equity shown in the script of adolgov so you can set the low low scanner to any position you want by no security MTF (look on the study for detail about it) the exit you set acording to % and the equity as suggested by...

Count:317
Name: Bear & Bull Zone Signal Strategy
Description: Since I love to mix and match, here is something fresh and that actually works on the breakout of Ethereum without losing your ass on lagging indicators. It blends some of the nice parts of my previous scripts while moving to big boy pants with a twist on the Fibonacci retracement using SMA and EMA at multiple levels to do a sanity check. Is it too good to be...

Count:317
Name: QuantNomad - Significant Pivot Reversal Strategy
Description: I'm working on improving the Pivot Points Reversal Strategy. As one of the ways to filter out insignificant levels I decided to check that pivot point is not above/below neighbors, but check that it's above/below at least by a certain amount. I use ATR, so in params, you can set length of ATR and also ATR multiplier. The new level will be calculated only if PP...

Count:317
Name: Crossing Ema Signals by Sedkur
Description: Gives an signals when 2 Ema's cross. You can - change EMA values - change the signal start year

Count:316
Name: WOW no repainting and no security() call! 100% real results!
Description: If you couldn't tell by the title, this is a joke lmao. TV has an awful backtesting engine and I just wanted to prove this with a super simple script. We buy when close > open and sell when close < open. That's it. There is also some risk management and trade closing when we reach a certain drawdown, but wait! TradingView doesn't know what equity drawdown...

Count:316
Name: Parabolic SAR Strategy with good parameters
Description: I tested it on EURUSD with 2% profit: Set input parameters like here: screenshots.firefox.com

Count:315
Name: Breakout Scalper (Session)
Description: This is a twist on my on my Breakout Scalper strategy that limits trading to a user-configurable session Find the original "Continuous" version of the scalper here: The breakout scalper is based on "slow" and "fast" donchian periods. In this version, the "slow" donchian is in fact the Day's high/low. This important difference means that we will always be...

Count:315
Name: Strategy - Profit Maximizer by PMax
Description: It is a small modification to the "Profit Maximizer Max" script to make it a strategy by date range.

Count:314
Name: Laguerre-based RSI Backtest
Description: This is RSI indicator which is more sesitive to price changes. It is based upon a modern math tool - Laguerre transform filter. With help of Laguerre filter one becomes able to create superior indicators using very short data lengths as well. The use of shorter data lengths means you can make the indicators more responsive to changes in the price. You...

Count:313
Name: Pivot Moving Average steteggy
Description: this Pivot Moving Average steteggy works best on a chart --->>Above 100$ crypto Sniper is very profitable in terms of% good trades It will perform very well on 1-5X Leverage (Solid leverage, not variable depending on the volume ) TP: 0.9 % SL : 5.5 %

Count:313
Name: Co-relation and St-deviation Strategy - BNB/USDT 15min
Description: This indicator based on statistical analysis. it uses standard deviation and its co-relation to price action to generate signals. and following indicators has been used to calculate standard deviation and its co-relation values. finally it is capable to identify market changes in bottoms to pic most suitable points. 1. Parabolic SAR (parabolic stop and reverse)...

Count:313
Name: Best TradingView Strategy - For NASDAQ and DOW30 and other Index
Description: The script is totally based on momentum , volume and price. We have used : 1: Bollinger Band Squeezes to know when a breakout might happen. 2: Used Moving Averages(SMA and EMA) to know the direction. 3: The success Rate of this strategy is above 75% and if little price action is added it can easily surpass 90% success mark. 4: Do not worry about drawdowns , we...

Count:313
Name: Tema
Description: I have found that such simple crossover can show good results. Basically it has only 2 TEMA and nothing more. I don't know what else to write here. The code is simplest and has only one filter, which take into consideration the direction of chart.

Count:312
Name: Catching the Bottom (by Coinrule)
Description: This script utilises the RSI and EMA indicators to enter and close the trade. The relative strength index (RSI) is a momentum indicator used in technical analysis. RSI measures the speed and magnitude of a security's recent price changes to evaluate overvalued or undervalued conditions in the price of that security. The RSI is displayed as an oscillator (a line...

Count:312
Name: VRSI-MARSI Strategy
Description: I wanted to create an indicator which resembles price movement, aside to volume movement. The "yellow-blue" line is the MA(5) of the RSI (9) of closing price. The "orange" line is the MA(5) of the RSI (9) of Volume . (Default plot of RSI and VRSI is not visible but can be made visible ("Settings" > "Style" > set "Opacity" of "RSI & VRSI")) The Long (Buy)...

Count:312
Name: 15 Minute Gold Trend-Following Strategy
Description: This is the main strategy that I will be forward testing on demo for a month or two, then making it an EA in MetaTrader4 You can see the code for yourself this time, all the strategy is, is a crossover of various moving averages. Commission included, $10,000 account. Results over the past 3 months, beginning in January 2017.

Count:312
Name: MESA + Volume + RSI Decision Points Strategy
Description: The WHAT =============> Combination of 3 indicators, first 2 are to get entry points, the last one (MESA) is to get exit points: 1) "Koalafied Volume Extension" by @Koalafied_3 - used to detect whether current trend candles are supported by volume 2) "Koalafied RSI Decision Points" by @Koalafied_3 - another indicator used to detect trend momentum 3) "Mesa...

Count:312
Name: RW Simple Pairs Trade
Description: A Simple Implementation of a Pairs Trading Strategy It uses a simple moving average of specified length (default = 20) and enters at cutoffs set by Entry ZScore. Trades are exited at the moving average. It is intended to be run on pairs of stocks. To Spread KO and PEP, for example, use the ticker KO / PEP * 1000 To visualise the trade better add Bollinger...

Count:311
Name: Reversal with Bollinger Bands + RSI + ADX + ATR (Upgraded)
Description: Hi, Welcome to my 4th script. Someone asked me some questions about the Bollinger Band strategy I previously published. When I went back to my published script I couldn't help myself but simply try and make it better. Which I did. Since I've published that script, I've gained much more knowledge about how Pinescript functions. As well as gaining more and more...

Count:311
Name: Crypto RSI with RVI Strategy
Description: This is a long only strategy adapted for crypto market. Its idea is to take the most juice out of a long trend and cut the losses as soon as possible. For this , its components are RSI with a very big length - 100 or 200 preferably and RVI. Rules for entry If RVI is in the buy zone and we have a crossover from RSI with the overbought level. Rules for...

Count:311
Name: DI Crossing Daily Straregy HulkTrading
Description: Simple strategy based on crossing DI+ and DI- and Average True Range. Long entry when DI+ crossover DI- Short entry when DI+ crossunder DI- Stop Loss and Take Profits based on Average True Range. Default values are 1*ATR(14) for stop loss and 2*ATR(14) for Take Profit. Risk reward 1 to 2 ratio. Recommended default values, but you can change it if you...

Count:310
Name: SuperB By RafaelZioni
Description: This strategy is based on an indicator called "SuperB", created by RafaelZioni. All the credits of this script belong to him. All I did was converting the indicator to strategy using the buy/sell indicators, so you can back-test it easily.

Count:310
Name: Combo Backtest 123 Reversal & Volume SMA
Description: This is combo strategies for get a cumulative signal. First strategy This System was created from the Book "How I Tripled My Money In The Futures Market" by Ulf Jensen, Page 183. This is reverse type of strategies. The strategy buys at market, if close price is higher than the previous close during 2 days and the meaning of 9-days Stochastic Slow...

Count:310
Name: Combo Backtest 123 Reversal & Stochastic RSI
Description: This is combo strategies for get a cumulative signal. First strategy This System was created from the Book "How I Tripled My Money In The Futures Market" by Ulf Jensen, Page 183. This is reverse type of strategies. The strategy buys at market, if close price is higher than the previous close during 2 days and the meaning of 9-days Stochastic Slow...

Count:310
Name: Sine Wave Theory
Description: There are some ideas out there that the market is like a collection of quantum events and that it could all be broken down into sine waves. I created this script to put that to the test. The idea is simple, I tested 3 different factors that could be put into sine wave form. 1.) Bar Change 2.) Volume Average Change 3.) Coin Flip For the bar change, I...

Count:310
Name: Hulk Grid Algorithm - The Quant Science
Description: Grid-based intraday algorithm that works 50% in trend following and 50% in swing trading. Orders are executed on a grid of 10 levels. The grid levels are dynamic and calculated on the difference between the previous day's open and close. The algorithm makes only long trades based on the following logic: 1. The daily close of the previous day is analyzed, the...

Count:310
Name: Super indicator Strategy
Description: This is the strategy for Super indicator in reality we bet buy and sell signal on the info panel when its in open ,and it test result TV always put 1 candle after close so this screw up the results for this indicator for shorter tf increase Piz level to best fit, for longer tf you need short piz

Count:309
Name: Hull Kaufman SuperTrend Cloud (HKST Cloud)
Description: TLDR: This is a long only trend following system that uses highest and lowest values of three trend following indicators to form a "cloud". Enter when the candle high crosses above the highest band. Close if the low or close crosses below the lowest band. 3 indicators 1. Kaufman Adaptive moving Average - set at 20 2. Hull Moving Average (of the Kaufman Adaptive...


Count:309
Name: MACD_SAR
Description: ParSar and MACD strategy depends on the crosses of PARSAR indicator above/below the closing price and is filtered by the MACD indicator. it yields good profits on stocks. however, it doesn't work very well for Forex if you want to use it on forex please apply it to higher time frame starting from 4H.

Count:308
Name: Distance Oscillator Strategy- evo
Description: I described the indicator in the link below, this is a strategy version to test settings.

Count:308
Name: Trend Trader Strategy Backtest
Description: This is plots the indicator developed by Andrew Abraham in the Trading the Trend article of TASC September 1998 You can change long to short in the Input Settings Please, use it only for learning or paper trading. Do not for real trading.

Count:308
Name: Pinbar trailing stop strategy
Description: The strategy finds the nearest pinbar pattern and opens a position (long or short). You choose your take profit and stop loss multiplier. Take Profit - X times the pinbar size from it's highest point. Stop loss - X times the pinbar size from it's lowest point. You can find more detailed screenshots and the source-code on my github page: ...

Count:308
Name: Scaled Normalized Vector Strategy, ver.4.1
Description: This modification of the Scaled Normalized Vector Strategy uses trailing stops and is optimized for lower TFs.

Count:307
Name: Super Scalp 007
Description: BYBIT:ETHUSDT Enjoy the super scalp strategy... created by the hackegs.

Count:307
Name: Volume-Weighted Supertrend Strategy [wbburgin]
Description: This is a script that can be used as a strategy or a standalone indicator. The Volume-Weighted Supertrend is a supertrend based on a rolling VWAP, instead of a normal price source. The strategy has two components - a supertrend based off of this VWAP (shown on the chart) and a supertrend from volume itself (not plotted on the chart directly). The supertrend from...

Count:307
Name: Swing VWAP Crypto and Stocks Strategy
Description: This is a strategy designed for swing trading on markets such as crypto and stocks. Its components are: VWAP Time Management Risk management Rules for entry: We entry only on Monday, if our close of the candle crossed above VWAP Rules for exit We exit always on Sunday or if we either hit the TP/SL levels. If you have any questions let me know

Count:307
Name: [fikira] Fibma/Fibema Strategy
Description: My strategy regarding the Fibma/Fibema lines (also see my Fibma/Fibema study) You can enable/disable each strategy to see what works best in what timeframe Thanks!

Count:307
Name: [RS]Function Martingale Multiplier - MA Crossover Bias V1
Description: EXPERIMENTAL: WARNING: Martingale is subject to HUGE drawdown spikes, use at your own risk! updated function to also double(aply multiplier) on even trades, example with a MA's crossover.

Count:306
Name: Triple RSI strategy
Description: This strategy is commonly used both in forex and stock markets for reversal trading. when the rsi line reaches and crosses simultaneously at 3 rsi setups i.e at 7, 14, and 21, a signal is generated. This strategy works best in 1-hour timeframe. It provides over 60 to 80 percent accuracy in 1-hour timeframe. In the stock market, this strategy provides an...

Count:306
Name: Buy The Dips in Bull Market (by Coinrule)
Description: During a Bull market, beating the market, it's challenging. Trading strategies that buy the dips represent one of the best approaches to surf the trend and optimize the returns. The main obstacle is to gauge the dip's magnitude properly and set up the take profit level accordingly. The RSI is an excellent tool to catch price drops as it adjusts the entry to the...

Count:306
Name: Stock Market Strategy : VWAP, MACD, EMA, Breakout, BB
Description: Hello there, Today I bring you a stock market strategy, specialized in NASDAQ stocks. Its a daytrading strategy, that can only do a max of 1 trade per day. In this case it only trades the first 2 opening hours of the market. The rules are simple : We follow the trend based on a big EMA, in this case 200, after that, we check for VWAP direction , then, we...

Count:305
Name: MACD + Stochastic + RSI (Long + Short)
Description: My strategy uses a combination of three indicators MACD Stochastic RSI . The Idea is to GO LONG when ( MACD > Signal and RSI > 50 and Stochastic > 50) occures at the same time and GO SHORT when ( MACD < Signal and RSI < 50 and Stochastic < 50) This strategy works well on futures and stocks especially during market breaking up after consolidation The best...

Count:305
Name: I Like Winners And Hate Loosers!
Description: This simple long only strategy aims to be in trending markets, maximizing win/loss ratio and keep drawdown low (at the expense of net profit).

Count:304
Name: Histogram Trends Strategy by Sedkur
Description: This gives to you buy-sell signal with MACD's histogram trends. Use "Fast and Slow length" and "Trend of Histogram Number" inputs to take less or more signal. "Trend of Histogram Number" : This means how many histogram bars the trend continues before trading.

Count:304
Name: MACDouble & StochRSI w/ safeties and variable time interval v0.3
Description: UPDATE: IMPORTANT!!! MAKE SURE "RECALCULATE AFTER ORDER FILLED" IS CHECKED. I will have it on by default in the future. This is a continuation of my previous scripts of two MACD indicators with a Stochastic RSI indicator. New features: - Alternate MACD time interval You can now set the time interval for the second MACD indicator to a different resolution...

Count:304
Name: ICHIMOKU LAG LINE STRATEGY
Description: Strategy Test using Ichimoku Cloud and lag line.

Count:304
Name: My ETH/BTC 5 min Strategy
Description: Hello, beginner in trading here. Use this at your own risk. Commission : 0.05% Time Unit : 5 min Backtest range : 15 days (looking like that is the maximum in 5 min UT) Initial capital : 1000€ How it works : Long entries and exits. That's all, no pyramiding, no shorting. It takes the first buy signal (green triangle) and the first sell signal (yellow...

Count:303
Name: Moving Average Mean Reversion Strategy
Description: A basic mean-reversion strategy. Shorts when the close is 10% above the MA, and goes long when it's 10% below the MA.

Count:303
Name: VIP
Description: This indicator is using the modified "SSS". This strategy uses combined indicators to create LONG entry points, the strategy was first found by saudALThaidy. How to use: Open your asset and pick a timeframe between 5min and 2hours (recommended: 30min, 45min), the strategy will give entry points itself, you can monitor and take profit manually(recommended), or...

Count:302
Name: SMA Cross Entry & Exit Strategy
Description: This is a TradingView Strategy Script meaning you can't execute real trades using your exchange API connected to your TradingView account, it is designed for backtesting only This is a basic backtesting script for charting the bullish and bearish cross of two user defined simple moving averages, select the cog next to the name of the script ON the price chart in...

Count:302
Name: Key Reversal Up Backtest
Description: A key reversal is a one-day trading pattern that may signal the reversal of a trend. Other frequently-used names for key reversal include "one-day reversal" and "reversal day." How Does a Key Reversal Work? Depending on which way the stock is trending, a key reversal day occurs when: In an uptrend -- prices hit a new high and then close near the previous...

Count:302
Name: Moving Average EMA SMA Cross Strategy
Description: Moving Average Cross EMA SMA Strategy Simple fast-slow MA crossover/crossunder strategy, has basic MA cross logic (long on crosssover and short on crossunder) and more complex logic where additional conditions must be met. For educational purposes.

Count:302
Name: Buy Dip Sell Rip Strategy
Description: This simple system buys the dip and sells the rip, depending on the trend of a long-term moving average. This strategy shows several interesting features. Applied to the S&P500, it still is a loser in a bear market, even though it achieves a 59% win rate. Overall, this shows the power of buying dips as an investment strategy, and shows promise as a base for...

Count:301
Name: Swing Multi Moving Averages Crypto and Stocks Strategy
Description: Simple and efficient multi moving average strategy combined with risk management and time condition. Indicators/ Tools used Multi selection moving average type like SMA , EMA , SMMA , VWMA , VIDYA , FRAMA , T3 and much more Limit 1 entry max per week, entry on monday exit on sunday or risk management tp/sl. Rules for entry: LONG:Close of the candle cross above...

Count:301
Name: Ichimoku Cloud Strategy
Description: Based on the trading strategy described at stockcharts.com See Also: - Backtesting and forwardtesting (of TradingView Strategies) - 9 Mistakes Quants Make that Cause Backtests to Lie - When Backtests Meet Reality - Why MT4 backtesting does not work

Count:301
Name: Legoux_MA<>Hull_MA
Description: Arnaud Legoux MA > Hull MA Long Hull period default, for use with low timeframe probably not as good if a trading commision is applied etc script open, help yourself :)

Count:300
Name: [KL] Bollinger bands + RSI Strategy
Description: This strategy is based on two of my previous scripts, one called “RSI14 + 10”; the other one called “Bollinger Bands Consolidation”. At its core, it combines the main setups from each of those two scripts but excludes the auxiliary features that were considered as experimental. This strategy will identify periods of squeeze, and then enter long during...

Count:300
Name: Buy The Dip - Does It Work?
Description: Buying the dip has become a meme in crypto, but does it actually work? Using this script you can find out. The dip is defined here as the average true range multiplied by a number of your choosing (dipness input) and subtracted from the low. When price crosses under the dip level, a long is initiated. The long is then closed using a timestop (default value 20...

Count:299
Name: SQZ Multiframe Strategy
Description: This is a first attempt to automate what my current strategy when trading is. It uses 2 timeframes: the one you are currently using to see the chart and an "anchor trend" which is a higher order frame. Supported timeframes are: 1m, 5m, 15m, 30m, 1H, 4H, 1D, 1W The Strategy relies on two indicators: Squeeze Momentum Indicator CMF How does it works? It...

Count:299
Name: [XC] Adaptive Strategy V3 - Ratio OCHL Averager no repaint
Description: Here is an update with PS4 and a no repaint version. As an trading example I have chosen XBTUSD on a 1 min time frame. I think it works pretty well on the first glance. But to know if it works a check over a longer time is necessary. Thanks to alexgrover for the "Ratio OCHL Averager" script.

Count:299
Name: QuantNomad - EVWMA MACD Strategy
Description: Pretty simple EVWMA (Elastic Volume Weighted Moving Average ) MACD Strategy. EVWMA is a quite interesting moving average where the period of the MA is defined from the volume itself. It incorporates volume information in a natural and logical way. The EVWMA can be looked at as an approximation to the average price paid per share. As a volume period, you can use...

Count:299
Name: Cheat Code- Example 1; Short-Term; Follow the Trend
Description: BINANCE:BTCUSDT ; BINANCE:ETHUSDT ; BINANCE:FILUSDT ; This strategy is simple and easy to read and takes advantage of conditional signs of trend reversals. It works best in 10-minute time frames for most large and mid-cap crypto. This code is a tutorial for creating a profitable yet easy strategy, and hopefully, it can be put to good use :)

Count:298
Name: DEMA Double Exponential Moving Average Strategy
Description: @Moneros 2017 Based on The DEMA is a fast-acting moving average that is more responsive to market changes than a traditional moving average en.wikipedia.org !!!! IN ORDER TO AVOID REPAITING ISSUES !!!! !!!! DO NOT VIEW IN LOWER RESOLUTIONS THAN res/2 PARAMETER !!!! for example res = 120 view >= 60m res = 60 view >= 30m the length of the DEMA...

Count:298
Name: Gandalf Project Research System
Description: This is an adapted version of The Gandalf Project Research System strategy that was discussed by Domenico D’Errico and Giovanni Trombetta in “System Development Using Artificial Intelligence.” The code was converted from NinjaTrader 8 to TradingView with two additional options: 1) to change the quantity to a fixed number and 2) relax the exit condition if Use Alt...

Count:298
Name: Gap Reversion Strategy
Description: Today I am releasing to the community an original short-term, high-probability gap trading strategy, backed by a 20 year backtest. This strategy capitalizes on the mean reverting behavior of equity ETFs, which is largely driven by fear in the market. The strategy buys into that fear at a level that has historically mean reverted within ~5 days. Larry Connors has...

Count:298
Name: SB_Wavetrend_Oscillator
Description: A take on LazyBear's Wavetrend_Oscillator The idea is bit modified. Original Idea: When the oscillator is above the overbought band (red lines) and crosses down the signal (dotted line), it is usually a good SELL signal. Similarly, when the oscillator crosses above the signal when below the Oversold band (green lines), it is a good BUY signal. Modified...

Count:298
Name: Elder Ray (Bear Power) Strategy Backtest
Description: Developed by Dr Alexander Elder, the Elder-ray indicator measures buying and selling pressure in the market. The Elder-ray is often used as part of the Triple Screen trading system but may also be used on its own. Dr Elder uses a 13-day exponential moving average (EMA) to indicate the market consensus of value. Bear Power measures the ability of sellers to...

Count:298
Name: Double 7's Strategy
Description: Strategy described in the book "Short Term Trading Strategies that Work", written by Larry Connors and Cesar Alvarez. It is the simplest strategy I know and has only 3 rules: - Price must be above the arithmetic moving average of 200 periods. - Buy when the price closes below the closing of the last 7 days. - Sale when the price closes above the closing of the...

Count:297
Name: Simple Trailing Buy & Stop Strategy
Description: Allows you to backtest a simple percentage based trailing stop, with a trailing buy. Experiment with different percentages on different timeframes for different charts. For BTCUSD, on daily 4.3% stop and 1.9% buy works well, while on 4hr a 1.5% stop and 1.9% buy works best. Please comment with any other combos that work well for you on different markets or timeframes.

Count:296
Name: Multi Trend Cross Strategy Template
Description: Today I am sharing with the community trend cross strategy template that incorporates any combination of over 20 built in indicators. Some of these indicators are in the Pine library, and some have been custom coded and contributed over time by the beloved Pine Coder community. Identifying a trend cross is a common trend following strategy and a common custom-code...

Count:296
Name: Pivot Reversal Strategy - FIGS & DATES 2.0
Description: Simple Pivot Reversal Strategy with some adding settings. Date Range: To test over specific market conditions. Initial Capitol: $10K - This is a more realistic representation of funds used this strategy (for me anyway). The default of $100K can give different results (usually better) than when using a smaller balance. Order Size: 100% Equity - These trend...

Count:296
Name: Forex bot full strategy with risk management
Description: This is a full strategy designed for forex major pairs, specially EUR/USD using 1h time frame chart. Its components are 200 EMA MACD OBV PSAR RIsk management with tp and sl movements Rules for entry For long = Previous histogram from MACD was below 0 and current one is above 0. CLose of a candle is above EMA 200 , OBV oscillator is negative and we have an...

Count:296
Name: Newton theory (Bollinger Band Breakout)
Description: Initial capital 1000 USD Order size 10% Commission 0.3% with slippage Timeframe 4h This is Simple Bollinger Band Trend find out strategy. I'm using the usual trailing offset as an exit for this strategy. using 1x leverage to go long short within 3years backtest result more then 200% for all usd pair. in next version i will try to find out more optimize...

Count:296
Name: Indicators & Conditions Test Framework [DTU]
Description: Hello All, This script is a framework to build strategies by combining indicators and conditions (long, short, exits). You are able to analyze your strategies in realtime by changing the input parameters related to indicators, conditions and their combinations. OVERVIEW With this Study/Strategy framework, you will be able to create strategy conditions,...


Count:295
Name: Wavetrend strategy with trading session for any time chart
Description: Hello there Today I am glad to provide you a strategy based on the wave trend oscillator. If you want to use it as an indicator, just disable long and short to not make any shops. It works on all time frames. The way it works its like an RSI . We have overbought and oversold levels, and together with a channel and length we calculate the wave trend. And then...

Count:295
Name: Noro's ShiftMA Strategy v1.1
Description: For crypto, any timeframe. In the strategy of ShiftMA the feature to open short positions is added. Marginal trade isn't used (if not to use short positions). The red line - short positions open here. The lime line - long positions open here. Becoming blue the line - SMA - here are closed all positions. For "BTC/USD" or "ETH/USD": SMA period = 3 Source for...

Count:294
Name: Smash Day Pattern (Type B)
Description: oxfordstrat.com This is a pretty interesting strategy I found at the link above ^. I got pretty subpar results on equity, but on commodities it seems to work well as that is the same conclusion they came to in their research. I dropped the atr code that they had used because I couldn't think of anytime that would trigger where the hard stop would not have...

Count:294
Name: Heikin Ashi Strategy Example
Description: A strategy which calculates it's entry/exit conditions using HeikinAshi prices and executes orders using real prices (usual candles). NOTE that strategy should be added on a usual candles chart. Heikin Ashi prices are requested in the Pine code using 'security' function. This is a possible solution to a question getsatisfaction.com =19502808#reply_19502808

Count:294
Name: Pivot Point SuperTrend Strategy +TrendFilter
Description: In the dynamic world of financial markets, traders are always on the lookout for innovative strategies to identify trends and make timely trades. The "Pivot Point SuperTrend strategy +TrendFilter" has emerged as an intriguing approach, combining two popular indicators - Pivot Points and SuperTrend, while introducing an additional trend filter for added precision....

Count:294
Name: FRAMA & CPMA Strategy [CSM]
Description: The script is an advanced technical analysis tool specifically designed for trading in financial markets, with a particular focus on the BankNifty market. It utilizes two powerful indicators: the Fractal Adaptive Moving Average (FRAMA) and the CPMA (Conceptive Price Moving Average), which is similar to the well-known Chande Momentum Oscillator (CMO) with Center of...


Count:293
Name: (IK) Stoch-60-15
Description: This strategy uses 60 minute and 15 minute stochastic data to determine entry and exit; it only executes long trades. I've only used this on BTC/USD, but I imagine the concepts employed should hold for any ticker The script builds a simple Stochastic indicator for the current timeframe, and it also plots a single stochastic line for a higher resolution time...

Count:293
Name: Pyramiding BTC 5 min
Description: The pyramide based on this script with his concent the strategy is the same as BTC 15 script (look at my open scripts) there it without pyramide you can use the filter if you wish one trick if you want it to be more accurate (not mean more profit is to reverse the long and short in the filter ' just it will lose less) about the strategy of pyrimde you can read...

Count:293
Name: Peak Valley Estimation Strategy
Description: Introduction Its the first strategy that i post here, so don't expect ground breaking stuff, when testing my indicators i always used prorealtime and not tradingview. This strategy use signals generated by the peak/valley estimator indicator i posted long ago, i think the signals generated where sometimes quite accurate in some markets thus providing potential...

Count:292
Name: Breakout Strategy #1
Description: Breakout above previous pivot points trigger a long. Close below pivot lows trigger the exit. Most effective during trends.

Count:292
Name: MACD Willy Strategy
Description: This strategy is mainly developed for scalping / intraday trading. It could potentially be used to identify entry/exit signals for short term options trading. It performs decently well on popular stocks when used on time frames between 5 min to 15 min using regular session bar data. It combines 3 popular indicators, EMA, MACD, and William %range, to generate both...

Count:291
Name: Combo Backtest 123 Reversal & FX Sniper: T3-CCI
Description: This is combo strategies for get a cumulative signal. First strategy This System was created from the Book "How I Tripled My Money In The Futures Market" by Ulf Jensen, Page 183. This is reverse type of strategies. The strategy buys at market, if close price is higher than the previous close during 2 days and the meaning of 9-days Stochastic Slow...

Count:291
Name: Hull Moving Average Cloud v2
Description: Hull Moving Average Cloud, is not the normal Hull crossover, instead opens orders at cross of price and alternative Hull MA configuration (stretches/shrinks with momentum) Has history settings, Commission already included in result. Only looks into past, should be no repaint (im sure the trolls will correct me if im wrong, thankyou trolls i can always count on...

Count:291
Name: Noro's ZZ-4 Strategy
Description: Indicator by Noro The Price Channel indicator is used. Used OHLC4 to calculate the values of the Price Channel indicator. Red lines are drawn from the lower boundary of the price channel. Lime lines are drawn from the upper boundary of the price channel. Trading You need to use market stop orders. If the price is higher than the lime line, open the long...

Count:291
Name: Gaussian Detrended Reversion
Description: This strategy, titled "Gaussian Detrended Reversion Strategy," aims to identify potential price reversals using the customized Gaussian Detrended Price Oscillator (GDPO) in combination with smoothed price cycles. Key Elements of the Strategy: GDPO Calculation: The strategy first calculates the Detrended Price Oscillator (DPO) by comparing the close price to an...

Count:291
Name: Robot WhiteBox StopMA
Description: Lines Blue line = SMA = simple moving average Lime line = SMA percentage selected by the user Red line = SMA - percentage selected by user Stop orders The strategy uses market stop orders. For a backtest, you need to set a fee of the order maker. Strategy Reversible system. If a price is greater than a lime line, open a long position (and close a short...


Count:291
Name: Squeeze X BF 🚀
Description: Credit to LazyBear and Kiasaki for code used in this indicator. Squeeze Momentum indicator illustrates when a momentum squeeze is happening by calculating when Bollinger Bands are within a Keltner Channel. This simple strategy is based on when the momentum is crossing positive or negative. INSTRUCTIONS Green = Long Red = Short White = No Trade

Count:291
Name: Why is it ok to backtest on TradingView from now on!
Description: TradingView backtester has bad reputation. For a good reason - it was producing wrong results, and it was clear at first sight how bad they were. But this has changed. Along with many other improvements in its PineScript coding capabilities, TradingView fixed important bug, which was the main reason for miscalculations. TradingView didn't really speak out about...

Count:290
Name: Faytterro Estimator Strategy
Description: What is "Faytterro Estimator Strategy"? "Faytterro Estimator Strategy" is strategy of faytterro estimator. if you want to know more about faytterro estimator: What it does? It trades according to the signals given by faytterro estimator and some additional restrictions. How it does it? Using the faytterro estimator and the following variables, it gives buy...

Count:290
Name: Noro's 3Bars Strategy by Larry Williams
Description: Copy of trading system by Larry Williams. For Forex.

Count:290
Name: [STRATEGY] MA Cross Eleven
Description: This script is a crossing of eleven different MA, with alerts and SL and TP. The simplest is what works best... SMA --> Simple EMA --> Exponential WMA --> Weighted VWMA --> Volume Weighted SMMA --> Smoothed DEMA --> Double Exponential TEMA --> Triple Exponential HMA --> Hull TMA --> Triangular SSMA --> SuperSmoother filter ZEMA --> Zero Lag Exponential Using...

Count:290
Name: Combo Backtest 123 Reversal & Martin Pring's Special K
Description: This is combo strategies for get a cumulative signal. First strategy This System was created from the Book "How I Tripled My Money In The Futures Market" by Ulf Jensen, Page 183. This is reverse type of strategies. The strategy buys at market, if close price is higher than the previous close during 2 days and the meaning of 9-days Stochastic Slow...

Count:289
Name: [Tutorial][RS]Working with orders
Description: a small tutorial to explain how to work with orders, comments in the script.

Count:289
Name: Noro's CrossLimit
Description: Strategy for altcoin/bitcoin currency pairs. Do not use for pairs of type coin/USD with this strategy. You need the taker fee to be zero, or ribate. Because this strategy has very frequent trades. A simple moving average (SMA) is used to determine the trend. If not enable Anti-Saw filter - If candle closing price is higher than SMA - uptrend started - If candle...

Count:289
Name: Noro's CrossMA
Description: Simple strategy. Price and moving average crossing. There is a choice of type of moving average. Moving average types SMA = Simple Moving Average EMA = Exponential Moving Average VWMA = Volume-Weighted Moving Average DEMA = Double Exponential Moving Average TEMA = Triple Exponential Moving Average KAMA = Kaufman's Adaptive Moving Average PCMA = Central line of...

Count:289
Name: Bollinger Bands Strategy with Intraday Intensity Index
Description: For Educational Purposes. Results can differ on different markets and can fail at any time. Profit is not guaranteed. This only works in a few markets and in certain situations. Changing the settings can give better or worse results for other markets. This is a mean reversion strategy based on Bollinger Bands and the Intraday Intensity Index (a volume indicator)....

Count:289
Name: Gann Trend Oscillator Backtest
Description: The Gann Swing Oscillator has been adapted from Robert Krausz's book, "A W.D. Gann Treasure Discovered". The Gann Swing Oscillator helps define market swings. You can change long to short in the Input Settings Please, use it only for learning or paper trading. Do not for real trading.

Count:288
Name: Swing Failure Reversal Strategy
Description: This strategy is using Swing Failure Patterns as a reversion indicator. The strategy automatically adapts itself to the timeframe of the current chart. Swing Failure Pattern occurs when the price trend fails to set new highs in uptrend or meet new lows in a downtrend. This pattern helps traders decide when to enter and exit the market. Usually, traders enter...


Count:287
Name: Combo Backtest 123 Reversal & Fractal Chaos Oscillator
Description: This is combo strategies for get a cumulative signal. First strategy This System was created from the Book "How I Tripled My Money In The Futures Market" by Ulf Jensen, Page 183. This is reverse type of strategies. The strategy buys at market, if close price is higher than the previous close during 2 days and the meaning of 9-days Stochastic Slow...

Count:287
Name: Heiken Ashi BF
Description: Heiken Ashi candles help us to identify a trend. This strategy simply enters a long when the Heiken Ashi candles turn green and a short when they turn red. Because of the way BTC price moves in medium term trends, this simple strategy seems effective. There is a rate of change function applied to avoid some of the choppy sideways action (thanks again to...

Count:287
Name: Gap Absorption Strategy
Description: Like the nature, markets don't like the void, and this is something we can take advantage of by trading gaps on some markets. This technique is well known, so I wanted to write a tiny script based on this strategy to get a bit more comfortable with it. IMPORTANT: Default parameters wont give you good trades on every markets, you need to modify these parameters...

Count:287
Name: [KL] BOLL + MACD Strategy v2 (published)
Description: This strategy will look for opportunities when price touches the lower Bollinger band, then enters Long when it anticipates a MACD crossover signal. Setup: on 1-day chart interval Exits when either (a) hitting trailing stop loss, or (b) meeting risk-to-reward, if defined by user.

Count:287
Name: Strategy Myth-Busting #3 - BB_BUY+SuperTrend - [MYN]
Description: This is part of a new series we are calling "Strategy Myth-Busting" where we take open public manual trading strategies and automate them. The goal is to not only validate the authenticity of the claims but to provide an automated version for traders who wish to trade autonomously. Our third one we are automating is one of the strategies from "The Best 3 Buy And...

Count:287
Name: Ichimoku Cloud Strategy Long Only [Bitduke]
Description: Slightly modificated and optimized for Pine Script 4.0, Ichimoku Cloud Strategy which, suddenly, good suitable for the several crypto assets. Details: Enter position when conversion line crosses base line up, and close it when the opposite happens. Additional condition for open / close the trade is lagging span, it should be higher than cloud to open...

Count:286
Name: Supertrend with TP by Furkan Sancu
Description: Simple Supertrend strategy with Take Profit levels. Note: Make sure TP amounts add up to 100. Opens a position with Supertrends strategy then adds Take Profit points with certain amounts of current position.

Count:286
Name: [MT Trader] Backtest template w/ Supertrend Strategy
Description: ---EN: In this strategy template you will find some functions already pre-programmed to be used in your strategies to speed up the programming process, among them we can highlight the default stop loss and take profit functions, which will help to set easily and quickly, defining the price range in which we want to prevent large losses or protect our profits from...

Count:286
Name: RSI Rising Crypto Trending Strategy
Description: This is crypto and stock market trending strategy designed for long timeframes such as 4h+ From my tests it looks like it works better to trade crypto against crypto than trading against fiat. Indicators used: RSI for rising/falling of the trend BB sidemarket ROC sidemarket Rules for entry For long: RSI values are rising, and bb and roc tells us we are not in a...

Count:286
Name: Monthly Strategy Performance Table
Description: What Is This? This script code adds a Monthly Strategy Performance Table to your Pine Script strategy scripts so you can see a month-by-month and year-by-year breakdown of your P&L as a percentage of your account balance. The table is based on realized equity rather than open equity, so it only updates the metrics when a trade is closed. That's why some...

Count:285
Name: ICHIMOKU Crypto Swing Strategy
Description: This is a crypto swing strategy designed for timeframes bigger than 1h. The main components are ICHOMOKU KDJ Average High Average Low Rules for entry For long: we have the ichimoku crosses between tenkan and baselines, we have a rising kdj line and at the same time we have a increase in the average high For short: we have the ichimoku crosses between tenkan...

Count:284
Name: Linear SSL Short
Description: This script consist of two parts: linear SSL and DEMA. The difference between original SSL and current is that it calculated by linear regression. The logic is simple: when SSL "crossunder" and DEMA is above the price - we get short signal. When price became above DEMA and SSL "crossover" - close short.

Count:284
Name: Mean Reversion Strategy v2 [KL]
Description: Description : This strategy will enter a position when the following conditions are met: a) Main signal: When source data (ATR) diverts from its moving average value, and b) Confirmation: If predicted direction of trend is favorable. Assumptions : During periods of high price volatility, ATR diverts from its moving average value. Eventually, ATR should...


Count:284
Name: 7-RSI strategy
Description: Hello, I've only been trying to learn PineScript for two months on my own, here I am posting a version of the strategy for a grid bot with 20 orders, order size 5%, earlier I tried to find something similar, but could not. Perhaps others, those who, like me, are just starting to learn PineScript, will find something useful. In the process of using grid bots, I...

Count:284
Name: $EURUSD 1 Minute Chart Strategy
Description: You must be using the renko chart with traditional settings with the block size set at .0001. This can be done by going to settings. Style at the bottom should be changed from ATR to traditional. The set the block size as .0001.

Count:284
Name: Historical Volatility Strategy Backtest
Description: Strategy buy when HVol above BuyBand and close position when HVol below CloseBand. Markets oscillate from periods of low volatility to high volatility and back. The author`s research indicates that after periods of extremely low volatility, volatility tends to increase and price may move sharply. This increase in volatility tends to correlate with the...

Count:283
Name: Moving Average Displaced Envelope Backtest
Description: Moving Average Displaced Envelope. These envelopes are calculated by multiplying percentage factors with their displaced expotential moving average (EMA) core. How To Trade Using: Adjust the envelopes percentage factors to control the quantity and quality of the signals. If a previous high goes above the envelope a sell signal is generated. Conversely,...

Count:283
Name: MACD, EMA, Know sure thing, Chopy Market - high adaptability
Description: Hey there :) This is the free version of the script. The following indicators / settings are missing: - Support and resistance zones - dynamic textboxes for alarms when using bots (3 Commas, Alertatron, etc.) - a table showing the current position, indicators and other important information With this script there is the possibility to completely customize the...

Count:283
Name: STRATEGY:RETRACEMENT
Description: This is a basic script meant to help you identify Fibonacci Retracement Levels. Based on the high and low lookback periods you input, it will draw lines for the highest high and lowest low for those times as well as the Fibonacci Retracement Levels in between.

Count:283
Name: Scripting Tutorial A - TManyMA - Stops
Description: This script is for a triple moving average strategy where the user can select from different types of moving averages, price sources, lookback periods and resolutions. Features: - 3 Moving Averages with variable MA types, periods, price sources, resolutions and the ability to disable each individually. - Crossovers are plotted on the chart with detailed...

Count:282
Name: MA_strategy
Description: MA strategy with selection of various MAs: SMA, EMA, TEMA, WMA, and HMA with custom length and time period.

Count:281
Name: Noro's SuperTrend Strategy v1.0
Description: The SuperTrend indicator is used. This indicator is necessary for definition of a trend. If now a uptrend and a candle red - to open a long position (and to close short) If now a downtrend and a candle green - to open a short position (and to close long)

Count:281
Name: "Golden buy" for cryptofutures (alerts for 3 commas/finandy)
Description: This script is a blend of open source cipher B indicator by VuManChu and Hammers & Stars strategy made by ZenAndTheArtOfTrading. "Golden buy" is based on divergencies and was considered as one of the top strategies for cryptotrading. So I used it for entrance point in this script. You can turn on opening short positions which are based on divergencies as well....

Count:281
Name: Consecutive Up/Down Strat + alerts via TradingConnector to Forex
Description: Software part of algotrading is simpler than you think. TradingView is a great place to do this actually. To present it, I'm publishing each of the default strategies you can find in Pinescript editor's "built-in" list with slight modification - I'm only adding 2 lines of code, which will trigger alerts, ready to be forwarded to your broker via TradingConnector...

Count:281
Name: kdj Strategy 41 - 31
Description: very profitable on 1D timeframe on btcusd or btceur


Count:281
Name: BB+AO STRAT
Description: to be used with AO, based on forex strat -- www.forexstrategiesresources.com works on 1/3/5/15/30 candles

Count:280
Name: Noro's Bands Scalper Strategy v1.5
Description: + Parameter: body lenght + Parameter: trend bars

Count:280
Name: Bollinger Band + RSI + ADX + MACD + Heikinashi
Description: This script takes into picture Bollinger Bands, RSI with a comparator value, ADX with a comparator value, and MACD with Heikinashi Direction THIS IS A LONG-ONLY STRATEGY. SHORT TRADES ARE NOT INCLUDED Strategy: The Strategy takes a trade only after ALL the following conditions are met. Candle low is lower than the Bollinger Lower band RSI is higher...

Count:280
Name: [-_-] Level Breakout, Auto Backtesting Strategy
Description: Description: A Long only strategy based on breakout from a certain level formed by High price. It has auto-backtesting capabilities (you set ranges for the three main parameters: Lookback, TP and SL; the strategy then goes through different combinations of those parameters and displays a table with results that you can sort by Percentage of profitable trades...

Count:280
Name: SlingShotStrategy
Description: Based on an existing SlingShotStrategy. Added the ability to set capital, and order limit in settings.. Back Testing is great. Plan to improve more, let me know what you think.

Count:280
Name: Noro's SimpleTurtle Strategy
Description: This is a highly simplified version of the Turtle strategy. It is very different from the original Turtle strategy. Lines 2 Donchian price channels are being created. Fast and slow. The number of candles for the channels is selected by the user. By default, 20 bars for fast and 50 bars for slow. Blue lines show a slow price channel. And used to enter positions....

Count:280
Name: Crypto rsi cci mf stoch rsi oscillators all in one strategy
Description: This is a strategy based on the popular oscillator like RSI, CCI, MF and Stochastic RSI oscillators. In this situation I use a very high length , 100 candles, and the middle point between overbought and oversold levels at 50. The entry for long is when all oscilators are above 50, and the exit is when they are below 50 + plus some minor modifications If you...

Count:279
Name: Easy to Use 50/100/200 Day Moving Average Strategy
Description: Whenever you see someone publish a chart or idea, what's the one thing you almost always see? Moving Averages! Many investors focus on these indictors solely as entry and exit points, so here's an easy to manipulate strategy to backtest and see if this is feasible on your security. CODE VARIABLES LINE 2 - Here you can change your currency and amount you want...

Count:279
Name: Crossover82%
Description: Experimental crossover strategy with over 80% performance.

Count:279
Name: Elliott Wave with Supertrend Exit - Strategy [presentTrading]
Description: ## Introduction and How it is Different The Elliott Wave with Supertrend Exit provides automated detection and validation of Elliott Wave patterns for algorithmic trading. It is designed to objectively identify high-probability wave formations and signal entries based on confirmed impulsive and corrective patterns. * The Elliott part is mostly referenced from...

Count:279
Name: Money maker EURUSD 15min daytrader
Description: VERY IMPORTANT : THIS STRATEGY WAS MADE WITH LEVERAGE IN MIND You need atleast 20X LEVERAGE ACCOUNT IN ORDER TO WORK PROPERLY. With high rewards come high risk . If you dont want to use leverage, use a risk % of less than 0.25 %. The below example is without use of leverage on a capital 100.000 risking only 0.25% on each trade This is a breakout strategy,...

Count:278
Name: Best Crypto DEMA Strategy Long only
Description: This is a crypto strategy suited for big time frames like 3h+. THIS IS A LONG ONLY STRATEGY , SUITED TO BEAT BUY AND HOLD ! It's a very risky strategy because it has no stop loss at all, so be extremely careful with it. This strategy is made of 2 DEMA a fast and a slow one. We have two rules : entry it's when we have a crossunder between the slow DEMA and...

Count:278
Name: Wyckoff Range Strategy
Description: The Wyckoff Range Strategy is a trading strategy that aims to identify potential accumulation and distribution phases in the market using the principles of Wyckoff analysis. It also incorporates the detection of spring and upthrust patterns. Here's a step-by-step explanation of how to use this strategy: Understanding Accumulation and Distribution...

Count:278
Name: EMA Candle Close Strategy
Description: This is a simple script which overlays the 200, 55, 21, 13 and 8 EMA's and suggest a buy and sell based on if the 8,13 and 21 EMA's have crossed the 55 EMA and the close is also above the 55 EMA for the candle. This is a popular strategy used and is best used on the Daily or the Hourly chart. In particular I have had success with the 'Daily' chart. More...

Count:277
Name: Ichimoku Crypto LONG 3h ANY CRYPTO Pair
Description: This is a strategy which works with most of the crypto pairs on the 3H time frames. It beats easily on the long term buy and hold strategy. This strategy is made from the baseline from ichimoku together with ema 200 This is a long only strategy. THe condition is : our candle is above ema 200 and our ichimoku its telling we have a long trend. We exit on the...

Count:277
Name: Time Based Crypto DayTrade Strategy
Description: This is a time based strategy, designed to enter and exit within the same day of the week, using different hours for entry and exit. The script is long only direction, and it has no risk management inside, so use it with caution. At the same time you can also calculate each individual hour return within a certain day, and make your own idea about the best...

Count:277
Name: QQE Cross v6.0 by JustUncleL-Long-Short by sscogin BACKTEST
Description: Allows for back test of the "QQE Cross v6.0 by JustUncleL-Long-Short Alerts by sscogin" indicator/strategy. Provides the ability to test this strategy on long/short trades with the added option to select a %stop loss or %take profit signals. Easy to adjust settings to long only, short only, or continuous long and short, and to immediately analyze profit %...

Count:277
Name: Strategy VS Buy & Hold
Description: SUMMARY: A strategy wrapper that makes a detailed and visual comparison between a given strategy and the buy & hold returns of the traded security. DESCRIPTION: TradingView has a "Buy & Hold Return" metric in the strategy tester that is often enough to assess how our strategy compares to a simple buy hold. However, one may want more information on how and when...

Count:275
Name: Hull Suite + Stoch RSI Strategy v1.1
Description: This strategy uses Hull Suite with Stoch RSI Uses Hull Suite as trend and only trades with the direction of the trend. Entry conditions: Hull Suite as a trend Stoch RSI overbought for short entries & oversold for long entries Current parameters works best on BINANCE:BNBBUSDPERP pair.

Count:275
Name: Trend Finder V2
Description: A variation of a previous indicator i made using two stochastics and a volume weighted moving average to look for trend, 10% equity used per trade at 0.1% commission The close can be used more of a stop loss if volatility is used to take profit

Count:274
Name: TemaVWAPRSI Strategy
Description: Exchange: Kraken Timeframe: 5m Pair: ETH/USD If you use this for any other exchange or pair, you'll have to tweak the settings, most importantly are the trailing stop ticks. This strategy is currently in what I would call beta mode. It uses the volume weighted average price indicator, rate of change, two triple exponential moving averages and the relative...

Count:274
Name: MilleMachine
Description: Hello traders, I hereby present to you the second stage of my journey to finding a reliable, profitable trading strategy. The "Millemachine" is based on the "Millebot", my previous published strategy. This means the backbone of the strategy is still the same: a trend following system. Instead of using a fixed TP and SL, a trailing stoploss is now used. To limit...

Count:274
Name: Aroon Oscillator Strategy
Description: This is simple strategy based on Aroon Oscillator. I have found that using length 144 or 169 on hourly chart shows excellent results. Tested on SPY , QQQ and AAPL. Especially when you look at AAPL results , it has 60% profitable in recent trades. ( Dont assume this will be same for other stocks or ETFs) Aroon Oscillator setting : 169 ( ...

Count:274
Name: Adaptive Price Zone Backtest
Description: The adaptive price zone (APZ) is a volatility-based technical indicator that helps investors identify possible market turning points, which can be especially useful in a sideways-moving market. It was created by technical analyst Lee Leibfarth in the article “Identify the Turning Point: Trading With An Adaptive Price Zone,” which appeared in the September...

Count:274
Name: Chop Zone Strategy - Buy Only
Description: Uses build-in indicator "Chop Zone" which measures angle of EMA-34. Buy when there are 3 consecutive turquoise bar. Close when there are 3 consecutive non-turquoise bar.

Count:274
Name: Ichimoku Backtest
Description: Ichimoku Strategy You can change long to short in the Input Settings WARNING: - For purpose educate only - This script to change bars colors.

Count:274
Name: trend Screener List1
Description: This is type of custom screener I searched and made to screen bulk stocks any one can modify it, other may get help out of it. in my code i have made defined 1. uptrend= ema(close,55)> ema(close,144) and ema(close,144)> ema(close,388) and ema(close,388)> ema(close,576) and close>ema(close,388) 2. downtrend = ema(close,55)< ema(close,144) and ema(close,144)<...

Count:274
Name: CMYK RMI TRIPLE
Description: ◊ Introduction This script makes use of three RMI's, to indicate Overbought/Oversold. Adjustments can easily be made, through its settings or script. ◊ Origin The Relative Momentum Index was developed by Roger Altman and was introduced in his article in the February, 1993 issue of Technical Analysis of Stocks & Commodities magazine. While RSI counts up and...

Count:273
Name: Keltner Channel [LINKUSDT] 1H
Description: This is a long-only strategy tested on LINK/USDT, 1 hour bar, from Feb 2019. The entry is determined by the breakout of upper Keltnel Channel and when the +DI is higher than 32. Instead of a fixed stop-loss from the original script , I change the exit to the middle band of the Keltnel Channel. 1st profit target will close 20% of the position. 2nd profit target...

Count:273
Name: QuantCat Mom Finder Strategy (1H)
Description: QuantCat Momentum Finder Strategy This strategy is designed to be used on the 1 hour time frame, on all x/btc pairs. The beautiful thing is it plots the take profit, and stoploss for you for each entry- where I would say use the stoploss for sure and feel with water with how the price action is looking when in profit. In this strategy, I actually implemented...

Count:273
Name: Moon Phases Strategy 2015 till 2021
Description: Moon Phases Strategy Thank you to Author: Dustin Drummond for allowing me to use his Moon Phase strategy code and modify it. I wanted to test out the accuracy of the moon phase. And I could not have done it without his code It was created to test the Moon Phase theory compared to just a buy and hold strategy. It buys on full Moon and sells on the new moon. I...

Count:273
Name: Kwan NRP Backtest
Description: To calculate the coordinates in which the kink of the line will cross, the standard Forex instruments are used - Relative Strenght Index, Stochastic and Momentum. It is very easy to optimize them for the existing trading strategy: they all have very flexible and easily customizable parameters. Signals to enter the market can be 2 situations: Change of color...

Count:273
Name: Basic Hammer Strategy
Description: This is a basic strategy that will buy after a hammer is printed, and sell when a predetermined risk or reward price is hit. You can change the risk and reward values in the settings. Risk and reward values are in increments of $0.01. Default values are 75 ($0.75) and 200 ($2.00). If the strategy is producing losses, try adding a zero to the end of the risk value...

Count:273
Name: Tilson T3 and MavilimW Triple Combined Strategy
Description: Inspired by truly greatful Kivanç Ozbilgic (www.tradingview.com). The strategy tries to combined three different moving average strategies into one. Strategies covered are: 1. Tillson T3 Moving Average Strategy Developed by Tim Tillson, the T3 Moving Average is considered superior to traditional moving averages as it is smoother, more responsive and thus...

Count:272
Name: Volatility Traders Minds Strategy (VTM Strategy)
Description: Volatility Traders Minds Strategy (VTM Strategy) I found this startegy on internet, with a video explaingin how it works. Conditions for entry: 1 - Candles must to be above or bellow the 48 MA (Yellow line) 2 - Candles must to break the middle of bollinger bands 3 - Macd must to be above or bellow zero level; 4 - ADX must to be above 25 level Credits to who...

Count:272
Name: Trend Indicator with BUY SELL signals
Description: The Script can be used to identify the main trend and take BUY/SELL decisions in the lower time frames. The tool can be applied as follows 1) Apply the tool your favorite chart 2) Select the main trend. 3) Go to lower time frames to check the BUY/SELL signals. Example: If the selected main trend is 4 hrs then go to time frames below 4 hrs to find the entry and...

Count:272
Name: SMA STRATEGY
Description: It is a simple strategy to show a possible combination of a simple moving average and Fast-SMA published earlier. It goes long only when the price is over sma 50 and FSMA and closes the trade when it crosses down FSMA. The same logic is for the shorting. At this time this strategy does not take in count slow crossing and fuss that needs additional...

Count:271
Name: Parabolic SAR & Arnoud Legoux Moving Avarage Strategy
Description: In the first short signal example, after price closes below the ALMA and the parabolic SAR plots above the price high, sell signal is opened with the stops trailed to the PSAR values until the trade is stopped out. Similarly, you can see a long position where price cuts above the ALMA and the Parabolic SAR plots below the price low. Using these values as the...

Count:271
Name: Simple and efficient MACD crypto strategy with risk management
Description: Today I am glad to bring you another great creation suited for crypto markets. MARKET Its a simple and efficient strategy, designed for crypto markets( btcusd , btcusdt and so on), and suited for for higher time charts : like 1hour, 4hours, 1 day and so on. Preferably to use 1h time charts. COMPONENTS MACD with simple moving average ENTRY DESCRIPTION For...

Count:271
Name: Turtle soup plus one
Description: Linda Raschke's strategy from her book about swing trade technics.

Count:271
Name: RSI Strategy
Description: This RSI strategy will allow you to go long when RSI is overbought and go short when RSI is oversold. You can also change the checked boxes to reverse this. Uncheck "Overbought Go Long & Oversold Go Short" and check "Overbought Go Short & Oversold Go Long" to use this reversed option. You can also choose to use an ema filter as an additional qualifier for entry....

Count:271
Name: Negroni MA & RSI Strategy, plus trade entry and SL/TP options
Description: I will start with the context, and some things to think about when using a strategy tool to back-test ideas. CONTEXT FIRST: This is derived from other people's work, but I honestly hadn't found a mixed indicator MA strategy tool that does what this now does. If it is out there, apologies!! This tool can help back-test various MA trends (SMA, EMA, HMA, VWMA); as...

Count:271
Name: Joker Trailing TP Bot
Description: Trailing Take Profit is used by the traders to increase their gains when the prices moves in a favorable direction. Let’s have a look at what is Trailing Take Profit and how it works. What Is a Trailing Take Profit? Trailing Take Profit is a term largely used in crypto, whereas you may encounter the term Trailing Stop in traditional trading describing almost the...

Count:271
Name: Risk Reward Calculator [lovealgotrading]
Description: OVERVIEW: This Risk Reward Calculator strategy can help you maximize your RR value with help of algorithmic trading. INDICATOR: I wanted to setup my trades more easier with this indicator, I didn't want to calculate everytime before orders, with help this indicator we can calculate R:R value, avarage price, stoploss price, take-profit price, order...

Count:270
Name: Combo Backtest 123 Reversal & RAVI
Description: This is combo strategies for get a cumulative signal. First strategy This System was created from the Book "How I Tripled My Money In The Futures Market" by Ulf Jensen, Page 183. This is reverse type of strategies. The strategy buys at market, if close price is higher than the previous close during 2 days and the meaning of 9-days Stochastic Slow...

Count:270
Name: MacD (Future Known or Unknown) Strategy
Description: This indicator/strategy is to be used as a way to baseline the top potential any strategy could have with other strategies and indicators. What I have created literally shows the BEST moves possible you could have made in my opinion for SHORTING or LONGING using only the MacD values of the 4 hour while on the 30 minute chart. To use this, try checking out ...

Count:270
Name: Adaptive Zero Lag EMA Strategy [Ehlers + Ric]
Description: Behold! A strategy that makes use of Ehlers research into the field of signal processing and wins so consistently, on multiple time frames AND on multiple currency pairs. The Adaptive Zero Lag EMA (AZLEMA) is based on an informative report by Ehlers and Ric . I've modified it by using Cosine IFM, a method by Ehlers on determining the dominant cycle period without...

Count:270
Name: 12/26-IT strategy
Description: Base of this Strategy is crossover of 12EMA on 26EMA. Also multiple other criteria has to meet for buy signal, Criterias mentioned below ////////////////////////////////// There two entry option to select. Either one or both can be selected: 1. Only 12/26 Cross over a. 12/26 crossover. b. RSI (14) value to be between a range (RSI is inbuilt, but lower and...

Count:270
Name: The Strategy - Ichimoku Kinko Hyo and more
Description: The purpose of this strategy is to make the signals from my scripts available for verification by backtests. Different signal and filter combinations can be created and specific manual parameter optimization can be carried out. In detail, this strategy includes: 23 entry signals two entry filters with each 9 filters two exit filters with each 9 filters take...

Count:270
Name: IFT Stochastic + Trailing Stop
Description: Inverse fisher transform on stochastic strategy with trailing stop. Good work on flats with mid-wave length

Count:270
Name: Simple SMA Strategy Backtest Part 4
Description: Added Take Profit and Stop Loss logic. Part 4 : www.tradingview.com Part 3: www.tradingview.com

Count:270
Name: SB_Elder Impulse System
Description: The strategy is based on LazyBear's Elder Impulse System Strategy(in layman terms): Long: When the green bar in the Elder Impulse System's indicator shows up Short: When the red bar in the Elder Impulse System's indicator shows up Close trade/Profit booking: When the blue...

Count:270
Name: BTCbot
Description: Looks at more than just the BTC price, based off Hull MA Attempt at reducing repaint by Averaging each candles Open-High-Low-Close and then using previous (not current) candle to calculate signal

Count:269
Name: Noro's PriceChannel for D1 v1.0
Description: For: - Crypto/Fiat - Crypto/Crypto - D1 timeframe Strategy The blue line is the central line of the indicator the price channel. If low of a candle is higher than the line - it is uptrend If high of a candle is lower than the line - it is downtrend Color-filter Long-position opens only if a candle of red color Short-position opens only if a candle of...


Count:268
Name: EMA bands + leledc + bollinger bands trend following strategy v2
Description: The basics: In its simplest form, this strategy is a positional trend following strategy which enters long when price breaks out above "middle" EMA bands and closes or flips short when price breaks down below "middle" EMA bands. The top and bottom of the middle EMA bands are calculated from the EMA of candle highs and lows, respectively. The idea is that...

Count:268
Name: Sentiment Oscillator
Description: Price moves when there are more market takers than there are market makers at a certain price (i.e. price moves up when there are more market buys than limit sells and vice versa). The idea of this indicator is to show the ratio between market takers and market makers in a way that is intuitive to technical analysis methods, and hopefully revealing the overall...

Count:268
Name: DCA Simulator
Description: A simple yet powerful Dollar Cost Averaging (DCA) simulator. You just add the script to your chart, and you'll be able to see: - Every single entry with its size - The evolution of you average price in time (blue line) - The profit and loss areas (where market price < average price the DCA is at loss, and the background is colored in red. At the contrary, where...

Count:268
Name: Noro's Bands Strategy
Description: The central line is the central line of the price channel. The line above the center is higher by the average deviation. The uppermost line is higher by 2 mean deviations. Similarly for lower lines. It 's very similar to Bollinger Bands. Strategy If the price is above the top line, open the long position (and close the short position) If the price is below the...

Count:268
Name: simple but effective
Description: A new strategy to 'play' with witch uses three moving average lines with user defined length. default settings are Enter long when ma(3) (source = high) crosses ma(9) (source = open) Enter short when ma(3) (source = low) crosses ma(9) (source = open) Enjoy:)

Count:268
Name: Trend Reversal Alerts Strategy [Advanced]
Description: This is a hourly version of T-R.A.S It's better for houry timeframes : 2h, 3h, 4h, 6h, 12h, 1d, 4d ; otherwise use version for weekly


Count:267
Name: Jim's MACD
Description: MACD Buy/Sell Strategy Filters bearish crossovers above the 0 line and bullish crossovers below. Uses 34 ema to further filter the trades and take only longs above and only shorts below. Apply at least 2:1 risk to reward ratio to account for losing trades. Trade at own risk!

Count:267
Name: Triple EMA Scalper low lag strat
Description: Hi all, This strategy is based on the Amazing scalper for majors with risk management by SoftKill21 The change is in lines 11-20 where the sma's are replaced with Triple ema's to lower the lag. The original author is SoftKill21. His explanation is repeated below: Best suited for 1M time frame and majors currency pairs. Note that I tried it at 3M time frame....

Count:267
Name: Buy the Dips (by Coinrule)
Description: Taking your first steps into automated trading may be challenging. Coinrule's mission is to make it as easy as possible, also for beginners. Here follows the best trading strategy to get started with Coinrule. This strategy doesn't involve complex indicators, yet was proved to be effective in the long term for many coins. Results seem to be improved when trading...

Count:267
Name: Trend Strategy by zdmre
Description: This Strategy is a trend following indicator. It is plotted on price and the current trend can be determined by its placement vis-a-vis price. It is constructed with just three parameters: Period, Multiplier and Entry/Exit Point with Superformula. The default parameters are 14 for Average True Range (ATR) and 4 for its multiplier. The average true range (ATR)...

Count:267
Name: VixFixLinReg-Strategy
Description: This idea came up while discussing about strategies with one of the trading enthusiast from tradingview community. Strategy basically uses existing script of Vix Fix by Chris Moody: VixFix is a great indicator for finding the market bottoms. But, sometimes it generates signal too early. But, we can apply linear regression on vix fix to find vix fix top to make...

Count:266
Name: Combo Backtest 123 Reversal & Center Of Gravity
Description: This is combo strategies for get a cumulative signal. First strategy This System was created from the Book "How I Tripled My Money In The Futures Market" by Ulf Jensen, Page 183. This is reverse type of strategies. The strategy buys at market, if close price is higher than the previous close during 2 days and the meaning of 9-days Stochastic Slow...

Count:266
Name: MarketCipher B Backtest (FOR TESTING ONLY, NOT SAFE TO TRADE)
Description: A script to backtest the strategy outlined. This is not a final version of the script and is therefore not safe to trade. If you choose to ignore this warning, trade at your own risk.

Count:265
Name: No Nonsense NNFX VP Strategy for Back Testing Indicators| jh
Description: After putting the whole system together, sat down to benchmark the various confirmation indicators, shrink it down to backtest individual confirmation indicators. Results for 24 periods way better than 10, then again it's only one pair. :) More details...

Count:264
Name: supertrend advance
Description: HELLO FRIENDS ...............THIS IS SUPERTREND ADVANCE WITH HENKIASHI CANDLE ...I got so many request on supertrend with henkiashi. This is for all of them ..I am making it open for all so you can change its coding according to your need SOME IMPONTENT UPDATE IN THIS SUPERTRNED 1) You Can Use It for option trading ...you can do algo option trading using this...

Count:264
Name: Simple_RSI+PA+DCA Strategy
Description: This strategy is a result of a study to understand better the workings of functions, for loops and the use of lines to visualize price levels. The strategy is a complete rewrite of the older RSI+PA+DCA Strategy with the goal to make it dynamic and to simplify the strategy settings to the bare minimum. In case you are not familiar with the older RSI+PA+DCA...


Count:264
Name: 13/21 EMA + Ichimoku Kinko Hyo Strategy
Description: This trading strategy uses combination of the Ichimoku Kinko Hyo system with Fibonacci numbers based 13/21 exponential moving average ( EMA ) crossover, giving excellent results in trending assets !

Count:264
Name: Simple SMA Strategy Backtest
Description: Added strategy logic. Part 3: www.tradingview.com Part 2: www.tradingview.com Part 1: Simple SMA Indicator www.tradingview.com WARNING: - For purpose educate only

Count:263
Name: RSI Strategy
Description: This RSI strategy is different than most in that it doesn't pick a buy signal based on the RSI rising above a specific number (usually 30). Instead, it creates a 14 day exponential moving average of the Relative Strength Index and uses the following two conditions together to trigger a buy: Entry conditions: Condition1: Rising of the RSI's moving average for...

Count:263
Name: Combo Backtest 123 Reversal & STARC Bands
Description: This is combo strategies for get a cumulative signal. First strategy This System was created from the Book "How I Tripled My Money In The Futures Market" by Ulf Jensen, Page 183. This is reverse type of strategies. The strategy buys at market, if close price is higher than the previous close during 2 days and the meaning of 9-days Stochastic Slow...

Count:262
Name: Compound Indicator Strategy - BTC/USDT 3h
Description: This is an Strategy finds and utilise end points of short term market trends and this is a combination of many indicators such as 1. Volume change oscillator 2. Money flow index ( MFI ) 3. Momentum Oscillator (MOM) 4. Stochastic Indicator 6. Relative Strength Indicator ( RSI ) 7. Relative volatility index (RVI) 8. Balance of power (BOP) 9. Small moving average (...

Count:262
Name: Combo Backtest 123 Reversal & Modified Price-Volume Trend
Description: This is combo strategies for get a cumulative signal. First strategy This System was created from the Book "How I Tripled My Money In The Futures Market" by Ulf Jensen, Page 183. This is reverse type of strategies. The strategy buys at market, if close price is higher than the previous close during 2 days and the meaning of 9-days Stochastic Slow...

Count:262
Name: 2 Candles Inside ATR
Description: 2 agitated candles falling inside ATR range, awaiting possibly a big move. Buy / Sell signals at combined high / low can be used as order with other as stop loss. Counter trade, when this minimal stop loss is hit, is also as useful. However, wait till the SL candle closes, before opening position on the other side. Works quite well on 15 mins chart, with settings...


Count:262
Name: RSI+PA+DCA Strategy
Description: Dear Tradingview community, This RSI based trading strategy is created as a training exercise. I am not a professional trader, but a committed hobbyist. This not a finished trading strategy meant for trading, but more a combination of different trading ideas I liked to explore deeper. The aim with this exercise was to gain more knowledge and understanding about...

Count:262
Name: VFI strategy [based on VFI indicator published by UTS]
Description: This strategy is based on VFI indicator published by UTS. for the strategy purpose , I have added buy line and sell line to the indicator and tested SPY stock/index on one hour chart BUY RULE ========== 1. EMA 50 is above EMA 200 2. vfi line is pulled down and crossing above -4 EXIT RULE ========== 1. when vfi line crossing down 5 STOP...

Count:261
Name: Trailing Stop Loss
Description: This script demonstrate how to make a Training Stop Loss to "ride the wave". In comparison to classic Stop Loss this strategy follows the price upwards (for long positions) and when price drops by a fixed percentage then you exit your position.

Count:261
Name: Supertrend - Long & Short -Sachin Ughade
Description: this indicator for super trend strategy with buy and sell signals

Count:261
Name: ms hypersupertrend
Description: This is a well-known strategy by using 3 different Supertrends and a trend-defining EMA, feel free to play around with the settings, a backtest on 8h ETHUSDT pair brought some good results using the 233EMA and investing 75% of a 10k start capital the idea is to have at least 2 super trends going green above the trend-EMA to go long and exit by turning 2 super...

Count:260
Name: RSI HistoAlert Strategy
Description: This simple indicator modified RSI You can use in the xPrice any series: Open, High, Low, Close, HL2, HLC3, OHLC4 and ect... You can change long to short in the Input Settings Please, use it only for learning or paper trading. Do not for real trading.

Count:260
Name: RSI MACD with conditional MA indicator backtesting
Description: backtesting for the RSI MACD with conditional MA indicator:

Count:260
Name: Supertrend Strategy
Description: This Supertrend strategy will allow you to enter a long or short from a supertrend trend change. Both ATR period and ATR multiplier are adjustable. If you check off "Change ATR Calculation Method" it will base the calculation off the sma and give you slightly different results, which may work better depending on the asset. Be sure to enter slippage and commission...

Count:260
Name: Monthly Returns of a Strategy in a Chart
Description: It's a simple example of how you can present your strategy's monthly performance in a chart. You maybe know that there is no support of these kind of charts in TradingView so this chart is actually a table object under the hood. Table visual appearance is customizable, you can change: Location Bar Width / High Colors Thanks to @MUQWISHI for hard work,...

Count:260
Name: MA MTF Cross Strategy
Description: Strategy Introduction This multi-timeframe strategy generates buy and sell entries based on two Moving Averages’ cross with an option to turn on trend direction confirmation through 3rd Moving Average selection. While all three moving averages can be selected from the following list: SMA EMA DEMA TEMA LRC WMA MF VAMA TMA HMA JMA Kijun v2 EDSMA ...

Count:259
Name: Noro's Trailing-Stop Strategy
Description: The lime line - to close a short position and to open a long position. The red line - to close a long position and to open a short position.

Count:259
Name: Buy&Hold
Description: A basic Buy and Hold strategy, which is useful for comparing against your other strategies. You have to specify when you want the strategy to exit in the code, because the built in 'barstate.islast' and 'barstate.isrealtime' functions don't seem to work properly.

Count:259
Name: Stripped Down Vdub Renko Sniper Strategy
Description: I turned the Vdub Renko Sniper study into a strategy script.

Count:258
Name: The Box Percent Strat
Description: Hi guys, Version Zero (more work needed) of an idea I've been meaning to out into a strategy for a while. 🤯 This uses percent boxes🤔 instead of traditional indicators like RSI, MACD etc. 🤫 Takes the first close price of the series and creates a Top Band 10% up, buys if price reaches that level, and puts a stop on a Bot Band, 10% down When the first trade is in...

Count:257
Name: Patron04 TOFF MACD DEMA Strategy
Description: I prepared the macd dema indicator made by Toff as a startegy test. There is another strategy like this. But the process is opened according to the intersection of macd and signal. But the difference between my test is this. Macd is testing according to the intersection of 0 value. Macd sells 0 when cut down, buying when 0 cuts down Toff's Macd dema:

Count:257
Name: Crypto EMA Trend Reversal Strategy
Description: This is an EMA crossover strategy which involves 5 EMAs to trigger trades. The strategy has two take profit settings and uses a stop loss. TP1 and SL are based on ATR and TP2 is an EMA crossover. The strategy goes both long and short and the default settings work particularly well as a scalping strategy for ETHUSDT on the 5M time frame. I have also created...

Count:257
Name: RSI Strategy - Tanner
Description: Hello everyone, this is my first script on TV. I have done some research on cryptocurrency strategies and much of which has been in technical indicators by combining trend and momentum analysis together. Pine Script is quite a difficult language to learn as opposed to Python. Anyways, I made some adjustments for the RSI strategy to include a stop loss/take profit...

Count:257
Name: Fractal Chaos Bands Backtest
Description: The FCB indicator looks back in time depending on the number of time periods trader selected to plot the indicator. The upper fractal line is made by plotting stock price highs and the lower fractal line is made by plotting stock price lows. Essentially, the Fractal Chaos Bands show an overall panorama of the price movement, as they filter out the...

Count:257
Name: Multi Time Frame Buy the Dips (by Coinrule)
Description: Buying the dips is a relatively easy automated trading strategy that can return impressive profits, especially during uptrend times. Not all price drops are for buying, though. This trading system is based on a multi time frame buy-the-dip approach to optimize each trade. The strategy catches sudden price drops on a 1-hr time frame when the price increases...

Count:257
Name: Contrarian Scalping Counter Trend Bb Envelope Adx and Stochastic
Description: Contrarian Scalping is an trading strategy designed to take advanted of a counter-trend. The advantage of these strrategies types is that they have a good profitability but with do not great gain (in relation at the time frame). Indicators used: Bollinger Envelope ADX Stochastic Rules for entry For short: close of the price is above upper band from bb and...

Count:257
Name: Accelerator Oscillator (AC) Backtest
Description: The Accelerator Oscillator has been developed by Bill Williams as the development of the Awesome Oscillator. It represents the difference between the Awesome Oscillator and the 5-period moving average, and as such it shows the speed of change of the Awesome Oscillator, which can be useful to find trend reversals before the Awesome Oscillator does. You...

Count:256
Name: Relative Volume & RSI Pop
Description: This is a basic idea/script designed to take a breakout trade by taking advantage of volume spikes when price/strength is extended (either long or short). The script only utilises two indicators, the Relative Volume (RV) and the Relative Strength Index (RSI). The script allows the user to select a RSI value between 69 up to 100 for a long trade and between 35...

Count:256
Name: Combination Parabolic MA/IIR/ALMA Strategy, and other goodies
Description: Okay, so this is a lot. It started mostly with me combining indicators and looking for ideal entry criteria. It is also a collection of conditions, whether used or unused, for my current chosen "best" strategy. It is currently set how I like it, but it has changed with time, and will continue to do so. Within, there are variables that are unused, but offer some...

Count:256
Name: Adding some essential components to a prebuilt RSI strategy
Description: This is more to be used as a blank_slate for any strategy build adding more effective backtesting with a period selector and inputs like TS, TP, SL that can all be used as plots for alerts. It has the BackTest Component created by Pbergden It also includes the standard long/short with trailing stop, take profit, stop loss and margin call. Here is a video...

Count:255
Name: Mean Reversion Strategy by KrisWaters
Description: This is a type of mean reversion strategy. It only generates long signals when the price is far away from the mean. It tries buy from the dip. Use it with BTC/USDT pair on 4 hour timeframe.

Count:255
Name: McGinley Dynamic Indicator
Description: This is a strategy based on the Mcginley Dynamic Moving Average indicator, a type of moving average that was designed to track the market better than existing moving average indicators. It is a technical indicator that improves upon moving average lines by adjusting for shifts in market speed. Moving averages used: EMA: 21 EMA: 42 The chart used for the...

Count:255
Name: TradeIQ - Crazy Scalping Trading Strategy [Kaspricci]
Description: This strategy script is a combination of two indicators developed by LuxAlgo: Triangular Momentum Oscillator & Real Time Divergences ( TMO ) Adjustable MA & Alternating Extremities (AMA) The script combines the BUY and SELL signals from the TMO indicator with the BUY and SELL extremities shown by the AMA script and waits for the smoothed candles to grow...


Count:255
Name: ETF 3-Day Reversion Strategy
Description: Introduction: This strategy is a modification of the “3-day Mean Reversion Strategy” from the book "High Probability ETF Trading" by Larry Connors and Cesar Alvarez. In the book, the authors discuss a high-probability ETF mean reversion strategy for a 1-day time-frame with these simple rules: The price must be above the 200 day SMA and below the 5 day SMA. ...

Count:254
Name: Ultimate Ichimoku Cloud Strategy
Description: The goal of this strategy script is to provide the ultimate experience to anyone interested in the Ichimoku Kinkō Hyō (Ichimoku Cloud). The script is designed to be highly customizable and allows the user to set a custom trade date range and select any combination of inputs and conditions that satisfy their goals. Additionally, the script allows the user to...

Count:253
Name: Buy The Dips - MA200 Optimised
Description: The strategy combines a contrarian approach (buying the dips) with a trend-following logic (only when the price is above the MA200) The strategy seeks to find the best times when buying the dips on the asset should result to be more profitable. The price above a long-term moving average indicates momentum that increases the possibility of profiting from buying...

Count:253
Name: SMA Cross strategy
Description: This is a simple strategy which is always profitable and trades better than most premium channels and I give it out for free :) Working very good on ETHUSDT futures on binance :)

Count:253
Name: Combo Backtest 123 Reversal & Bill Williams. AO with Signal Line
Description: This is combo strategies for get a cumulative signal. First strategy This System was created from the Book "How I Tripled My Money In The Futures Market" by Ulf Jensen, Page 183. This is reverse type of strategies. The strategy buys at market, if close price is higher than the previous close during 2 days and the meaning of 9-days Stochastic Slow...

Count:252
Name: 3 Higher High Price & Vol - BTST next day Gap up
Description: 1) Price & Volume forms Higher High in the last 45 min 2) Volume is above Avg (20 MA Vol) 3) Indicates EOD buying next Gap up will happen 4) BTST strategy 5) Scanner available

Count:252
Name: Multi-Indicator Bollinger Bands Trading Strategy
Description: This script is an advanced trading strategy that combines the use of Bollinger Bands, Relative Strength Index (RSI) and Moving Average Convergence Divergence (MACD) indicators to make buy and sell decisions. The script first plots the Bollinger Bands on the chart, with the upper and lower bands of two different standard deviations (1st and 2nd StdDev) outlined...

Count:252
Name: Zweig Market Breadth Thrust Indicator Strategy
Description: The Breadth Thrust Indicator is a technical indicator which determines market momentum, signaling the start of a potential new bull market. The Breadth Thrust Indicator was developed by Martin Zweig, an American stock investor, financial analyst, and investment adviser. According to Zweig, the concept is based on the principle that the sudden change of money in...

Count:251
Name: TASC 2022.04 S&P500 Hybrid Seasonal System
Description: █ OVERVIEW TASC's April 2022 edition of Traders' Tips includes the "Sell In May? Stock Market Seasonality" article authored by Markos Katsanos. This is the code implementing the "Hybrid Seasonal System" from the article. █ CONCEPTS In his article, Markos Katsanos takes an updated look at the "Sell in May" adage by reviewing recent historical data for...

Count:251
Name: kurdistan MACD & RSI & EMA
Description: Hello friends This indicator can help you to combine the three indicators together EMA (20), MACD (12, 26, 20), RSI (14) Apply ema20 to rsi as the signal line Long arrival time Price above EMA20, MACD above signal line and RSI above signal line Short arrival time Price below EMA20, MACD below signal line and RSI below signal line

Count:251
Name: Mirocana.com V4.20
Description: //@version=2 // Microcana.com strategy by pilotgsms - version 4.20 <<<< Edited by Seaside420 >>>> special thanks to 55cosmicpineapple // Hull_MA_cross added to script strategy("Mirocana.com V4.20", overlay=true, default_qty_type=strategy.percent_of_equity, default_qty_value=100) dt = input(defval=0.0010,...

Count:251
Name: RSI Cross [xaurr]
Description: This is simple but profitable rsi cross strategy, to find optimal values you can change rsi and ema periods. Good Luck!

Count:251
Name: Kozlod - RSI Strategy - 1 minute
Description: Started to play with very simple strategies. Trying to find ones with optimal parameters which work well for certain symbols/timeframe. Found that basic RSI strategy without any position management with high RSI length (65 in this script) works pretty good for 1m chart for few stocks. It's also not bad for AAPL , SPY . It might not work very good on it's not...

Count:251
Name: [KL] Relative Volume + ATR Strategy
Description: This strategy will enter into long position when (a) current volume is above the average volume, and when (b) volatility of prices (based on ATR) is relatively low. Backtested on hourly timeframes, win rates range between 35% to 50% on stocks with positive drifts (i.e. tendency to move upwards). Default setups are as follows: - Average volume is computed using...

Count:251
Name: Outsidebar vs Insidebar, Illusion Strategy (by ChartArt)
Description: WARNING: This strategy does not work! Please don't trade with this strategy I'm sharing this strategy for the following three educational reasons: 1. You can easily find 100% strategies, but if they only seem to work 100% on one asset, they actually don't work at all. Therefore never backtest your strategy only on one asset, especially forward testing is...

Count:250
Name: Improved simple RSI Buy/Sell at a level (SL/TP)
Description: Improved Simple Strategy based on RSI, using overbought or oversold levels. Backtest: ETHPERP (FTX) - 30m Set STOP LOSS and GET PROFIT as a percentage (2% and 10% by default). If strategy.position_size != 0 algorithm convert percentages into points and set stop loss and take profit limit orders.

Count:250
Name: Trend Trader Strategy (Trend Code)
Description: Long - Green Bars Short - Red Bars Update trailing stop daily.

Count:250
Name: Trend Angle BF
Description: Thanks to Duyck for the idea for this code, and for the code itself. Also thanks to Everget, KyJ and kiasaki for code used in the calculations. The indicator measures Moving average angles and generates a long or short signal based on the slope. The chart used to optimise the current settings is XBT/USD on Bitmex 8hr. You can change the MA length and stop loss,...

Count:250
Name: Gann HiLo Activator Strategy
Description: █ OVERVIEW Strategy based on the Gann Hilo Activator . This is a trend following strategy, which means it will go long (and close the previous short position) once the price closes above the high SMA, and go short (and close the previous long position) once the price closes below the low SMA. █ PARAMETERS - Length - Displace (or offset): default is 1 - Begin...

Count:250
Name: Gold trading strategy with trend follow and TDOW concept
Description: My strategy uses a combination of three indicators MACD Stochastic RSI. The Idea is to buy when ( MACD > Signal and RSI > 50 and Stochastic > 50) occures at the same time This strategy works well on stocks and cryptos especially during market breaking up after consolidation The best results are on Daily charts , so its NOT a scalping strategy. But it can...

Count:250
Name: Hidden Gap`s VSA Volume
Description: If Volume is less then the previous 20 intervals, Volume is gray. If Volume is greater then the previous 40 intervals, Volume is black. If Volume is less then the previous 2 intervals, Volume is purple. If Volume is less then the previous, Volume is red. If Volume is greater then the previous, Volume is blue. Other - white. You can add on the indicator a...

Count:250
Name: MACD controlled risk strategy example
Description: Using a basic MACD as a signal this code is an example of how to base strategies around stops and calculated risk per trade rather than the more common approach of 'equity flipping' long and short for every trade and using an arbitrary %age stop which can leave you a bit exposed, lead to excessive drawdown and miss out on bigger sized positions for more profits.

Count:249
Name: RSI + MA Strategy
Description: Hello, everyone! We have just released an innovative strategy for TradingView. It allows you to facilitate the trading process when you have to use both indicators. This strategy is: User-friendly Configurable Equipped with the combination of Relative Strength Index (RSI) and Moving Average (MA) indicators Designed with all required functions to manage...

Count:249
Name: Combo Backtest 123 Reversal & Smoothed RSI
Description: This is combo strategies for get a cumulative signal. First strategy This System was created from the Book "How I Tripled My Money In The Futures Market" by Ulf Jensen, Page 183. This is reverse type of strategies. The strategy buys at market, if close price is higher than the previous close during 2 days and the meaning of 9-days Stochastic Slow...

Count:249
Name: CCI+EMA Strategy with Percentage or ATR TP/SL [Alifer]
Description: This is a momentum strategy based on the Commodity Channel Index (CCI), with the aim of entering long trades in oversold conditions and short trades in overbought conditions. Optionally, you can enable an Exponential Moving Average (EMA) to only allow trading in the direction of the larger trend. Please note that the strategy will not plot the EMA. If you want,...

Count:248
Name: Dynamic Price Swing
Description: Finally, a price channel oscillator that works. I programmed three flavors into this. The first flavor uses the Fast and Slow EMA to check for the trend to ensure you don't trade in the wrong direction simply because the price crosses the previous highest high or lowest low (based on lookback bars). The second flavor uses a seven point average of the...

Count:248
Name: Combo Backtest 123 Reversal & Ergodic MACD
Description: This is combo strategies for get a cumulative signal. First strategy This System was created from the Book "How I Tripled My Money In The Futures Market" by Ulf Jensen, Page 183. This is reverse type of strategies. The strategy buys at market, if close price is higher than the previous close during 2 days and the meaning of 9-days Stochastic Slow...

Count:248
Name: Combo Backtest 123 Reversal & Positive Volume Index
Description: This is combo strategies for get a cumulative signal. First strategy This System was created from the Book "How I Tripled My Money In The Futures Market" by Ulf Jensen, Page 183. This is reverse type of strategies. The strategy buys at market, if close price is higher than the previous close during 2 days and the meaning of 9-days Stochastic Slow...

Count:247
Name: [KL] Double Bollinger Bands Strategy (for Crypto/FOREX)
Description: This strategy uses a setup consisting of two Bollinger Bands based on the 20 period 20-SMA +/- (a) upper/lower bands of two standard deviations apart, and (b) upper/lower bands of one standard deviation apart. We consider price at +/- one standard deviation apart from 20-SMA as the "Neutral Zone". If price closes above Neutral Zone after a period of...

Count:247
Name: Combo Backtest 123 Reversal & Empirical Mode Decomposition
Description: This is combo strategies for get a cumulative signal. First strategy This System was created from the Book "How I Tripled My Money In The Futures Market" by Ulf Jensen, Page 183. This is reverse type of strategies. The strategy buys at market, if close price is higher than the previous close during 2 days and the meaning of 9-days Stochastic Slow...

Count:247
Name: Volume Flow BF
Description: Based on code by oh92 and kiasaki. Measures volume to indicate Bull vs Bear. Go long when green, short when red, wait patiently when white.

Count:247
Name: Supertrend - Intraday
Description: Supertrend Intraday Strategy Basic supertrend strategy purpose built for intraday trading. Users can define intraday session during which the strategy will run. Position is reversed when signal changes by using double quantity. Once the intraday session is over & if the position is open; it is squared off. Parameters: Intraday Session - Defines the...

Count:247
Name: Easy to Use Stochastic + RSI Strategy
Description: A simple strategy that yields some great results. CODE VARIABLES LINE 2 - Here you can change your currency and amount you want to invest on each entry. LINE 10/11/12 - Here we establish what date we want to start backtesting from. Simply change the defval on each line to change the date (In the code below we start on Jan 1st, 2014). LINES 19 through 27...

Count:247
Name: RSI Alligator Strategy [forked from jedireza]
Description: Backtester for RSI alligator is Williams Alligator strategy using Relative Strength Index to predict entries Original script can be found at

Count:247
Name: Dual Thrust Strategy
Description: The Dual Thrust trading algorithm is a famous strategy developed by Michael Chalek. Its logical prototype is one of the most common Day trading strategies. The opening range breakout strategy is based on today’s opening price plus or minus a certain percentage of yesterday’s amplitude to determine the upper and lower rails. When the price breaks through the upper...

Count:246
Name: RSI_OTT - TP/SL
Description: While creating this strategy, I was inspired by "ott(by Anıl Özekşi)" and "RSI + Bollinger Double Strategy(by ChartArt)". Basically, the strategy uses ott bands instead of bollinger bands in the "RSI+Bollinger Double Strategy". User can select take profit, stop loss, position direction(long, short or both) and the other ott parameters via interface.

Count:246
Name: Volatility Stop with Vwap Strategy
Description: First the credits goes to @TradingView for their release of the volatility stop mtf indicator. I have took it, and inside I have added a weekly vwap for a better trend direction and at the same time I have added a dynamic risk managment which is calculated from the distance between the volatility line to the close of the candle. The rules for entry are...

Count:246
Name: BitMEX pump catcher
Description: What is going on here? This strategy is pretty simple. We start by measuring a very long chunk of volume history on BitMEX:XBTUSD 1 hour chart to find out if the current volume is high or low. At 1.0 the indicator is showing we are at 100% of normal historical volume. The blue line is a measure of recent volume! This indicator gets interested when the volume drops...

Count:245
Name: Strategy Execution Template - Master Pattern
Description: This script is a template to execute your strategy with Stop Loss and Take Profit and showing Trades. Then, you can write your strategy without taking care of Stop Loss and Take Profit method. 3x Fixed Percent Stop Loss, Trailing Percent Stop Loss, Trailing ATR Stop Loss, Tailing HHLL Stop Loss 3x Fixed Percent, Take Profit


Count:245
Name: MavilimW Strategy MTF EMA with HA Candles
Description: This is a strategy adapted initially for Mavilim moving average indicator, based on WMA MA. It seems to works amazingly on long term markets, like stocks, some futures, some comodities and so on. In this strategy, I form initially the candle, using EMA values, so I take the EMA of last 50 closes, open, highs and lows and form the candle After this I take...

Count:245
Name: RSI Fibonacci Levels Strategy
Description: RSI with Fibonacci Levels Visually can be used as: - Countertrend indicator at extreme green/red lines - Follow trend indicator - Fibonacci supports and resistantes zones The strategy works as a follow trend How to trade: The indicator is more reliable in longer time frames, at least 4H Choose a fibonacci level as reference Buy when the RSI line turns...

Count:245
Name: MTSPMAC + MBHB BTCUSDT 15m Strategy
Description: MTSPMAC by informanerd and MBHB by Jay Rogers in one strategy

Count:245
Name: Trading View Guide to Your First Backtest
Description: This is a simple moving average cross over strategy designed to get you familiar with writing strategies in pine script

Count:245
Name: Donchian Trendline - Support Resistance Slope [UhoKang]
Description: // This is a strategy that draws a trend line in the form of a slope whenever the high point and low point are updated. // The upper slope serves as a resistance line, and the lower slope serves as a support line. // Buy when the of the candle crosses the slope

Count:244
Name: BankNifty_Bullish_Intraday
Description: The script uses following mechanism to give a signal of BUY if multiple parameters evaluated are all passed. ENTRY- 1. 5 min MACD should be more than its previous tick 2. 15 min MACD should be more than its previous tick 3. 60 min MACD should be more than its previous tick 4. ADX should be more than 12 5. RSI should be more than 60 6. Stochastic %k should have...

Count:244
Name: twisted SMA strategy [4h]
Description: Hello I would like to introduce a very simple strategy that uses a combination of 3 simple moving averages ( SMA 4 , SMA 9 , SMA 18 ) this is a classic combination showing the most probable trend directions Crosses were marked on the basis of the color of the candles (bulish cross - blue / bearish cross - maroon) ma 100 was used to determine the main trend,...


Count:243
Name: Expert studio strategy 1 - GBPUSD
Description: This is part of a series of strategies developed automatically by a online software. I cannot share the site url, which is not related to me in any way, because it is against the TV reules. This strategy was optimized for GBPUSD, timeframe 1D, fixed lots 0.1, initial balance 1000€. LOGIC: - LONG ENTRY when previous candle is bear - LONG EXIT: RVI > signal...

Count:243
Name: Combo Backtest 123 Reversal & Laguerre-based RSI
Description: This is combo strategies for get a cumulative signal. First strategy This System was created from the Book "How I Tripled My Money In The Futures Market" by Ulf Jensen, Page 183. This is reverse type of strategies. The strategy buys at market, if close price is higher than the previous close during 2 days and the meaning of 9-days Stochastic Slow...

Count:243
Name: Noro's Stochastic Strategy v1.3
Description: in 1.3: + profit became more + RSI Period + SMI+RSI Mode + Color filter + background Uses: 1) Stochastic Momentum Index ("Use SMI-Strategy") 2) Fast RSI , period 2 ("Use RSI-Strategy") 3) SMA Body filter ("Use Body-filter") 4) Color filter ("Use Color-filter")

Count:243
Name: Noro's Fast RSI Strategy v1.7
Description: In 1.7: + Capital, % + Martingale For: - crypto/fiat - crypto/crypto - timeframes: 1hour, 45min, 30min, 15min, 5min

Count:242
Name: Decision Threshold
Description: // Hull_MA_cross & Daily_Candle_cross combination with TP$ & SL$ setting // ( new script reducing repaint )

Count:242
Name: T3+SMA
Description: This source code is subject to the terms of the Mozilla Public License 2.0 at mozilla.org © 03.freeman This strategy is based only on T3 moving average, but uses sma 200 as filter for enter long or short. The default settings considers a daily timeframe. The strategy is very simple: long if T3 increase, short if T3 decrease. Note that if you set volume factor...

Count:242
Name: Noro's ShiftMA-multi Strategy v1.1
Description: Strategy ShiftMA with 3 lines for long and short positions.

Count:242
Name: MP's Cloud Strat
Description: Strategy side of my new cloud script. Idea from Guppy and Viirkooni.

Count:242
Name: Combo Backtest 123 Reversal & RSI HistoAlert
Description: This is combo strategies for get a cumulative signal. First strategy This System was created from the Book "How I Tripled My Money In The Futures Market" by Ulf Jensen, Page 183. This is reverse type of strategies. The strategy buys at market, if close price is higher than the previous close during 2 days and the meaning of 9-days Stochastic Slow...

Count:242
Name: Combo 2/20 EMA & 3 Day Pattern
Description: This is combo strategies for get a cumulative signal. First strategy This indicator plots 2/20 exponential moving average. For the Mov Avg X 2/20 Indicator, the EMA bar will be painted when the Alert criteria is met. Second strategy This startegy based on 3-day pattern reversal described in "Are Three-Bar Patterns Reliable For Stocks" article by Thomas...

Count:241
Name: MACD Trendprediction Strategy V1
Description: A trend following indicator based on the MACD and EMA. In this case, signals are not generated by crossing the signal lines as with the MACD, but as soon as the distance between the signal lines increases or decreases. A profit factor of 1.6-3.5 is achieved. Ein Trendfolge-Indikator, auf der Basis des MACD und EMA. Dabei werden Signale nicht wie bei dem MACD per...

Count:241
Name: Simple SMA Strategy Backtest Part 5
Description: Simple SMA strategy In this stream, we will create an intraday trade cap. WARNING: - For purpose educate only - This script to change bars colors Stream: www.tradingview.com

Count:241
Name: QuantNomad - SuperTrend - TSLA - 1m
Description: Interesting performance for Super Trend strategy for Tesla ( TSLA ) 1m chart. Params: ST Mult: 3, ST Period 120. Performance:61% profit, 637 trades, only 33% prof, 4.84% dd , 0.4 Sharpe. On its own, it might be not a very good strategy, but the big amount of trades allows you to add more filters and improve it. The strategy is not bad both with "when" params...

Count:241
Name: Volty Expan Close Strategy with Backtest Date Range
Description: Input Information Length Numeric 5 Number of bars used to determine the average true range. NumATRs Numeric .75 Factor used to calculate a percentage of the average true range, used to Long and short entry based on a percentage of price movement beyond the average range. Profitable and simple strategy..

Count:240
Name: T3 Ichimoku Cloud Strategy
Description: This strategy utilizes a variation of the Ichimoku Cloud based on T3 moving averages to smooth the outline of the cloud. With less noise and conflicting signals, it is an effective strategy when paired with a trailing stop loss.

Count:240
Name: AlignedMA and Cumulative HighLow Strategy V2
Description: Based on earlier strategy published - AlignedMA and Cumulative HighLow Strategy. Adjustments are done in entry and exit criteria to make it work for shares. Modified to preserve existing entry criteria + additional MA shift condition. Exit criteria is set based on supertrend and trailing stops. Most of the parameters are already optimized. You only need to...

Count:240
Name: Woodie Pivot Points Backtest
Description: Simply input the vales of the high, low and closing price of the previous period to calculate the Woodie pivot point and the associated resistance and support levels for the present period. You can change long to short in the Input Settings WARNING: - For purpose educate only - This script to change bars colors.

Count:240
Name: CoryT's Noro's Ichimoku
Description: A few months ago I took Noro's Ichimoku Cloud and used the AV bot template to throw stops on it. I took some code from JustUncleL to make it not so hideous. Trailing Stops are turned off, stop losses are turned off (you really don't need them with this), and this is currently a Long/Short strategy, the Longs Only and Shorts Only options are broken right...

Count:240
Name: EMA Crossover
Description: EMA Crossover Input Parameters: Stop loss (ticks) - define stop loss in unit of ticks (*1 tick = 12.5) Exit signal - 1: When EMA and price crosses 2: When EMA changes direction Start year, month, day & Stop year, month, day - define backtest period You can set Order size, Commission in Settings, Properties tab.

Count:239
Name: Close Trade at end of day
Description: script serves as an example how we can close trades at end of day. can be session controlled or the time controlled. the session should be adjusted to be earlier than the candle time.

Count:239
Name: RSI with small Take Profit - Long-only
Description: This script open a long position when RSI < 30 and close the position after a small take profit. No stop loss but if you analyse List of Trades then you'll see that several position are closed for unknow reason.

Count:239
Name: ChannelsBreakout
Description: This script allows you to intercept price channel breakouts (Donchian channel) in a bullish perspective. Applicable both on Equities/ETFs and on Futures (Index Futures). We open a position when closes crosses the upper channel. The trade ends with a trailing associated with a fast lower Donchian or a monetary stop loss. It is an educational code and does not...

Count:239
Name: Combo Backtest 123 Reversal & Directional Trend Index (DTI)
Description: This is combo strategies for get a cumulative signal. First strategy This System was created from the Book "How I Tripled My Money In The Futures Market" by Ulf Jensen, Page 183. This is reverse type of strategies. The strategy buys at market, if close price is higher than the previous close during 2 days and the meaning of 9-days Stochastic Slow...

Count:239
Name: Noro's BB + RSI Strategy v1.0
Description: Strategy uses 2 indicators: 1) RSI 2) Bollinger Bands Opening of a position requires at the same time 2 signals (RSI + BB) If the low of a candle is less than lower bound of BB - to open long position If the candle growing - to close a long position Short positions aren't used

Count:239
Name: QuantNomad - EVWMA Cross Strategy
Description: Pretty simple EVWMA (Elastic Volume Weighted Moving Average) Cross Strategy. Long on bullish cross, Short on Bearish Crosss. EVWMA is a quite interesting moving average where period of the MA is defined from volume itself. It incorporates volume information in a natural and logical way. The eVWMA can be looked at as an approximation to the average price paid per...

Count:238
Name: TEMA Cross on Renko Candles
Description: Renko candles filter out noise by plotting a fixed change in price rather than a fixed time frame. Strategies like MACD or MA cross can give a lot of false signals when the price is wavy, but not actually going anywhere. This is especially a problem with small time frames. Since it's so easy to identify trends on a Renko plot, this strategy uses a simple moving...

Count:238
Name: EMA 55 strategy
Description: Simple indicator for strategy ... EMA 55 cross over/under I will use it in 30 min TF for Bitcoin

Count:238
Name: Flying Dragon Trend Strategy
Description: Flying Dragon Trend Strategy can be used to indicate the trend on all timeframes by finetuning the input settings. The Flying Dragon Trend family includes both the strategy and the indicator, where the strategy supports of selecting the optimal set of inputs for the indicator in each scenario. Highly recommended to get familiar with the strategy first to get the...

Count:238
Name: Combo Backtest 123 Overbought/Oversold
Description: This is combo strategies for get a cumulative signal. First strategy This System was created from the Book "How I Tripled My Money In The Futures Market" by Ulf Jensen, Page 183. This is reverse type of strategies. The strategy buys at market, if close price is higher than the previous close during 2 days and the meaning of 9-days Stochastic Slow...

Count:238
Name: DMI (Multi timeframe) DI Strategy [KL]
Description: Directional Movement Index Strategy Entry conditions: - (a) when DI+ > DI- on timeframe #1, and - (b) Confirmation: when DI+ > DI- on timeframe #2 In the shown example, timeframe1 was same as the chart (1H) and timeframe2 was 1D. Stop Loss: ATR based trailing stop About DMI Can refer to Investopedia for general understanding. Applications of DMI in...

Count:238
Name: Backtest Engine
Description: This is a simple backtest engine for your trading strategies. The idea behind this script is to make testing new strategies as easy as possible. Parameters such as take profit/stop loss and time period are built into the script and are customisable by the user via the settings interface. The only coding is to set the entry and exit conditions. Users need not touch...

Count:237
Name: RSI small trade strategy
Description: Trialling a small gains strategy. Unfortunately it caps out at 2000 trades otherwise I would be improving the maximum loss of stopping out trades once the RSI entered an overbought or oversold region

Count:237
Name: Noro's DI Strategy
Description: The trading system uses indicator DI The limit parameter reduces quantity of unprofitable signals For: - crypto - timeframes: H4, D1, D7

Count:237
Name: BV's ICHIMOKU CLOUD - All Signals
Description: hello traders, With this script you will be able to test the different signals offered by the ichimoku cloud system. Crossover Tenkan Kijun Crossover Tenkan Kijun above Kumo Crossover Price Kijun Crossover Price Kijun above Kumo Crossover Price Tenkan Crossover Prince Tenkan aboce Kumo Crossover price Kumo Kumo Color Change Remember to check the JPYPAIR...

Count:237
Name: Strategy Stochastic Crossover Backtest
Description: This back testing strategy generates a long trade at the Open of the following bar when the %K line crosses below the %D line and both are above the Overbought level. It generates a short trade at the Open of the following bar when the %K line crosses above the %D line and both values are below the Oversold level. You can change long to short in the Input...

Count:237
Name: Sniper & Strategy
Description: SniperTrading permite detectar los momentos exactos de compra y venta obteniendo un buen rendimiento. Como aplicarlo: * Realice una compra cuando el indicador de COMPRA aparezca en la pantalla. * Realice una venta cuando el indicador de VENTA aparezca en la pantalla. Adicionalmente se puede observar el indicador de COMPRA o VENTA en color AZUL para operaciones a...

Count:236
Name: ZVWAP strategy
Description: This strategy is based on Z distance from VWAP indicator by LazyBear I have added few filters to utilize the indicator ... BUY Rule ======= 1. fast ema is above slow ema 2. zvwap is dipped below oversold area (default set to -0.5) 3. after the dip , while crossing above zero --- BUY Note , when the above criteria is met , bar color is changed to...

Count:236
Name: Oscilator candles - momentum strategy
Description: This is momentum based strategy based on indicators published earlier: Also trying to use delayed supertrend based on steps as mentioned in the published indicator: Added option to filter trade entries based on higher timeframe pivots. But, it is not so effective and may need further optimization.

Count:236
Name: Buy and Hold entry finder Strategy
Description: Hello everyone! I proudly present the backtest Strategy Script for my "Buy and Hold entry finder" Script. It basically shows you the outcome, if you would use my indicator in the past. The buy signals are limited to 1 order per month. Order Size: Allows you to choose, how much money you want to invest per month. (Please consider, it will only invest an x...

Count:235
Name: HL2 - 22 EMA Cross for Renko
Description: EURUSD This is a simple strategy to use for those who like Renko bars. I ONLY use it on Renko. Basic idea is that when the Renko bar closes above or below the 22 EMA, you go long or short. However, some of the frustrations I've had with any strategy shared in Tradingview is so few folks put in the ability to set a stop or a profit target or the ability to set...

Count:235
Name: SD_Bull_Bear_Engulfing_Rsi_Sd
Description: This strategy combines the idea of a bullish or bearish candle engulfing coupled with standard deviation (a 100% increase or a 50% decrease). The exit condition is placed if the percentage increase is achieved or 35

Count:235
Name: RSI-CCI Fusion Strategy
Description: RSI-CCI Fusion Strategy: Harnessing the Power of RSI and CCI The "RSI-CCI Fusion Strategy" is a powerful trading approach that combines the strengths of the Relative Strength Index (RSI) and the Commodity Channel Index (CCI) to provide enhanced trading insights. This strategy is based on the popular "RSI & CCI Fusion + Alerts" indicator, which utilizes the RSI...

Count:235
Name: Incremental Order size +
Description: This is an old and incomplete script that is being pulled up and dusted off as per request. The sole purpose of this script was to provide code snippets allowing one to easily convert their own script/strategy to include incremental order sizes. More control over your pyramiding orders. **It may repaint, and was not intended for trading but more as an attempt...

Count:234
Name: Combo Backtest 123 Reversal & MASS Index
Description: This is combo strategies for get a cumulative signal. First strategy This System was created from the Book "How I Tripled My Money In The Futures Market" by Ulf Jensen, Page 183. This is reverse type of strategies. The strategy buys at market, if close price is higher than the previous close during 2 days and the meaning of 9-days Stochastic Slow...

Count:234
Name: CM Super Guppy ala WY Strategy
Description: This is a work-in-progress.. Created a strategy from CM Super Guppy by FritzMurphy Have been using that script to eyeball for long positions, so I decided to transform the CM Super Guppy script into a strategy to automate long positions The results are kinda massacred as the Long entry and exit are somehow one bar delayed from where I want it to enter and...

Count:234
Name: Strategy- Double Decker RSI
Description: This Strategy was LIVE coded during a webinar conducted by the author on 16-Jan-21 titled Backtesting in Tradingview. The system is named " Double Decker RSI ". The rules of this strategy are: LONG - RSI(5)>70 and RSI(14)>50 -- EXIT: RSI(5)<55 SHORT - RSI(5)<40 and RSI(14)<50 -- EXIT: RSI(5)>45 Instrument - BANKNIFTY - 1 HR Chart The code is open...

Count:234
Name: Strategy Template
Description: Trying to include few basic things which is needed for strategy which can be used as template. Few important components Strategy parameters Few important parameters include - initial_capital, default_qty_type, default_qty_value, commission_type, pyramiding and commission_value. All my strategies will have similar settings with initial captial set to 20000 to...

Count:233
Name: [KL] Relative Volume Strategy
Description: This strategy will Long when: Confirmation #1: when volume is relatively high Confirmation #2: during periods of price consolidation (See ) It exits when either (a) stop loss limit is reached, or when (b) price actions suggest trend is bearish. Measuring price volatility to assume consolidation: For each candlestick, we quantify price volatility by...

Count:233
Name: Noro's Triple RSI Top/Bottom
Description: It is the indicator. Threefold RSI. 3 different RSI indicators are used: 1) The RSI indicator with the period 2 2) The RSI indicator with the period 7 3) The RSI indicator with the period 14 If at the same time RSI-2 < 10 and RSI-7 < 20 and RSI-14 < 30 = a bottom If at the same time RSI-2 > 90 and RSI-7 > 80 and RSI-14 > 70 = a top Parameter accuracy...

Count:233
Name: Crypto BTC Correlation Scalper Gaps Strategy
Description: This strategy is based on the gaps theory. In this case we have the BTC futures from CME, which acts in a way similar to stocks, and we can have gaps present between close/open session, and also sometimes between same candle due to huge movements intra candle. At the same time I have combined this with a daily moving average, to help out a bit with the trend,...

Count:233
Name: Combo Backtest 123 Reversal & Ergodic MDI
Description: This is combo strategies for get a cumulative signal. First strategy This System was created from the Book "How I Tripled My Money In The Futures Market" by Ulf Jensen, Page 183. This is reverse type of strategies. The strategy buys at market, if close price is higher than the previous close during 2 days and the meaning of 9-days Stochastic Slow...

Count:233
Name: Sonic R + Linear Reg + Kumo Cloud + Barcolor MACD
Description: Soni R with Linear Reg + Kumo CLoud + Barclolor MACD: Buy or Sell signal, stoploss and take profit with 3:1 RR don't close when appear signal close. When barcolor is red, don't buy, and when it is green, don't sell. Enjoy, and goodluck! Sr for bad english.

Count:233
Name: CDC Action Zone V.2 strategy
Description: Base on CDC Action Zone V.2 by piriya33 Purpose for backtest. Ref :

Count:233
Name: Bollinger Band with Fib Golden Ratio (0.618)
Description: This startegy uses Fib level (0.618) of Bollinger Band for long entry. I find this is the only strategy which gives similar results on the different time frames. I have tested QQQ for 1H, 2H , 3H and 4H charts , all showed over 70% winning rate. BB settings 50 , mult 1.5 (or you can use 2.5 or 3 ) Note: for the basis I have used VWMA instead of SMA...

Count:233
Name: Supertrend + Stoch Strategy
Description: A strategy using ema , supertrend and stochastic .
Long entry conditions:
1. EMA 25 > EMA 50 and EMA 100 > EMA 100.
2. Supertrend indicator is green.
3. Stochastic k line cross over d line.
Long stop: the lowest price of the last k

Count:232
Name: Godmode strategy
Description: Still have no Idea how to avoid spam entrys on sideways or low difference price moves. It's my first script, so if you have any idea how make it's better - let me know Use it with Ashi, 15m.

Count:231
Name: Ema cross strat / Turtle Trading
Description: This is just a simple EMA cross strategy which is meant to be similar to Turtle Trading Strategy. It uses in default 4 Hour 21 / 10 EMA to long or short. This is not perfect but in the long run it will profit. Works best in bull market. LINK TO ALERT :

Count:231
Name: EMA Mean Reversion Strategy
Description: This strategy is built on the simple idea that when the price gets far enough away from an EMA, it's bound to reverse. This strategy uses the percent distance the price is from the EMA to trigger ladder orders and sells when the price crosses a trailing stop. This strategy uses the EMA Price Distance Tracker indicator .

Count:231
Name: QuantNomad - RSI Strategy - LTCUSDT - 5m
Description: Really nice performance of Simple RSI Strategy for LTCUSDT ( Binance ) 5m chart. Params: RSI Length: 3, RSI OverSold level: 47, RSI OverBought Level: 56 Performance: 391% profit, 2400 trades, 42% prof, 14.6% dd , 0.65 sharpe. I think this strategy can be a really nice base for a pretty good strategy. We have quite a lot of trades here you can add additional...

Count:231
Name: BTC Volatility Band Strategy
Description: This script/strategy is a pullback system designed for securities with high volatility so naturally Bitcoin is an excellent choice for trading this. This could be used both on a daily chart or on lower timeframes (I found good results on 3hr timeframe but haven't tested it on anything under 1hr). A volatility band is created by comparing the candle close price of...

Count:231
Name: Three EMAs Trend-following Strategy (by Coinrule)
Description: Trend-following strategies are great because they give you the peace of mind that you're trading in line with the market. However, by definition, you're always following. That means you're always a bit later than your want to be. The main challenges such strategies face are: Confirming that there is a trend Following the trend, hopefully, early enough to catch...

Count:231
Name: MAs & RSI strategy long only
Description: This system originates from many articles by Enrico Malverti, Trading System, 2015. Many trading systems are more stable if you use simple and not so innovative indicators, like exponential moving averages and Relative Strengthe index. Differently by the original article: - there is no ATR Filter, but we have introduced a Schaff Indicator. If you have multiple...

Count:231
Name: DMI + HMA - No Risk Management
Description: DMI (Directional Movement Index) and HMA (Hull Moving Average) The DMI and HMA make a great combination, The DMI will gauge the market direction, while the HMA will add confirmation to the trend strength. What is the DMI? The DMI is an indicator that was developed by J. Welles Wilder in 1978. The Indicator was designed to identify in which direction the price...

Count:230
Name: Pivot Reversal strategy long only
Description: Pivot Point Reversal Strategy Pivot point reversal strategy is based on the first support level’s price action during the bullish trend and the first resistance level during the bearish trend . Traders follow the main trend and enter into the trade after reversal analyzing pivot point levels. This version is an upgraded version, combining the initial pivot point...

Count:230
Name: OBV MA Strategy
Description: The On Balance Volume + Moving Average Strategy Parameters: 1H candles, ETHUSDT on BINANCEUS, commission percent uses Binance's maker/taker fees of 0.075% Strategy: I create a 30 day moving average of the On Balance Volume "obvSma = ta.sma(ta.obv, 30)." Then I use the following buy conditions: OBV crosses above the OBV moving average The obv drops x%...

Count:230
Name: Traffic Lights Strategy
Description: 4HS Crypto Market Strategy This strategy uses 4 ema to get Long or Short Signals Length are: 4, 9, 18, 100 We take long positions when the order of the emas is the following: green > yellow > red (As the color of Traffic Lights) and they are above white ema (Used as a filter for long positions) We take short positions when the order of the emas is the...

Count:230
Name: Fisher Transform Indicator by Ehlers Backtest
Description: Market prices do not have a Gaussian probability density function as many traders think. Their probability curve is not bell-shaped. But trader can create a nearly Gaussian PDF for prices by normalizing them or creating a normalized indicator such as the relative strength index and applying the Fisher transform. Such a transformed output creates the peak...

Count:230
Name: Trend Following Long Only Strategy
Description: This script tries to ride bull trends and stay out of the market in bear trends.

Count:230
Name: Breakout Trend Trading Strategy - V1
Description: Strategy in nutshell: This strategy is made to be used in daily time-frames. Works better on trending instruments where volume is available. Hence, this is more suitable for trending shares rather than currencies, commodities and indexes where volume data is either not present or not reliable. Breakout signifies the continuation of trend. Hence, trade in the...

Count:230
Name: BuyHighSellLow - Pivot points
Description: Another version of buy-high sell-low strategy. This time using pivot points. Strategy is simple: Buy when price closes above R1 of pivot point level Sell when price closes below S2 of pivot point level. Use Resolution parameter to define pivot points. Higher the resolution, longer the trade time will be. If resolution is set to same as symbol,...

Count:230
Name: Arms Index (TRIN) Backtest
Description: The Arms index (TRIN) is a technical analysis indicator that compares advancing and declining stock issues and trading volume as an indicator of overall market sentiment. It measures the relationship between market supply and demand and is used as a predictor of future price movements in the market, primarily on an intraday basis. The Arms index seeks to...

Count:228
Name: Stoch.RSI+RSI+DoubleStrategy+CMWilliamsVixFix+DMI
Description: ///////////////////////////////////////////////////////////////////////////////////////////////////////////////////////////////////////// //// STOCHASTIC_RSI+RSI+DOUBLE_STRATEGY+CM_WILLIAMS_VIX_FIX+DMI //// //////////////////////////////////////////////////////////////////////////////////////////////////////////////////////////////////////// // ...

Count:228
Name: MP ZeroLag EMA
Description: New script based on zlema. Hopefully responds better tot ake advantage of margin trading. As usual, commands for both spot trading and margin trading are included, just need to comment or uncomment (using // ) which you prefer. They are just labels so both work in the same way (long/buy, short/sell). Also added some flair to pretty it up a bit, and yes, those...

Count:228
Name: Ichimoku Strategy [CDI]
Description: Strategy used in the CDI community that consists of having as a signal to enter long when it crosses the entire Ichimoku cloud . It is recommended to use the strategy in one hour candles and the profit / loss ratio is 2 to 1 for swing trading, however it can be used at any time frame. The purpose is to perform a bakctesting quickly by setting the limit and stop...

Count:228
Name: TradingGroundhog - Strategy & Fractal V1
Description: #-- Public Strategy - No Repaint - Fractals -- Short term Here I come with another script, more simple than Wavetrend V1. You will love it. #-- Synopsis -- Another simple idea, on a small time frame (15 min) we buy when the opening price goes below a Bottom fractals and sell when it goes over a Top fractals, but as this script do not use Wavetrends. You...

Count:228
Name: [Autoview][BackTest] open and close exp
Description: So this model is experimental open and close model , with take profit . so far seems ok from point of repainting but I cannot say that its not repaint . so be aware on this issue if you use it in live trade ( its still work in progress) if you want to make it as a study with alerts just change the strategy to study The issue with all open and close models in TV...

Count:227
Name: First time coding - a 5min forex Scalping strategy
Description: This is my first attempt at producing a strategy in Pine Script. I am NOT a professional coder. I'm not even a good coder at that. I've only started Pine Script coding since September 2019. I am teaching myself. This script is far from finished. I need to tweak a number of things about this script. Namely: Add a validity window to the 'trigger bar' condition....

Count:227
Name: Ehlers Cyber Cycle Strategy
Description: Ehlers Cyber Cycle Strategy by John Ehlers from his book "Cybernetic Analysis for Stocks and Futures".

Count:226
Name: stoch startegy
Description: Stoch strategy that try to buy in uptrend and to sell in low trend the bearish and bullish zones are based on regular K stoch over MTF D (3X or timeX3) and vice versa . The buy and sell rule based on conditions 2- when mtf stochastic cross above 50 and current is rising, buy 3- when mtf stochastic cross bellow 50 and current isfalling, sell the main script was...

Count:226
Name: Profit MAX MTF HeatMap
Description: This is a powerfull strategy which is made from combining 3 multi timeframes into one for profit max indicator In this case we have daily, weekly and montly. Our long conditions are the next ones : if we have an uptrend on all 3 at the same time, we go long. If we have a downtrend on all 3 of them at the same time we go short. For exit, for long, as soon as...

Count:226
Name: AlphaTrend For ProfitView
Description: This strategy is based on the AlphaTrend indicator by KivancOzbilgic A full description of this algorithm functionality may be found by clicking the linked image above. Changes and/or additions: It is now a backtestable strategy Updated alert trigger logic Easy integration with ProfitView to use this algorithm for automated trading When you create an...

Count:226
Name: Open Close Cross Strategy (PineScript=v4)
Description: Copy of Open Close Cross Strategy. PineScript version 4.

Count:225
Name: Combo Backtest 123 Reversal & Gann Swing Oscillator
Description: This is combo strategies for get a cumulative signal. First strategy This System was created from the Book "How I Tripled My Money In The Futures Market" by Ulf Jensen, Page 183. This is reverse type of strategies. The strategy buys at market, if close price is higher than the previous close during 2 days and the meaning of 9-days Stochastic Slow...

Count:225
Name: Etlers Instantenous Trendline
Description: This script uses @cheatcountry script to calculate Ehlers Instantenous Trendline . Backtest offers 3 capital management tools. One that will always calculate order size as initial capital/close, one that uses the same calculation but adds or substracts profit. The last one allows you to enter manually the size you want to trade. Green and red horizontal lines...

Count:225
Name: The Trading Channel (EAP Course) - Pullback Indicator 1.0
Description: I've recently subscribed to TTC's EAP course and created this script to help me. This is a script to assist with backtesting the strategy outlined in the course. It follows the 5 basic rules of entry.

Count:225
Name: Noro's SILA v1.6L Strategy
Description: Backtesting Backtesting (for all the time of existence of couple) only with software configurations to default (without optimization of parameters): US = Uptrend-Sensivity DS = Downtrend-Sensivity It is recommended and by default: - the normal market requires US=DS (for example US=5, DS=5) - very bear market requires US DS, (for example US=5, DS=0) - very...

Count:225
Name: Ichimoku Cloud with MACD and Trailing Stop Loss (by Coinrule)
Description: The Ichimoku Cloud is a collection of technical indicators that show support and resistance levels, as well as momentum and trend direction. It does this by taking multiple averages and plotting them on a chart. It also uses these figures to compute a “cloud” that attempts to forecast where the price may find support or resistance in the future. The Ichimoku...

Count:225
Name: Simple/Compounded Returns & Drawdowns Table
Description: Very excited to bring this script to the public. This is a very useful table that displays the performance of any strategy you give it in a more detailed view. It runs on all timeframes and at any position on the chart with the replay function. It also updates on tick changes. The table consists of three modes: Simple Equity, Compound Equity and Drawdown. Simple...

Count:224
Name: Noro's Alligator Strategy by Bill Williams
Description: sma1 > sma2 and sma2 > sma3 - to open a long position (and to close a short position) sma1 < sma2 and sma2 < sma3 - to open a short position (and to close a long position)

Count:224
Name: Money Flow Index 5 min Strategy
Description: 1 - Apply the 3 period Money Flow Index indicator to the 5 minute chart, using 0 and 100 as our oversold and overbought boundaries 2 - Wait for the MFI to reach overbought levels, that indicates the presence of "big sharks" in the market. Price needs to hold up the first two MFI overbought occurrences of the day to be considered as a bullish entry signal.* 3 - We...

Count:224
Name: Swing forex strategy 15min
Description: This is a strategy made using BB+ RSI indicators that seems to work great with 15 min major pairs for FOREX. THe rules for it are simple: For long we enter when the close of our candle crosses upwards the lower line and rsi crossover the over sold line We exit long when we have a short entry. For short we enter when the close of the candle crosses downwards...

Count:224
Name: Doji swing strategy
Description: This is a simple strategy based on Doji star candlestick This strategy is suited for big time frames, like 4h -1Day and so on. It places two orders: long at doji star high or previous candle high and short at doji star low or previous candle low. It can also be applied volume average, in order to filter between trades . This strategy works very well with high...

Count:224
Name: Momentum Trading Strategy (Weekly Chart)
Description: The strategy will open position when there is momentum in the stock The strategy will ride up your stop loss based on the super trend. The strategy will close your operation when the market price crossed the stop loss. The strategy will close operation when the line based on the volatility will crossed

Count:223
Name: Kozlod - Simple BB Strategy - XRPBTC - 1 minute
Description: Pretty good performance of simple BB on XRPBTC 1minute chart. No SL or PT used. And remember: Past performance does not guarantee future results.

Count:223
Name: Combo Backtest 123 Reversal & Elder Ray (Bear Power)
Description: This is combo strategies for get a cumulative signal. First strategy This System was created from the Book "How I Tripled My Money In The Futures Market" by Ulf Jensen, Page 183. This is reverse type of strategies. The strategy buys at market, if close price is higher than the previous close during 2 days and the meaning of 9-days Stochastic Slow...

Count:223
Name: Noro's Transient Zones Strategy v1.0
Description: Uses: - Transient Zones - color of a candle as a filter - body of a candle as a filter

Count:223
Name: MovROC (KST indicator) Backtes
Description: This indicator really is the KST indicator presented by Martin Pring. the KST indicator is a weighted summed rate of change oscillator that is designed to identify meaningful turns. Various smoothed rate of change indicators can be combined to form different measurements of cycles. You can change long to short in the Input Settings WARNING: - For...

Count:223
Name: MarketGod for Tradingview(strategy)
Description: Fully Open Source Tv Market God Strategy. Good Luck Strategy Description MarketGod can be applied to any market, with any time-frame associated to it. The signals relay the alert at the close of the period, and the painted alert is then available to users to see on the chart or even set notifications for via tradingview's alert system. We recommend that users...

Count:222
Name: HiLo Extension
Description: This Strategy is finding high and low breaks of the day and enter into the trader based on RSI value and time value 1) This strategy is created for Indian Index like Nifty, Bank Nifty and so... 2) Trades are initiate only after 10:15 AM and before 3:10PM 3) High and Low of the day break will be check during the above time frame 4) RSI value will be check (RSI...

Count:222
Name: Ichimoku Cloud and ADX with Trailing Stop Loss (by Coinrule)
Description: The Ichimoku Cloud is a collection of technical indicators that show support and resistance levels, as well as momentum and trend direction. It does this by taking multiple averages and plotting them on a chart. It also uses these figures to compute a “cloud” that attempts to forecast where the price may find support or resistance in the future. The Ichimoku...

Count:222
Name: Triple Supertrend with EMA and ADX strategy
Description: Publishing a strategy that includes adx and ema filter as well Entry: all three Supertrend turns positive. If a filter of ADX and EMA is applied, also check if ADX is above the selected level and close is above EMA Exit: when the first supertrend turns negative opposite for short entries A FIlter is given to take or avoid re-enter on the same side. For example,...

Count:222
Name: Linear Regression (Backtest / Trailing Stop)
Description: A Strategy with Backtest and Trailing Stop for Long/Short Credits: Study by RafaelZioni - Thanks buddy!

Count:222
Name: Heikin Ashi Trend Direction Strategy
Description: Strategy based off Heikin Ashi candles and their correlation to common Japanese candlesticks . This strategy will signal a trend change when a candlestick closes above/below the opening price of a Heikin Ashi candle of the opposite kind.

Count:221
Name: Noro's Trend MAs Strategy v1.8
Description: Trade strategy which uses only 2 MA. The slow MA (blue) is used for definition of a trend The fast MA (red) is used for an entrance to the transaction For: - For H1 - For crypto/fiat or crypto/crypto - Good for "BTC/USD", "ETH/USD", "ETH/BTC" Recomended: Long = true (if it is profitable as a result of backtests) Short = true (if it is profitable as...

Count:221
Name: Sideways Strategy DMI + Bollinger Bands (by Coinrule)
Description: Markets don’t always trade in a clear direction. At a closer look, most of the time, they move sideways. Relying on trend-following strategies all the time can thus lead to repeated false signals in such conditions. However, before you can safely trade sideways, you have to identify the most suitable market conditions. The main features of such strategies...

Count:221
Name: Exponential Bollinger Band Strategy
Description: Exponential Bollinger Band strategy Just Bollinger Bands crossover that is modified with EMA to generate more profit than previously possible. 10-15% performance gain over regular BBands.

Count:221
Name: Hull Crossover Strategy no TP or SL
Description: What is it? A simple yet effective strategy ran on the 30m chart. This is a basic idea that can be expanded on using different indicator to either add signals or filter out certain bad signals! The strategy consists of 1 fast moving average and 1 slow moving average. Both of these moving averages are the Hull Moving Average What is the Hull Moving Average?...

Count:221
Name: Strategy CCTBBO v2 | Fadior
Description: Second version of the CCTBBO strategy. CCTBBO is a price oscillator that fluctuate between -200 and 200 according to price volatility. Value 0 represent mean price - 2 * StdDev and value 100 represent mean price + 2 * StdDev. Signal is generated when oscillator cross over / under it's EMA. Position is closed with trailing stop. Source of the indicator is the...

Count:221
Name: CBMA Bollinger Bands Strategy directed [ChuckBanger]
Description: I just did a Bollinger Bands script with my newly CB moving average While I'm generally against posting strategies because it's very easy to fake performance numbers... This is just to share a cool strategy snippet. My settings are 10 contracts/order with pyramiding set to 10. You can make the profitability a lot higher if you set the order size higher. But that...

Count:220
Name: Noro's Squeeze Momentum Strategy v1.1
Description: This strategy uses 3 different indicators: 1) Squeeze Momentum Indicator (by LazyBear) 2) Color of a candle as filter of signals 3) Candle body size as filter of signals (SMA Body)

Count:220
Name: Noro's Bands Strategy v1.0
Description: Recomended: - H1 timeframe - Any crypto ("BTC/USD", "XRP/BTC", "Govnocoin/Govnocoin") - Period = 20 - Color = true Backtests (default): "BTC/USD", BitFinex, H1, strategy = profit +7.818% "BTC/USD", BitFinex, H1, buy and hold = profit +662% "ETH/USD", BitFinex, H1, strategy = profit +14.189% "ETH/USD", BitFinex, H1, buy and hold = profit +9.239%...

Count:220
Name: Stealthy 7 Linear Regression Channel Strategy
Description: This is a Linear Regression Channel tool, similar to the hand tool in the left toolbar, but it automates the drawing. It has a rolling look back. Range mode shorts the upper channel and longs the lower crossover with no closing rules. Trend mode longs the break out and closes at the regression. It draws a linear line between the candles then computes an upper and...

Count:220
Name: BB + RSI double strategy develope
Description: I'm Korean, and it may not be enough to explain this script in English. I feel sorry for the users of TradingView for this lack of English skills. If you are Korean, please return it to the translator using Papago. It will be a useful manual for you. This script referenced Chartart's Double Strategy. But there are some changes in his script. 0. Basically, when...

Count:220
Name: Fibonacci candle with Fibonacci ema strategy
Description: For this strategy I am making use of the fibonacci numbers until 10 sequences and I am using them to make an avg candle and an average ema. With it, I combine multiple price action rules and I set it up to only go long. When we have a short , we exit from the trade. From the initial tests, it looks like it performs better on big timeframes. If you have any...

Count:220
Name: All Candlestick Patterns Strategy
Description: This strategy uses the tradingview built in candlestick recognition.

Count:220
Name: Bollinger %B Candles Strategy
Description: Strategy built based on earlier published indicator: Looks to be doing good for short term swing trades. But, I am not sure if there is repainting. I tried to avoid buy/sell trades on same day - but wasn't successful. So far back-tested on following: COINBASE:BTCUSD - works on both long and short CURRENCYCOM:GOLD and equities - long only. Some of the...

Count:219
Name: Cipher B divergencies for Crypto (Finandy support)
Description: Hello Traders! In times of high volatility, it is important to follow a market-neutral strategy to protect your hard-earned assets. The simple script employs common buy/sell and/or divergencies signals from the VuManChu Cipher B indicator with fixed stop losses and takes profits. The signals are filtered by a local trend of a coin of interest and the global trend...

Count:219
Name: Stochastic RSI + WMA + SMA strat
Description: // "...an entry signal it's a cross down or up on // the stochastics. if you're in a downtrend // on the hourly time frame you // must also be in a downtrend on the five // minute so the five period has to be below the 144 // as long as the five period is still trading below // the 144 period on both the hourly and the five minutes // we are looking for these...

Count:219
Name: Generalized SSL Backtest w/ TSSL
Description: Strategy with Backtest Date Range and Trailing-Stop / Stop-Loss for vitelot's indicator:

Count:219
Name: Strategy BackTest Display Statistics - TraderHalai
Description: This script was born out of my quest to be able to display strategy back test statistics on charts to allow for easier backtesting on devices that do not natively support backtest engine (such as mobile phones, when I am backtesting from away from my computer). There are already a few good ones on TradingView, but most / many are too complicated for my...

Count:219
Name: [Prod] SuperTrend with Stoploss+TrendZones - 1H
Description: Here, i'm using a SuperTrend (difference of moving averages) crossover strategy hybrid with stop-loss and trend-following to look at backtesting for the BCHUSD pair on the coinbase (GDAX) exchange. Included in this script I've got some optimized parameters that seem to make a decent profit over ~35+ trades. The one thing that's bothering me here is that I get...


Count:218
Name: Bullish and Bearish Engulfing Strategy
Description: I've been trying to put a stop loss in the High or Low of the last second bar after I open a position but in this example the only way to close it, is with the opposite action. Does anyone know how to put a stop loss and order with just stop loss and close when there is a bullish or bearish engulfing bar?

Count:218
Name: MZ SRSI Strategy V1.0
Description: Strategy Introduction This strategy starts from selection of 1st Moving Average from one of following: SMA EMA DEMA TEMA LRC WMA MF VAMA TMA HMA JMA Kijun v2 EDSMA McGinley Then it calculates the RSI of selected 1st Moving Average In the end it calculates Moving Average of previously calculated RSI and for this purpose 2nd Moving Average...

Count:218
Name: SPXL Futures Strategy
Description: - Buy/sell signals for SPXL using futures momentum. - For real-time signals at close, use ES1! on 2 minute chart and sign up for real-time cboe mini futures data feed in tradingview. - All buys and sells are at near close of US RTH market at 4pm. - Best to use the script with other breadth signals to decide on trading strategy. - Script is compatible with SPY,...

Count:218
Name: Strategy Myth-Busting #11 - TrendMagic+SqzMom+CDV - [MYN]
Description: This is part of a new series we are calling "Strategy Myth-Busting" where we take open public manual trading strategies and automate them. The goal is to not only validate the authenticity of the claims but to provide an automated version for traders who wish to trade autonomously. Our 11th one is an automated version of the "Magic Trading Strategy : Most...

Count:218
Name: Combo Backtest 123 Reversal & Extracting The Trend
Description: This is combo strategies for get a cumulative signal. First strategy This System was created from the Book "How I Tripled My Money In The Futures Market" by Ulf Jensen, Page 183. This is reverse type of strategies. The strategy buys at market, if close price is higher than the previous close during 2 days and the meaning of 9-days Stochastic Slow...

Count:218
Name: Combo 2/20 EMA & Bull And Bear Balance
Description: This is combo strategies for get a cumulative signal. First strategy This indicator plots 2/20 exponential moving average. For the Mov Avg X 2/20 Indicator, the EMA bar will be painted when the Alert criteria is met. Second strategy This new indicator analyzes the balance between bullish and bearish sentiment. One can cay that it is an...

Count:218
Name: Hull Moving Average and Daily Candle Crossover
Description: Hull Moving Average. Alan Hull developed Hull Moving Average in 2005 in his quest to create a moving average that is "responsive to current price activity while maintaining curve smoothness". Hull claims that his moving average "almost eliminates lag altogether and manages to improve smoothing at the same time" This strategy has Lag built in, the signal will...

Count:218
Name: Strategy CCT Bollinger Band Oscillator
Description: This strategy buy when ema crossover CCT BB oscillator and sell when crossunder. No SL neither TP only trailling stop at 1$. CCT BB oscillator is LaztBear indicator. Thanks to him.

Count:217
Name: Fibonacci Moving Averages Input
Description: (FibMAI) Fibonacci Moving Averages Input is a strategy based on moving averages cross-over or cross-under signals. The bullish golden cross appears on a chart when a stock's short-term moving average crosses above its long-term moving average. The bearish death cross appears on a chart when a stock’s short-term moving average, crosses below its long-term moving...

Count:217
Name: Another Millionaire tool
Description: Back with another Millionaire tool script, put like a solid 12 minutes here curve fitting the moving averages. THIS WILL MAKE YOU A MILLIONAIRE. It is so easy, it makes one of the hardest industries very very easy. Works on any market. I'VE DECIDED TO SHARE THE SCRIPT AND MAKE IT PUBLIC SO WE CAN ALL BE RICH TOGETHER, MILLIONAIRES

Count:217
Name: 4-9-18 EMA Cross
Description: Basically the following rules follow: Long when 4 and 9 EMA cross up over the 18 EMA Exit when 4 day crosses down over the 9 day EMA Short when 4 and 9 cross down over the 18 Exit when 4 crosses up back across 9 New Entry signal when both the 4 and 9 are on the same side of the 18 *****Best used on a 4HR TF

Count:217
Name: GMS: Mean Reversion Strategy
Description: This is based on my GMS: Mean Reversion Indicator () Features: - % Based Profit Target and Stop Loss - SMA Trend Filter - Can choose trade exit based off a moving average or linear regression curve - Filter for long only trades, short only trades, or both at the same time. Source code is open, so feel free to take a look! I hope it helps, Andre

Count:217
Name: Noro's Connors RSI Strategy v1.0
Description: Uses: 1) Connors RSI 2) Fast RSI 3) Body of a candle as a filter 4) Color of a candle as a filter Connors RSI www.tradingview.com(CRSI) Fast RSI Simple RSI (period 7)

Count:216
Name: Grid Tool
Description: The core idea of this grid tool is that you have to concentrate less on the trade entries (this happens automatically time-independent but price-dependant) but rather on the validity of the macro trend. Exiting a trend when it is no longer valid is more important than entering a trade. But as long as the trend is valid, the trader participates exponentially in the...

Count:216
Name: Weekly Returns with Benchmark
Description: Some time ago I published Monthly returns table. Now It's time for weekly one. To get it work you need a pretty big screen, but I hope it will be useful for some of you. Features of this table includes: Display weekly returns of your strategy, benchmark, and alpha over this benchmark. Select benchmark to be another instrument Select the date from...

Count:215
Name: Scripting Tutorial 9 - TManyMA Strategy - Long Market Order Only
Description: This script is for a triple moving average strategy where the user can select from different types of moving averages, price sources, lookback periods and resolutions. Features: - 3 Moving Averages with variable MA types, periods, price sources, resolutions and the ability to disable each individually - Crossovers are plotted on the chart with detailed...

Count:215
Name: ATR Mean Reversion Strategy V1
Description: **Long Only Strategy** When Price drops below the ATR band below it will enter a buy on the next candle open SL at current price minus ATR* ATR multiplier TP at Mean EMA or if higher than Mean EMA and current candle low is below previous candle low or if price is above ATR NB: I would highly recommend a low fee broker (I use ICmarkets raw spread account) due to...

Count:215
Name: robotrading linreg
Description: What is Linear Regression? (English) www.tradingview.com (English) www.tradingview.com (Russian) Link This script Straight lines show the last linear regression channel. The smooth lines show the coordinates of the same channel in the past. This allows you to backtest this strategy using past prices. It also makes sure that the linear regression channel...

Count:215
Name: STRATEGY AVERAGE MULTI_SMA
Description: This strategy is based on my script "AVERAGE MULTI_SMA" The strategy is based on the created media, giving BUY signal when the price closes above the average and the average is rising. For the SELL signal the price closes below the average with the average falling. For those who are interested in how the "AVERAGE MULTI_SMA" script works, I ask you to analyze...

Count:215
Name: CCI Strategy Reversed Backtest
Description: The Commodity Channel Index (CCI) is best used with markets that display cyclical or seasonal characteristics, and is formulated to detect the beginning and ending of these cycles by incorporating a moving average together with a divisor that reflects both possible and actual trading ranges. The final index measures the deviation from normal, which...

Count:215
Name: Risk Reduction Ultimate Template
Description: This is a template not actually meant for trading. I picked two random oscillators. This is a template meant to turn into a live trading strategy, however. It's literally just a specialized take profit/stop loss system. It is to ensure your bot doesn't make any bad moves that you wouldn't have manually. The code should be pretty well annotated. Putting this into...

Count:215
Name: Extremely Overfit Bitcoin Long/Short
Description: This is a highly overfit (in my opinion) script to long/short BTC on the 15m time frame. May be usable for other cryptocurrencies or timeframes with some parameter adjustments. I backtested it on a few exchanges with ETH. The simplest way to increase the number of trades is to decrease the "FastChannelLength" parameter or increase the "SlowChannelLength"...

Count:215
Name: SIMPLE CANDLESTICK PATTERN ALGO BACKTESTING - TESLA 4H
Description: Many traders spend a lot of time to create algorithms full of unrealistic and far from reality indicators and market conditions. With this script I want to help traders understand the advantage of the Pine language. Using indicators with no statistical foundation and creating algorithms with technical indicators and thousands of conditions is not always the right...

Count:215
Name: Combo Backtest 123 Reversal & N Bars Up
Description: This is combo strategies for get a cumulative signal. First strategy This System was created from the Book "How I Tripled My Money In The Futures Market" by Ulf Jensen, Page 183. This is reverse type of strategies. The strategy buys at market, if close price is higher than the previous close during 2 days and the meaning of 9-days Stochastic Slow...

Count:215
Name: Alpha strategy
Description: USE ON DAILY TIMEFRAME TO DETECT MOMO STOCKS & ETFs AND TRADE THEM This Strategy goes long when Sharpe Ratio is > 1 and Alpha against the S&P500 is generated. It exits when conditions break away. Strategy can be adapted to run intraday, it however needs different (lower) trigger levels. examples to try this on: GER30, NAS100, JPN225, AAPL, IBB, TSLA, etc.

Count:215
Name: Heikin-Ashi Strategy + backtest range
Description: This is Heikin-Ashi Strategy + Backtest range that I think useful for BTCUSD pair.

Count:215
Name: VIDYA Trend Strategy
Description: One of the most common messages I get is people reaching out asking for quantitative strategies that trade cryptocurrency. This has compelled me to write this script and article, to help provide a quantitative/technical perspective on why I believe most strategies people write for crypto fail catastrophically, and how one might build measures within their...

Count:215
Name: [OKX Signal Bot] Beginner's Guide: RSI Strategy
Description: Welcome to the Beginner's Guide: Creating a Custom Trading Signal on TradingView with OKX Signal Bot Integration. This entry-level script provides a step-by-step reference for beginner TradingView users who want to develop their own trading signal and seamlessly integrate it with the OKX Signal Bot. Using a simple yet effective Relative Strength Index (RSI)...

Count:214
Name: 3 Indicator Strategy (StochRSI, MFI & EMA) With Safety Orders
Description: This strategy uses Stochastic RSI, Money Flow Index and EMA with settings for lower time-frames. It also features safety orders based on 3 different take profit and stop loss methods. Recommended Indicator Settings for lower time-frames; Stoch RSI: 1,1,100,100 MFI: 30 EMA: 100 Take Profit/Stop Loss Settings: There are 3 TP/SL types available; - Pips ->...

Count:214
Name: RSI Average Swing Bot
Description: This is a modified RSI version using as a source a big length(50 candles) and an average of all types of sources for candle calculations such as ohlc4, close, high, open, hlc3 and hl2. In this case we are going to use a 0-1 scale for an easier calculation, where 0.5 is going to be our middle point. Above 0.5 we consider a bullish possibility. Below 0.5 we...

Count:214
Name: Ichimoku with MACD/ CMF/ TSI
Description: This is a very powerful trend strategy designed for markets such as stocks market , stock index and crypto. For time frames I found out that 1h seems to do the trick. Components: Ichimoku full pack MACD histogram CMF oscillator TSI oscillator Rules for entry Long : For Ichimoku:Tenkan part of cloud is bigger than kijun, Chikou is above 0 , close of a candle...

Count:214
Name: Money Tree
Description: Disclaimer Use at your own risk, this is not financial advice! Based on: OCC v5.1 by JustUncleL and the Tradeview built in Chop Zone indicator Merging both the OCC and chopzone allows to filter out some unprofitable trades during choppy times. You can filter out the zones using the checkboxes in the settings. Works well on 15min and 30min candles

Count:213
Name: Yusram Mount MaV - Day MaV CrossOver Strgty
Description: This indicator shows the comparison between the 7-day fast simple average and the monthly slow average of 5 bars. The red line indicates the monthly green and blue lines the daily average. If the Green-Blue line crosses the red upwards, it is a buy signal and the opposite is a sell signal. As soon as it turns green blue without waiting for the sell signal, a sell...

Count:213
Name: Donchian Channels strategy with backtest
Description: Here's another trading strategy for you. This one is based on the standard Donchian Channels. This one will - by default - wait for 2 consecutive higher highs (or lower lows) before taking a position. This can be disabled so the script will take a new trade without waiting for the 2nd high or low. This is useful to avoid getting into a trade when market makers...

Count:213
Name: 2Tier Ichimoku Pyramiding [Takazudo]
Description: Ichimoku based pyramiding strategy example that was tested on 4h TF. makes the first entry when 2Tier Kumo breakout was occurred. makes the extra entries when higher-low (on long) or lower-high (on short) was occurred. uses short term MACD reversal + stop entry as a confirmation of the trend. slack trailing stop loss. changes entry quantity by the...

Count:213
Name: Noro's Aroon Strategy v1.0
Description: Uses only the Aroon indicator. For - any crypto - tf: d1 or w1

Count:213
Name: Price action strategy FOREX with amazing results
Description: Hello, today I bring another amazing strategy for forex . Its made of T3 moving average , combined together with a pattern rule and a specific entry time. We take all of that and we trade it in inverse. So what normally for long would be : close higher than the previos high and close higher than the average, we use this as a short condition. We do the same...

Count:213
Name: VP Backtester skeleton
Description: Simple backtesting skeleton script which uses ATR based stop & profit targets based on the no-nonsense forex way of trading

Count:212
Name: TEMA Cross with Renko Boxes
Description: This is a pretty simple microprofit strategy with a couple twists: Renko boxes plot fixed price changes over variable amounts of time, rather than plotting varying price changes over fixed amounts of time like conventional candlesticks. This makes price trends much simpler to identify, and that's what we ultimately care about. Triple exponential moving average ...

Count:212
Name: Average Highest High and Lowest Low Swinger Strategy
Description: This is a full price action strategy designed for trending markets such as crypto and stocks. Its purely made on calculations for the highest high and lowest low using 2 different length , a faster and a slower one. With those we make multiple averages. Rules for entry: For long: our close of the candle is above both the average using fast and slow line For...

Count:212
Name: Bull Call Spread Entry Strategy
Description: This strategy script uses the "Spread Entry Strength" overlay indicator script I designed to show entry timing optimized for an Option Bull Call Spread. As for this strategy... The defaults for the strategy itself are as follows: Period for strategy: 1/1/18 to 12/1/2021. This can be changed to a different period using the settings. Condition for entry: ...

Count:212
Name: GMS: RSI & ROC Strategy
Description: This is a basic strategy like the RSI one I posted. This one adds in the Rate of Change indicator as well. You can separate the two for RSI only and ROC only. Everything else is the same as the RSI strategy. - Simple moving average trend filter. - Simple moving average trade exit. - Both long and short or each on it's own. The source code should be open if you...


Count:211
Name: Noro's Double RSI Strategy 1.0
Description: Strategy uses only 2 RSI indicators. Slow and fast. If slow RSI > 50 and fast RSI < 50 - to open a long-position If slow RSI < 50 and fast RSI > 50 - to open a short-position If the long-position is open and a candle green - to close a long-position if the short-position is open and a candle red - to close a short-position

Count:211
Name: SLOW RSI OB/OS Strategy
Description: Slowing the RSI down opens up a whole new world of possibilities. This concept can work for a lot of TA indicators including the MACD. See script source code for further description. Feel free to add pyramid trades at your own discretion in your format menu. No this doesn't repaint!

Count:211
Name: T7 JNSAR
Description: JNSAR stands for Just Nifty -0.14% Stop & Reverse. This is a Trend Following Daily Bar Trading System for NIFTY -0.14% . Original idea belongs to ILLANGO @ I coded the pine version of this system based on a request from @stocksonfire. Use it at your own risk after validation at your end. Neither me or my company is responsible for any losses you may incur using...

Count:211
Name: Alpha strategy - simple version
Description: This Strategy goes long when Sharpe Ratio is > 1 and Alpha against the S&P500 is generated. It exits when conditions break away. en.wikipedia.org(finance). Use on daily or 5min.

Count:210
Name: Simple Strategy Code Stub
Description: This is a very basic strategy implementation Use as a code stub for your strategy code. I wrote it because I could not find one. This particular strategy goes long on Tuesdays at 10 am and goes short at 3 pm on Thursdays. Because US markets open at 9:30 you have to have your chart in 30 minute or less resolution for trades to fire. You can gut that code...

Count:210
Name: expected range STRATEGY
Description: This is the strategy version of "expected range STUDY". The buy and sell signals are generated with the study version, but what is displayed on the chart is different. Here, the PnL of each trade is shown on the chart, as well as the peak profit point of each trade up till the present. Black areas represent take profit and waiting for the next trade to start....

Count:210
Name: Combing in MACD and MTF
Description: Hi all, I'm trying to wedge in the MACD into a multiple timeframe. Scope is to create: 1) an alert when the MACD across all timeframes is positive, 2) an alert when the MACD across all timeframes is negative, and 3) one when neither of them is applicable. Would anyone be so kind to give it some thoughts, please? //@version=2 strategy(" Easy MTF Strategy",...

Count:210
Name: Dual-Supertrend with MACD - Strategy [presentTrading]
Description: ## Introduction and How it is Different The Dual-Supertrend with MACD strategy offers an amalgamation of two trend-following indicators (Supertrend 1 & 2) with a momentum oscillator (MACD). It aims to provide a cohesive and systematic approach to trading, eliminating the need for discretionary decision-making. Key advantages over traditional single-indicator...

Count:209
Name: Buy Monday, Exit Tuesday with Stop Loss and Take Profit
Description: Strategy to go long at end of Monday before market closes and exit before Tuesday close, or at stop loss or take profit percentages This runs strategy on entering by weekday name and also by session time. Implemented are also Take Profit and Stop Loss to exit position using custom inputs. Added stoploss and take profit plot lines

Count:209
Name: SimpleCrossOver_Bot
Description: This is a simple example of how you can compile your own strategy This script contains the code for alerts and for backtesting. In order to use the backtester, comment out the sections to be used for signals, and comment in the sections to be used on the back tester, and visa versa for using the script for alerts in order to automate your own bot.

Count:209
Name: Swing Trend Strategy
Description: This script is a trend following system which uses a long term Moving Average to spot the trend in combination with the Average True Range to filter out Fakeouts, limiting the overall drawdown. Default Settings and Calculation: - The trend is detected using the Exponential Moving Average on 200 periods. - The Average True Range is calculated on 10 periods. -...

Count:209
Name: Double Bollinger Bands Strategy
Description: Double Bollinger Strategy. Price crosses inner BB (with increasing outer BB) long is placed. Long is closed when price closes below outer BB. Reversed for short. The numbers are tuned for NZDUSD 15min chart. Pbin = percent on inner BB Pbout = percent on outer BB There are all kinds of other inputs, trailing stop, limit, etc. Errors, questions, suggestions are...

Count:209
Name: Low volatility Buy w/ TP & SL (Coinrule)
Description: The compression of volatility usually leads to expansion. When the breakout comes, it can ignite strong trends. One way to catch a coin trading in an accumulation area is to spot three moving averages with values close to each other. The strategy uses a combination of Moving Averages to spot the best time to buy a coin before its breakout. Buy Condition ...

Count:209
Name: TheBigBangTraders Breakout
Description: Name: TheBigBangTraders Breakout Category: Trend Follower Operating mode: Spot Trades duration: Intraday Timeframe: 1H Suggested usage: the purpose of this strategy is to help to investigate if the asset is sensitive to breakout approach. Entry: Trigger point can be choose by the user between: High of the N days ago High of the N weeks...

Count:209
Name: EVWBB Strategy [QuantNomad]
Description: It's my new strategy using EVWMA (Elastic Volume Weighted Moving Average). Now I created a Bollinger Bands strategy where basis level is EVWMA. It looks pretty interesting but you have to be careful with the entries/exits on the same bar, I'm using stop orders, so on big moves it happens pretty often. In the next version, I will try to eliminate these issues....

Count:208
Name: BitMex Trailing Stop Strategy
Description: This script is designed for those who want to use BitMex's trailing stop. It's not meant to be used as entry exits, but rather to get an idea of how wide the trailing stop needs to be. I suggest you backtest with different values. The script can also be integrated into an existing strategy which does give entry/exits to act as its stop loss.

Count:208
Name: Simple EMA Crossing Strategy TradeMath
Description: Simple EMA Crossing strategy, based on crossover Fast exponential moving average = EMA21 and Slow exponential moving average = EMA55. Default stop loss is 3%, but you can change it. Default take profit is 9%, it based on stop loss. Risk to Reward ratio is 1 to 3. Strategy was tested on BTCUSDT 1H timeframe and works fine with these parameters.

Count:208
Name: Noro's Fast RSI Strategy v1.3
Description: In 1.3 added: + Min/Max + Arrows For: - crypto/fiat - crypto/crypto - timeframes: 1hour, 30min, 15min, 5min Strategy uses 2 indicators: 1) RSI indicator, period = 7 (default) 2) EMA Body, period = 30 EMA Body Step 1. The candle body size is calculated = abs(close-open) Step 2. The average size of a body of a candle is calculated. Only 30 last...

Count:207
Name: 3 RSI 6sma/ema ribbon crypto strategy
Description: This is a very efficient swing trading strategy designed for crypto long timeframes like 2h+. Initially we have 3 RSI . AFter that we use them as source for 6 SMA/EMA for each RSI, 5, 30, 50, 70, 90, 100. With those we create a ribbon that we are going to use in order to check the direction of the trend. Rules for entry: For long : if either all the...

Count:207
Name: MACD Crossover trend strategy, Long and Short
Description: Hey everybody, This is my first strategy and script I wrote mostly myself. There's tons of content out there to learn how to code in Pinescript and it's exactly what I wanted and needed in this time of my life. In any case, I made a rather simple MACD crossover strategy that only takes trades in the direction of both EMA and SMA (there are inputs to change the...

Count:207
Name: Crypto swing correlation RSI and SMA
Description: This is a crypto swing strategy, designed for long term periods and correlated pairs with crypto market total(or other coins used as correlation, however I recommend total of crypto or btc) Its components are: RSI with a very length Correlation candles SMA 9 Rules for entry: For long : RSI is above 51 level and going higher and close of the candle is above...

Count:207
Name: EMA_HMA_RSI_Strategy
Description: This strategy BUYS when HMA is below EMA (default setting is 200) and HMA turning to green and RSI 13 is below 70 Adds to existing position when current price is below BUY price and RSI crossing above 30 or 40 Exits the long position when HMA crosses down EMA when you select Take Profit setting , partial profits are taken when current price > BUY...

Count:207
Name: Combo Backtest 123 Reversal & MA Displaced Envelope
Description: This is combo strategies for get a cumulative signal. First strategy This System was created from the Book "How I Tripled My Money In The Futures Market" by Ulf Jensen, Page 183. This is reverse type of strategies. The strategy buys at market, if close price is higher than the previous close during 2 days and the meaning of 9-days Stochastic Slow...

Count:207
Name: Heikin-Ashi Change Strategy/ Indicator
Description: Today I bring you a simple and efficient indicator/strategy based only on HA. Can be used together with other TA tools or alone. The idea behind is simple : We have to forms to calculate the candle, using inner HA candles or normal candles. Once we have that we apply certain rules to get the max high, min low, open and close(ohlc) With that then we check for...

Count:207
Name: Take Profit On Trend v2 (by BHD_Trade_Bot)
Description: The purpose of strategy is to detect long-term uptrend and short-term downtrend so that you can easy to take profit. The strategy also using BHD unit to detect how big you win and lose, so that you can use this strategy for all coins without worry about it have different percentage of price change. ENTRY The buy order is placed on assets that have...

Count:207
Name: Kaufman Moving Average Adaptive (KAMA) Backtest
Description: Everyone wants a short-term, fast trading trend that works without large losses. That combination does not exist. But it is possible to have fast trading trends in which one must get in or out of the market quickly, but these have the distinct disadvantage of being whipsawed by market noise when the market is volatile in a sideways trending market. During...

Count:207
Name: [RS]Function Martingale Multiplier V0
Description: EXPERIMENTAL: WARNING:Martingale is susceptible to huge drawdown spikes, use at your own risk. simple functions for martingale wins and losses, multiplier can be adjusted manually to increase/decrease performance/drawdown.

Count:207
Name: Hull Trend with Kahlman Strategy Backtest
Description: A simple backtest version of a Hull Trend with Kahlman strategy

Count:207
Name: Inside Bar Failure
Description: You can check edge profitability by adjusting the forward looking input, eg. how profitable is this signal after X bars.

Count:207
Name: I Like Winners And Love Loosers!
Description: Maby you could, use this simple long/short strategy with a few % leverage to work around your hodl position?

Count:206
Name: CM Vix V3 Strategy
Description: ChrisMoody developed an indicator VIX , I combined it with DEMA and share here for a long time ago ( ) I wanted to share this indicator's version 3 as a strategy. If you like it, we can combine it with other indicators together.


Count:206
Name: CoG SSL BF 🚀
Description: In this strategy I combine my Center of Gravity script with my SSL Channel script. The conditions for a long signal are if either: Center of Gravity long is satisfied Or SSL Channel long is satisfied AND we are not in a sideways period. The conditions for a short signal are if either: Center of Gravity short is satisfied Or SSL Channel short is satisfied AND...

Count:206
Name: 50EMA/200SMA Cross Signal
Description: Simple 50ema cross over/under 200sma to signal buy/sell, works better on Daily charts

Count:206
Name: Noro's Channel Close Strategy
Description: For: - BTC/USD (or XBT/USD, or BTC/USDT) and ETH/USD (or ETH/USDT) - timeframe 4h Strategy Donchain Channel is used. If the candle is closed above the top line of the channel, open the long (and close the short) If the candle has closed below the bottom line of the channel - you must open the short (and close the long) Reverse trading. Take-profit and...

Count:206
Name: VBand Strategy
Description: VBand Strategy is simply used Vwap funcation and atr 14 for find the entry and exit points. This simple Strategy.

Count:206
Name: SPAS - Single Price Action Strategy
Description: This strategy is based on a single price action analysis, where volume and price changes will trigger buy and sell orders. This strategy also can be used in combination with alerts to trigger orders in other exchanges or systems. Best performance is currently achieved using 4H timeframe.

Count:205
Name: 9:22 5 MIN 15 MIN BANKNIFTY
Description: 9:22 5 MIN 15 MIN BANKNIFTY Strategy with Additional Filters The 9:22 5 MIN 15 MIN BANKNIFTY Strategy with Additional Filters is a trend-following strategy designed for trading the BANKNIFTY instrument on a 5-minute chart. It aims to capture potential price movements by generating buy and sell signals based on moving average crossovers, breakout confirmations,...

Count:205
Name: [VJ]First Candle Strategy
Description: Hello Traders, this is a simple intraday strategy involving the first candle of the day with an additional twist to the traditional style . You can modify the time of candle on the stock and see what are your best picks. Comment below if you found something with good returns Strategy: Observe the first candle of the day within any time frame. 15m works best....

Count:205
Name: J2S Backtest: Steven Primo`s Big Trend Strategy
Description: Is it possible to benefit from big trend moves? In this study I present you a strategy that aims to capture big trend moves. Created by trader Steven Primo, The Big Trend strategy is advocates and shared through his YouTube channel without restrictions. Note: This is not an investment recommendation. The purpose of this study is only to share knowledge with...

Count:205
Name: Advanced Trend Detection Strategy
Description: The Advanced Trend Detection Strategy is a sophisticated trading algorithm based on the indicator "Percent Levels From Previous Close". This strategy is based on calculating the Pearson's correlation coefficient of logarithmic-scale linear regression channels across a range of lengths from 50 to 1000. It then selects the highest value to determine the length for...

Count:205
Name: HMA-Kahlman Strategy with pivoting
Description: Tested with EURUSD on 5M time frame this strategy leverages the same simplified strategy setup.

Count:205
Name: Z-Score Strategy Backtest
Description: The author of this indicator is Veronique Valcu. The z-score (z) for a data item x measures the distance (in standard deviations StdDev) and direction of the item from its mean (U): z = (x-StdDev) / U A value of zero indicates that the data item x is equal to the mean U, while positive or negative values show that the data item is above (x>U) or below...

Count:204
Name: Ichimoku Long and Short Strategy
Description: This is a script which tell u when all the parameters in the ichimoku are positive or negative this to open a long or short. Conditions to show a long: -Ichimoku cloud in green -Price Close above Ichimoku cloud -Lagging span above cloud -Conversion line above base line Conditions to show a short: -Ichimoku cloud in red -Price close below Ichimoku...

Count:204
Name: Initial Balance Panel Strategy for Bitcoin
Description: Initial Balance Strategy Initial Balance Strategy uses a source code of "Initial Balance Monitoring Panel" that build from "Initial Balance Markets Time Zones - Overall Highest and Lowest". Initial Balance is based on the highest and lowest price action within the first 60 minutes of trading. Reading online this can depict which way the market can trend for the...

Count:204
Name: SEMA-X
Description: SEMA-X (sema cross) It's a simple EMA cross strategy Rules of strategy 1. 2 EMA crossing 2. Long (Golden Cross), Short (Dead Cross) 3. Target profit, stop loss setting You can also get big trend gains if you set a long target price. * * * SEMA-X (세마크로스) 간단한 EMA 교차 전략 입니다. 전략의 규칙 1. 2개의 EMA 교차 2. 매수(골든 크로스), 매도(데드...

Count:204
Name: Zlema Strateg Long 5m
Description: Just putting this out there. I created this Strategy based on Everget Zlema. Opens long trade when Zlema changes color. It is profitable as it is, but just putting it out to the community to see if someone else has ideas to make it better. How to make this strategy better? 1. FInd a way to filter ranging bad trades. 2. Trades would be more profitable if entry...

Count:204
Name: Moving Average Crossover Strategy
Description: The Moving Average Crossover indicator uses 3 moving averages (2 simple moving averages and 1 exponential moving average ) to signal long and short opportunities based on moving average crossovers. This strategy serves as a backtest to that indicator. By taking entry and exit positions based on moving average crossovers, we are able to project profit with this...


Count:203
Name: EMA+MACD
Description: A simple script using EMA 25 and EMA 50 with MACD. Enter long when EMA 25 crossover ema 50 and MACD line > 0, enter short when EMA 50 crossover ema 25 and MACD < 0

Count:203
Name: Exponential Stochastic Strategy
Description: what is Exponential Stochastic? it is a modified version of the stochastic indicator. This strategy does not include pyramiding, repaint, trailing stop or take profit. what it does? It contains an extra input in addition to the stochastic indicator. Thanks to this input, different exponential weights can be given to the outputs and the indicator can be made more...
Count:203
Name: Gaussian MFI BF 🚀
Description: The signals are based on the Gaussian Channel calculated by Donovan Wall. Thanks also to Kiasaki for Rate of Change code. Simply going long and short based on Gaussian channel was not consistent enough so I also included an MFI filter. We only go long if Money Flow Index is greater than the last candle (more money is flowing in than out). The opposite for short....

Count:203
Name: Combo Backtest 123 Reversal & Cueing Off Sup/Res Levels
Description: This is combo strategies for get a cumulative signal. First strategy This System was created from the Book "How I Tripled My Money In The Futures Market" by Ulf Jensen, Page 183. This is reverse type of strategies. The strategy buys at market, if close price is higher than the previous close during 2 days and the meaning of 9-days Stochastic Slow...

Count:203
Name: Volatility Breakout Strategy [Angel Algo]
Description: As traders, we're always looking for opportunities to profit from sudden price breakouts, and the Volatility Breakout Strategy aims to do just that. This script is the perfect starting point for traders who want to experiment with capturing price movements resulting from increased volatility. The script plots the Average True Range (ATR) on the chart, which is a...

Count:203
Name: Combo 2/20 EMA & Absolute Price Oscillator (APO)
Description: This is combo strategies for get a cumulative signal. First strategy This indicator plots 2/20 exponential moving average. For the Mov Avg X 2/20 Indicator, the EMA bar will be painted when the Alert criteria is met. Second strategy The Absolute Price Oscillator displays the difference between two exponential moving averages of a security's price and...

Count:203
Name: RSI Strategy EUR/USD 1H 700%
Description: A rsi strategy that has potential to do over 700% annually on the EURUSD 1h

Count:203
Name: Stochastic RSI Backtest
Description: This strategy used to calculate the Stochastic RSI You can change long to short in the Input Settings WARNING: - For purpose educate only - This script to change bars colors.

Count:203
Name: MA Crossover Strategy with MA Turning Point Exits + ADX filter
Description: This strategy uses @rthomson's "MA Crossover Strategy with MA Turning point Exits" and combines it with ADX. This strategy filters out any entries where ADX < 20. In fact you can set the value for ADX threshold. (Generally value under 20 for ADX is considered as non trend zone)

Count:202
Name: BTC strategy for margin trading
Description: Almost identical to the one I published before, but this one includes short orders as well. I didn't spend much time backtesting, so there may be a different set of parameters that gives better results. Please let me know if you find something!

Count:202
Name: Hobbiecode - RSI + Close previous day
Description: This is a simple strategy that is working well on SPY but also well performing on Mini Futures SP500. The strategy is composed by the followin rules: 1. If RSI(2) is less than 15, then enter at the close. 2. Exit on close if today’s close is higher than yesterday’s high. If you backtest it on Mini Futures SP500 you will be able to track data from 1993. It is...

Count:202
Name: Combo Backtest 123 Reversal & Dynamic Momentum Index
Description: This is combo strategies for get a cumulative signal. First strategy This System was created from the Book "How I Tripled My Money In The Futures Market" by Ulf Jensen, Page 183. This is reverse type of strategies. The strategy buys at market, if close price is higher than the previous close during 2 days and the meaning of 9-days Stochastic Slow...

Count:202
Name: Configurable BB+RSI+Aroon strategy backtest for binary options
Description: I wanted to share this strategy that I use myself for binary options trading. After trading binary options for several years I have learned that every single day is unique... assets behave differently every single day. So, when I start the day I want to know which is the optimum combination of parameters in my indicators that will give me the signals I want...

Count:202
Name: EURUSD COT Trend Strategy
Description: This is a long term/investment type of strategy designed to have a good idea about where the big trend direction is headed. Its logic, its made entirely on the COT report, mainly from looking into the net non comercial positions aka the speculators. For bullish trend we look that the difference between long non comercial vs short non comercial is higher than...

Count:202
Name: Toby Crabel's narrow range with historical volatility
Description: 1. Find bar with the smallest narrow range for a chosen period. Use hvol for filter. 2. Place stop-order for long position at previous high and stop-order for short at previous low to catch breakout in any direction. 3. Take profit on the next bar.

Count:202
Name: Noro's Wizard Strategy v1.1
Description: For: - Crypto/Fiat - H1 timeframe Indicators: - Bollinger Bands (length = 40) - RSI (length = 7) - Body-filter - Color-filter Strategy The lime line is the lower line of the BB indicator which is under construction at the candle low prices. If low of a candle is lower than the lime line and at the same time RSI < 25 = to open a long-position If the candle...

Count:202
Name: Chaikin Volatility Strategy Backtest
Description: Chaikin's Volatility indicator compares the spread between a security's high and low prices. It quantifies volatility as a widening of the range between the high and the low price. You can use in the xPrice1 and xPrice2 any series: Open, High, Low, Close, HL2, HLC3, OHLC4 and ect... You can change long to short in the Input Settings Please, use it only for...

Count:201
Name: Trend Following based on Trend Confidence
Description: This is a Trend Following strategy based on the Trend Confidence indicator. The goal of this strategy is to be a simple Trend Following strategy, but also to be as precise as possible when it comes to the question 'how confident are we that a linear trend is ongoing?'. For this we calculate the 'confidence' of a linear trend in the past number of closing prices....

Count:201
Name: TemaRSI Strategy
Description: This strategy uses a triple exponential moving average (Tema) and RSI to find buy points and uses stops, trailing stops and take profit to exit. Draft 1.

Count:201
Name: Noro's Martingale Strategy v1.0
Description: Martingale - very dangerous strategy Strategy If the candle red - to buy ( + Martingale ) If the candle green - everything to sell

Count:201
Name: Kozlod - RSI Strategy - 1 minute - ETHUSD
Description: Trying to find simple strategies with optimal parameters which work well for certain symbols/timeframe. Found that basic RSI strategy without any position management works pretty good for 1m chart for BTCUSDT. It might not work very good on it's not but can give you a pretty good base for more complicated indicators. Also, some position management as simple as...

Count:201
Name: Donchian Channel Width Strategy
Description: The Donchian Channel was developed by Richard Donchian and it could be compared to the Bollinger Bands. When it comes to volatility analysis, the Donchian Channel Width was created in the same way as the Bollinger Bandwidth technical indicator was. You can change long to short in the Input Settings WARNING: - For purpose educate only - This script to change...

Count:201
Name: Average Down
Description: This strategy has been published for a Pyramiding tutorial on the Backtest Rookies website. For a full overview of the code and an introduction to Pyramiding check out our site. Summary The code example will create a simple script that allows us to average down whenever our portfolio is down x%. The idea will be to bring our average cost down so that we can...

Count:201
Name: BOLLY Bands
Description: This is a strategy using Bollinger Bands. The strategy is predicated around having low volatility in price action and then looking to capture a move when price starts to trend outside of the Bollinger bands. This strategy has only been backtested for 1 month but it has promising results so I will be sharing it looking for feedback. I run this strategy on the ERUSD...

Count:201
Name: Hourly Bias on BTC in Bullish USA Session “Green Eagle”
Description: Name: Hourly Bias on BTC in Bullish USA Session Category: Hourly Bias Operating mode: Spot, only long Trades duration: Intraday, 11 bars Timeframe: 1H Suggested usage: When the market is compressed, USA session has a bullish bias. Entry: enter Long at 15:00 on specific days of the week. There is a volatility filter based on ATR which identifies...

Count:201
Name: EMA Bounce Strategy
Description: Simple strategy that checks for price bounces over an Exponential Moving Average. If the CLOSE of the candle bounces back from having it's LOW below the EMA then it's a Bull Bounce. If the CLOSE of the candle bounces down from having it's high above the EMA then it's a Bear Bounce. This logic can be reversed.

Count:200
Name: Highest High and Lowest Low channel Backtest
Description: Highest High and Lowest Low channel Strategy You can change long to short in the Input Settings Please, use it only for learning or paper trading. Do not for real trading.

Count:200
Name: Combo Backtest 123 Reversal & Prime Number Bands
Description: This is combo strategies for get a cumulative signal. First strategy This System was created from the Book "How I Tripled My Money In The Futures Market" by Ulf Jensen, Page 183. This is reverse type of strategies. The strategy buys at market, if close price is higher than the previous close during 2 days and the meaning of 9-days Stochastic Slow...

Count:200
Name: Morning Scalp Strategy
Description: The Morning Scalp Strategy combines the 50EMA with the Stochastic Momentum Index. The morning period is when penny stocks usually have the highest volatility, so the strategy works between 10:00 AM and 12:10 PM. ***It opens only long positions. The ideal timeframe for this scalping strategy is 5 minutes on low-price stocks. The stock should spike in the morning...

Count:200
Name: Bollinger Bands Trending Reverse Strategy
Description: Welcome to yet another script. This script was a lot easier since I was stuck for so long on the Donchian Channels one and learned so much from that one that I could use in this one. This code should be a lot cleaner compared to the Donchian Channels, but we'll leave that up to the pro's. This strategy has two entry signals, long = when price hits lower band,...

Count:199
Name: ChannelBreakOutStrategy - With Time Frames
Description: This is ChannelBreakOutStrategy and you can also include the time frames.

Count:199
Name: Combo Backtest 123 Reversal & Awesome Oscillator (AO)
Description: This is combo strategies for get a cumulative signal. First strategy This System was created from the Book "How I Tripled My Money In The Futures Market" by Ulf Jensen, Page 183. This is reverse type of strategies. The strategy buys at market, if close price is higher than the previous close during 2 days and the meaning of 9-days Stochastic Slow...

Count:199
Name: SSL Channel BF
Description: SSL Channel Close is a great all-rounder based on 2 Simple Moving Averages, one of recent Highs, one of recent Lows. The calculation prints a channel on the chart consisting of 2 lines. This strategy gives a Long signal when price closes above the top of these 2 lines and a Short signal when it closes below the bottom. Trading in choppy sideways markets can...

Count:198
Name: Impulse BF 🚀
Description: Thanks to rasantos for the idea for this strategy. The 2 lines are based on the sum number of impulses for x bars back. So total "up impulses" is the sum of the bars where price closed higher, and vice versa for "down impulses". The strategy is simple - a long signal is generated when the total up impulses exceeds the total down impulses. A short signal is...

Count:198
Name: SSL Chaikin BF 🚀
Description: Combined my earlier SSL Channel script with the Chaikin Money Flow indicator. Link to the SSL Channel script here: INSTRUCTIONS Look at the background, the signals are represented by the colors. Bright green = long signal from SSL Channel Bright blue = long signal from Chaikin Money Flow Bright red = short signal from SSL Channel Bright orange = short...

Count:198
Name: ATR smoothed by Hull MA
Description: This is Average True Range indicator, but it is smoothed with Hull MA ( not WMA etc ) It is set to overlay the candles so looks different from normal ATR but i assure you it is ATR Script open so you can see for yourself. perhaps different settings are better, Help me test it, and suggest improvements thankyou

Count:198
Name: Strategy for The Bitcoin Buy/Sell Indicator
Description: This is the strategy for Starting with a capital of $3,000 XBT , one might have $15,975 dollar worth of XBT plus whatever the bitcoin has appreciated over the years. The Sharpe Ratio: 0.586, Net Profit is 532%, 57 closed trades from 2017 till today, Profit factor of 3.745 (aka for every dollar loss, there is 3.745 dollar profit) with 14% drawdown . Let...

Count:198
Name: Ichimoku + RSI Crypto trending strategy
Description: This is a crypto trending strategy designed for big timeframes such as 3-4h+. Its components are: RSI ICHIMOKU full pack Heikin Ashi candles for logic calculation inside Rules for entry. For long : we have a long cross condition on ichimoku and price is above the ichimoku lines, and at the same time RSI value is > 50. For long : we have a short cross condition...

Count:198
Name: Forecasting - Least Squares Regression
Description: Tested on 5m TF with EURUSD. Settings should be modified appropriately for other TFs, lookbacks and securities. This indicator does not repaint.

Count:198
Name: Pramod’s Intraday Strategy
Description: If Open = High, Short with 0.25% Stop Loss and 0.5% Take Profit If Open = Low, Long with 0.25% Stop Loss and 0.5% Take Profit This strategy is given by desipplz.

Count:197
Name: Three EMAs Trend-following Strategy (by Coinrule)
Description: Trend-following strategies are great because they give you the peace of mind that you're trading in line with the market. However, by definition, you're always following . That means you're always a bit later than your want to be. The main challenges such strategies face are: Confirming that there is a trend Following the trend, hopefully, early enough to...

Count:197
Name: Camarilla Pivot Points Backtest
Description: Pivot point studies highlight prices considered to be a likely turning point when looking at values from a previous period, whether it be daily, weekly, quarterly or annual. Each pivot point study has its own characteristics on how these points are calculated. Red color = Sell Green color = Buy WARNING: - For purpose educate only - This script to...

Count:197
Name: Trend Following or Mean Reverting
Description: The strategy checks nature of the instruments. It Buys if the close is greater than yesterday's high, reverse the position if the close is lower than yesterday's low and repeat the process. 1. If it is trend following then the equity curve will be in uptrend 2. If it is mean reverting then the equity curve will be downtrend Thanks to Rayner Teo.

Count:197
Name: Jaws Mean Reversion [Strategy]
Description: This very simple strategy is an implementation of PJ Sutherlands' Jaws Mean reversion algorithm. It simply buys when a small moving average period (e.g. 2) is below a longer moving average period (e.g. 5) by a certain percentage and closes when the small period average crosses over the longer moving average. If you are going to use this, you may wish to apply...

Count:197
Name: Noro's Brakeout Strategy v1.0
Description: For: - only for H4! - crypto/fiat - crypto/crypto

Count:197
Name: MACD+ Strategy [SystemAlpha]
Description: This is a strategy based on MACD Oscillator . Instead of using just the normal crossovers, we use trend filters, trailing stop loss and take profit targets. This strategy was developed for crypto, forex and stocks on daily timeframe but feel free to experiment on 15 minutes or higher using heikin ashi or normal candles In this strategy you have a choice...

Count:197
Name: Combo Backtest 123 Reversal & High Low Bands
Description: This is combo strategies for get a cumulative signal. First strategy This System was created from the Book "How I Tripled My Money In The Futures Market" by Ulf Jensen, Page 183. This is reverse type of strategies. The strategy buys at market, if close price is higher than the previous close during 2 days and the meaning of 9-days Stochastic Slow...

Count:197
Name: Daily HIGH/LOW strategy
Description: This is a DAILY High/LOW strategy combined with a moving average and volume for more accuracy. The rules are simple : For long if we had a cross of the high with the previous high and close of the candle is above moving average and chaikin money flow volume is positive we have a long entry. We exit when we cross down the moving average with the close of the...

Count:196
Name: Forex Master v2.0 (EUR/USD)
Description: This is version 2 of my Forex Master algorithm originally posted here: BACKTEST CONDITIONS: Initial equity = $100,000 (no leverage) Order size = 100% of equity Pyramiding = disabled TRADING RULES: Long entry = EMA5(RSI20) cross> 50 Profit limit = 50 pips Stop loss = 50 pips Short entry = EMA5(RSI20) cross< 50 Profit limit = 50 pips Stop loss =...

Count:196
Name: XPloRR MA-Buy ATR-Trailing-Stop Long Term Strategy Beating B&H
Description: XPloRR MA-Buy ATR-MA-Trailing-Stop Strategy Long term MA Trailing Stop strategy to beat Buy&Hold strategy None of the strategies that I tested can beat the long term Buy&Hold strategy. That's the reason why I wrote this strategy. Purpose: beat Buy&Hold strategy with around 10 trades. 100% capitalize sold trade into new trade. My buy strategy is triggered by the...

Count:196
Name: Jigga - Survival Level
Description: Hi All !! Its always the case that we buy a stock and it starts falling !! What a new investor will do is to add few more on downfall and then few more until they stuck all their case to same falling stock. I thought to create a level which can help long term investor on when to buy and sell. Logic: I have used multiple indicators logic all into one and find...

Count:196
Name: CMYK XIAM OPEN
Description: ◊ Introduction This is project XIAM, a work in progress. Recently i came across the repainting problem. Since then i haven't seen any bot-code that makes > 5% profit in two weeks with 0.25% fees/trade. People who make good bots either bluff or don't share the code. they let you rent it. I aim to understand, learn it, write it myself. And share my findings...

Count:196
Name: Lagged Donchian Channel + EMA
Description: This strategy is based on a lagged 24 periods Donchian Channel and a 200 periods EMA . The enter positions are calculated this way : Bull entry 1. we wait for the close of a candle below the channel and it must be below the 200 EMA 2. the following candle must be a green one and close in the lagged channel 3. we put a long order at the close of the...

Count:196
Name: Combo Backtest 123 Reversal & Signal To Noise
Description: This is combo strategies for get a cumulative signal. First strategy This System was created from the Book "How I Tripled My Money In The Futures Market" by Ulf Jensen, Page 183. This is reverse type of strategies. The strategy buys at market, if close price is higher than the previous close during 2 days and the meaning of 9-days Stochastic Slow...

Count:196
Name: Breakout Range Long Strategy Backtest
Description: Breakout Range Long Strategy You can change long to short in the Input Settings Please, use it only for learning or paper trading. Do not for real trading.

Count:195
Name: Noro's Advanced Bollinger Bands Strategy v1.0
Description: "ABB" - "Advanced Bollinger Bands" For: - any pair - w1, d1, h1 Percent: - 25 for d1 - 20 for h1 if the price is lower than the lower line of "ABB" = to open a long position if the candle is green (closing > opening) = to close a long position

Count:195
Name: A.I.Driven Aggressive Intraday Models For 20190610
Description: (New to TradingView and trying to learn how best to share our daily Model Trades with the awesome community here. Still learning the tools here and may not be using the best approaches to publish ideas/charts/scirpts - please help us learn by suggesting best practices) >>>>> Model Trades Published pre-market this morning at tradersai blogspot <<<<< *****...

Count:195
Name: Full Crypto Swing Strategy ALMA Cross with MACD
Description: This is a full crypto swing strategy designed. From my testing it looks like it perform the best on timeframes 4h +. The below example has been adapted to BNB/USDT, using the entire period since 2017 until present day, with a comission of 0.03% ( which is the comission for the futures on binance). Its components are : ALMA Fast ALMA Slow MACD Histogram Rules...

Count:195
Name: Combo Backtest 123 Reversal & Ergodic CSI
Description: This is combo strategies for get a cumulative signal. First strategy This System was created from the Book "How I Tripled My Money In The Futures Market" by Ulf Jensen, Page 183. This is reverse type of strategies. The strategy buys at market, if close price is higher than the previous close during 2 days and the meaning of 9-days Stochastic Slow...

Count:195
Name: Engulfing below EMA 120
Description: Buy bullish engulfing above EMA 24 Sell bullish engulfing below EMA 24 Mercurius A.M.

Count:194
Name: "Buy signal" from Cipher B for 3commas
Description: This is another modification for cipher B indicator from VuManChu. I also would like to acknowledge "The Art of Trading" channel in youtube for their mastery pine script course. This script is designed to send alerts to 3commas platform. In strategy.entry in comment option, you can incorporate your token for your bot. The buy signal accomplishes only when BTC is...

Count:194
Name: Chikou Crossover
Description: A very simple Ichimoku Cloud strategy. Buy when Chikou Span crosses above price. Sell when Chikou Span crosses below price.

Count:194
Name: RSI(2) Buy/Sell Signal
Description: Long/Short entry signaling based on extreme RSI-2 values. The modeling indicates this a good strategy. It's possible to improve profitability by using discretion to enter trades at a more optimal price (i.e. close of the signaled day rather than the open of the following day) and to let the trades run a little longer, but I have not been successful in scripting...

Count:194
Name: Combo Backtest 123 Reversal & Money Flow Indicator
Description: This is combo strategies for get a cumulative signal. First strategy This System was created from the Book "How I Tripled My Money In The Futures Market" by Ulf Jensen, Page 183. This is reverse type of strategies. The strategy buys at market, if close price is higher than the previous close during 2 days and the meaning of 9-days Stochastic Slow...

Count:194
Name: HURST Channel Strategy
Description: Based on the work TJS / Trading Zoom / Svoboda Strategy based on Hurst channel with loss averaging when an open position is below 0.5 channel range. How it works: 1. opens the long position when the close price crosses over the lower band (from bottom to top) 2. opens additional position (double in size) when average position price is lower than average channel...

Count:194
Name: The Matrix 7.0 Strategy
Description: The Matrix is meant to trade sideward trending markets with intrinsic values (unlikely to move outside upper and lower boundaries) like Silver and Tbonds, to name a few. The Matrix is is not affected by unforeseen market conditions and biased expectations, it simply buys low and sells high and it has proven to be more profitable when price gaps occur. Trading...

Count:194
Name: Breakout Reversal Entry on WMA - NG1! Overnight ver 1
Description: This script is for learning purposes only This strategy will plot arrows when price breaks so far above/below WMA. The strategy will enter when the price breaks away from WMA. All entries are reversals. Users can set WMA length and source; also the distance of the price away from WMA to enter. Adjustable bracket orders are placed for exit, with trailing stop...

Count:194
Name: Noro's ZZ-3 Strategy
Description: ZZ without ZigZag :) For: - crypto - timeframe 1d (without short position) - or h4

Count:193
Name: Combo 2/20 EMA & Bill Awesome Oscillator (AC)
Description: This is combo strategies for get a cumulative signal. First strategy This indicator plots 2/20 exponential moving average. For the Mov Avg X 2/20 Indicator, the EMA bar will be painted when the Alert criteria is met. Second strategy This indicator plots the oscillator as a histogram where blue denotes periods suited for buying and red . for...

Count:193
Name: P-Signal Strategy
Description: This is an example of building a trading strategy based on a p-signal. The p-signal indicates the entropy of the state of the D frame system for the BTCUSD pair in the Kolmogorov probability space.

Count:193
Name: Ichimoku Cloud Strategy Idea
Description: This strategy idea uses the famous Ichimoku Cloud (Forward-shifted SMA-9 and SMA-26) and Chiku (52-candle lagged close price) with its default parameters. This strategy is slow and issues few signals. However, this is one of the most performant long-term trend trading strategies. It usually works well on 1D and 4H timeframes and even better on trending...

Count:192
Name: RSI and MA with Trailing Stop Loss and Take Profit (by Coinrule)
Description: The relative strength index is a momentum indicator used in technical analysis. It measures the speed and magnitude of a coin's recent price changes to evaluate overvalued or undervalued conditions in the price of that coin. The RSI is displayed as an oscillator (a line graph essentially) on a scale of zero to 100. When the RSI reaches oversold levels, it can...

Count:192
Name: Ichimoku system
Description: This script is to get backtesting results of ichimoku Cloud system . >> tick buying only to watch backtesting results of buying trades ony other wise untick to see both buy and sell trade results (for intraday timeframe) Tell me if you have any suggestions u i will try to include them in coming updates

Count:192
Name: Everyday 0002 _ MAC 1st Trading Hour Walkover
Description: This is the second strategy for my Everyday project. Like I wrote the last time - my goal is to create a new strategy everyday for the rest of 2016 and post it here on TradingView. I'm a complete beginner so this is my way of learning about coding strategies. I'll give myself between 15 minutes and 2 hours to complete each creation. This is basically a...

Count:192
Name: SuperTrend Long Strategy +TrendFilter
Description: This strategy aims to identify long (buy) opportunities in the market using the SuperTrend indicator. It utilizes the Average True Range (ATR) and a multiplier to determine the dynamic support levels for entering long positions. This presentation will provide an overview of the strategy's components, explain its usage, and highlight that it focuses on long...

Count:192
Name: Combo Backtest 123 Reversal & Relative Momentum Index
Description: This is combo strategies for get a cumulative signal. First strategy This System was created from the Book "How I Tripled My Money In The Futures Market" by Ulf Jensen, Page 183. This is reverse type of strategies. The strategy buys at market, if close price is higher than the previous close during 2 days and the meaning of 9-days Stochastic Slow...

Count:192
Name: 5 Minute EMA Cross Strategy
Description: This simple Fast/Slow EMA cross strategy is designed to be used with Alertatron to place limit orders and use a trailing stop/take profit. Features: Indicators when the fast EMA crosses the slow EMA Trailing Stop/Take Profit Bar look back for placing limit order Macro EMA filter to only trade with the macro trend

Count:192
Name: Donchian Channel Strategy Idea
Description: This strategy idea is a variation of the "Donchian Channel" trading strategy. It is built with a highest-high band, a lowest-low band, and a baseline which is average the highest-high and the lowest-low bands. This strategy is very useful in trending instruments on 1W and 1D timeframes. This is the implementation used in the QuantCT app. You can set the operation...

Count:191
Name: Trade Hour
Description: This script is just finds the best hour to buy and sell hour in a day by checking chart movements in past For example if the red line is on the 0.63 on BTC/USDT chart it mean the start of 12AM hour on a day is the best hour to buy (all based on It's just for 1 hour time-frame but you can test it on other charts. IMPORTANT: You can change time Zone in strategy...

Count:191
Name: Combo Backtest 123 Reversal & Keltner Channel
Description: This is combo strategies for get a cumulative signal. First strategy This System was created from the Book "How I Tripled My Money In The Futures Market" by Ulf Jensen, Page 183. This is reverse type of strategies. The strategy buys at market, if close price is higher than the previous close during 2 days and the meaning of 9-days Stochastic Slow...

Count:191
Name: Combo 2/20 EMA & Bill Williams Averages. 3Lines
Description: This is combo strategies for get a cumulative signal. First strategy This indicator plots 2/20 exponential moving average. For the Mov Avg X 2/20 Indicator, the EMA bar will be painted when the Alert criteria is met. Second strategy This indicator calculates 3 Moving Averages for default values of 13, 8 and 5 days, with displacement 8, 5 and 3 days:...

Count:191
Name: OCC Trend Combo 1 day BTC Moonflag
Description: Runs on BTC 1 DAY (NOTE USE THIS NOT THE PREVIOUS VERSION - DEFAULTS TUNED TO 1 day BTC HERE) USE DEFAULT SETTINGS The strategy is to maximise the profit for OCC longs (ALMA algo) Longs start when the price action settles around the ALMA OCC, then typically breaks up Then follow the trend indcator (blue/orange) Shorts normally happen when the price action...


Count:190
Name: Koala System EURUSD 15min
Description: Today I bring you one of the best systems I have found for 15min chart for EURUSD, can be adapted to other pairs aswell I suppose. Its made of 4 SMA 3 6 9 50 and EMA 200. It only makes 1 trade per day, in this case we have a risk % of our total eqquity, being the min 0.1 lots , can be changed tho . We target TP/SL the same 1:1 rr, in this case I use 30 pips for...

Count:190
Name: Combo Backtest 123 Reversal & Donchian Channel Width
Description: This is combo strategies for get a cumulative signal. First strategy This System was created from the Book "How I Tripled My Money In The Futures Market" by Ulf Jensen, Page 183. This is reverse type of strategies. The strategy buys at market, if close price is higher than the previous close during 2 days and the meaning of 9-days Stochastic Slow...

Count:190
Name: RSI Centered Pivots
Description: Just a simple RSI central pivot strategy I made for a friend. Backtested on BYBIT:BTCUSD, 155m. DISCLAIMER : Please do your own research into anything you use before using it to trade.

Count:190
Name: MA cross strategy Vts
Description: The simple Moving average cross strategy is here implemented. I guess there are multitudes of similar scripts around. I post this one since I was asked by some friends, and I'll let it free to use for anybody. Here you can choose the year where to start backtesting, the source, the type of MA, the SL and TP multiplicators of ATR, for which you can also choose the...

Count:190
Name: Klinger Volume Oscillator (KVO) Backtest
Description: The Klinger Oscillator (KO) was developed by Stephen J. Klinger. Learning from prior research on volume by such well-known technicians as Joseph Granville, Larry Williams, and Marc Chaikin, Mr. Klinger set out to develop a volume-based indicator to help in both short- and long-term analysis. The KO was developed with two seemingly opposite goals in mind:...

Count:189
Name: [TH] Volatility Breakout
Description: Volatility Breakout Strategy for TradingHook. This strategy is not for backtesting but for forward-testing starting when added to chart. It can make and send a formatted message string for buy and sell order using alert.

Count:189
Name: Chandelier Exit ZLSMA Strategy
Description: Introducing a Powerful Trading Indicator: Chandelier Exit with ZLSMA If you're a trader, you know the importance of having the right tools and indicators to make informed decisions. That's why we're excited to introduce a powerful new trading indicator that combines the Chandelier Exit and ZLSMA: two widely-used and effective indicators for technical...

Count:189
Name: Voss Strategy (Filter + Trend Indicator) [Bitduke]
Description: Created strategy based on Voss Predictive Filter, implemented by TradingView user e2e4mfck. Voss Predictive Filter This is a relatively new filter from John F. Ehlers’ article, “A Peek Into The Future .” Ehlers describes the calculation of a new filter that could help signal cyclical turning points in markets. But filter has a negative group delay and...

Count:189
Name: Noro's Ichimoku Strategy v1.0
Description: Uses: 1) Ichomoku 2) Body filter 3) Color filter

Count:188
Name: Stealthy7 Bayes Conditional RSI Trader Strategy
Description: What does it do? This script checks whether RSI movement affects future price. Trades when probability increases or decreases. Developed for daily(D) bars and Bitcoin. This script is just a toy and for educational use. Please rent my bots at cryptotrader.org/?r=51

Count:188
Name: Arnaud Legoux Moving Average Cross (ALMA)
Description: This strategy uses two different Arnaud Legoux Moving Average Lengths, one fast and one slow, to determine crosses for entries. The Arnaud Legoux Moving Average is an improvement to traditional MA's because it reduces lag and smooths the signal line. I have added a volume filter to improve the accuracy of the signals. This script is optimized to be used with...

Count:188
Name: Fukuiz Octa-EMA + Ichimoku (Strategy)
Description: This strategy is based EMA of 8 different period and Ichimoku Cloud which works better in 1hr 4hr and daily time frame. #A brief introduction to Ichimoku # The Ichimoku Cloud is a collection of technical indicators that show support and resistance levels, as well as momentum and trend direction. It does this by taking multiple averages and plotting them on a...

Count:188
Name: 5MSM VISHNU
Description: 5MSM VISHNU Indicator for Trending Markets originally written by patrick1994. It was originally based on the MACD 12-26 and the 50 bar EMA . The macd hist is color coded with green as buy and sell as red. I added an option to use a couple of lower lag ema's (See line 13 - ema_signal). 5MSM VISHNU with MACD Indicator for Trending Markets Originally written by...

Count:188
Name: M0PB (Momentum Pullback)
Description: Long/short strategy that identifies extreme readings on the rsi as a *momentum signal*, unlike most RSI strategies the script will look to buy or sell the first pullback in the direction of the extreme RSI reading. Enters positions on the first pullback to the 5ema(low)/ 5ema(high) and exits at rolling 12 bar high/ low. The rolling high/ low feature means that if...

Count:187
Name: Combo Backtest 123 Reversal & Qstick Indicator
Description: This is combo strategies for get a cumulative signal. First strategy This System was created from the Book "How I Tripled My Money In The Futures Market" by Ulf Jensen, Page 183. This is reverse type of strategies. The strategy buys at market, if close price is higher than the previous close during 2 days and the meaning of 9-days Stochastic Slow...

Count:187
Name: D_ELI (Ehlers Leading Indicator) Strategy Backtest
Description: This Indicator plots a single Daily DSP (Detrended Synthetic Price) and a Daily ELI (Ehlers Leading Indicator) using intraday data. Detrended Synthetic Price is a function that is in phase with the dominant cycle of real price data. This one is computed by subtracting a 3 pole Butterworth filter from a 2 Pole Butterworth filter. Ehlers Leading Indicator...

Count:187
Name: Noro's HullMA Strategy
Description: A Hull Moving Average strategy. I simply copied the code from mohamed982 and wrapped it in strategy code. All credits go to him not me.

Count:187
Name: Rainbow Strategy Backtesting
Description: Rainbow Strategy Backtesting base on "Rainbow Moving Average" Strategy as below: 1.Rainbow Moving Average setup - Source: source of 1st MA - Type: SMA/EMA - Period: period of 1st MA - Displacement: period of 2nd MA to 7th MA with source is previous MA 2.Trend Define - Up Trend: Main MA moving at the top of Rainbow - Down Trend: Main MA moving at the bottom of...

Count:187
Name: Combo Backtest 123 Reversal & Floor Pivot Points
Description: This is combo strategies for get a cumulative signal. First strategy This System was created from the Book "How I Tripled My Money In The Futures Market" by Ulf Jensen, Page 183. This is reverse type of strategies. The strategy buys at market, if close price is higher than the previous close during 2 days and the meaning of 9-days Stochastic Slow...

Count:187
Name: My Ichimoku indicator & Strategy
Description: hello I'm a beginner in trading, but I try to learn how to code strategies. I recoded the Ichimoku indicator, and created my personnal strategy based on it. The backtesting is done from 1/1/2017 to today in 45 min Time Unit for candles, with a 1 000 € equity. The trades are all Long Entries and Exits with no pyramiding, no short trades at all. /!\ Exchanges...

Count:187
Name: [LunaOwl] 樂活投資:價格通道 (LOHAS Investor - PriceChannel)
Description: - Introduction - Price channel is an ancient strategy, which is very convenient for office workers. since most people no time do it. so they are suitable for simple strategies. There are several conditions to become a "LOHAS Investor" - 價格通道是很老的投資策略,對於肯做功課的上班族來說非常方便,而且多數人沒時間操作。 如果要當「樂活投資人」有幾點條件: 1) set moderate ROI expectations. - 設定溫和的投資報酬率期望。 2) use...

Count:187
Name: Strategy - Bobo PAPATR
Description: Hi I've revamped this bot mentioned in the linked idea to make it work with v4 of pine. In doing so there are some very significant changes to how it works. The main one is that it no longer uses traditional daily pivot calculations to calculate the bands. It creates a more dynamic intraday set of pivot points based on recent price action rather than yesterday's...

Count:187
Name: TurtleBC Strategy
Description: An attempt to clone turtlebc.com strategy. I started from ossetia code and modified it to consider daily close instead of highest value.

Count:187
Name: NIFTY 50 5mint Strategy
Description: This is an intraday strategy for NIFTY50 Based First candle High and Low breakout. The strategy takes user inputs for the start and end dates, start and end months, and start and end years, which define the time range to trade. The user can also specify the maximum number of trades to take during the time range and the length of the Exponential Moving Average (...

Count:187
Name: 3 x EMA + Stochastic RSI + ATR
Description: 8,20,40 EMAs + RSI crossover. Stop Loss at ATR x3. Profit Target at ATRx2

Count:187
Name: TrapTrading
Description: Buy on dips and sell into rallies. Simple as that. - Short line (green) - Base line (white) - Long line (red) When the market price touches the white or the red(green) lines, buy(sell) orders are generated. The exit points are 2 lines above(below) the entries. Parameters - Period: It affects the value of Base line and the spacing of each line. - Multiple:...

Count:186
Name: ISM Indicator As a Strategy
Description: Here's a very easy code, plotting the ISM against the SPX. In this exercise, i wanted to see if one could use the ISM indicator only to generate buy/sell signal, and what would be the performance. What is the ISM The ISM Manufacturing Index monitors employment, production inventories, new orders and supplier deliveries.By monitoring the ISM Manufacturing...

Count:186
Name: Chanu Delta Strategy
Description: This strategy is built on the Chanu Delta Indicator, which indicates the strength of the Bitcoin market. When the Chanu Delta Indicator hits “Delta_bull” and “Delta_bear” and closes the candle, long and short signals are triggered respectively. The example shown on the screen is a default setting optimized for a 4-hour candlestick strategy based on the Bybit...

Count:186
Name: Normalized MACD (v420) strategy
Description: Normalized MACD but heavily modified for example hullMA instead of EMA the strategy

Count:186
Name: Double Bollinger Strategy
Description: From "Bitcoin Trading Strategies: Algorithmic Trading Strategies For Bitcoin And Cryptocurrency That Work" by David Hanson. *Works better with 1hr time frame and some input optimisations. "Double Bollinger Band Scalping System Recommended Timeframe: 1 minute or 5 minute * Required Indicators: // - RSI with a length of 14 (default settings) // - Bollinger...

Count:186
Name: Combo 2/20 EMA & Adaptive Price Zone
Description: This is combo strategies for get a cumulative signal. First strategy This indicator plots 2/20 exponential moving average. For the Mov Avg X 2/20 Indicator, the EMA bar will be painted when the Alert criteria is met. Second strategy The adaptive price zone (APZ) is a volatility-based technical indicator that helps investors identify possible market...

Count:186
Name: Generation 6 Massive Trend Following for Gold (Note at bottom!)
Description: Making this one an open script for you people. Commission_value = 0.02 is the same as a 50 pip gold spread. Start capital $10,000. 1.00 lots = 1 contract on this. Trend establishment with the 600 period moving average, trend continuation with the crossover/crossunder. This strategy is great for finding trends on XAUUSD. Side note: if anyone knows MQL4...

Count:185
Name: SW SVE - Stochastic+Vol+EMAs [Sergio Waldoke]
Description: Script created by Sergio Waldoke (BETA VERSION v0.5, fine tuning PENDING) Stochastic process is the main source of signals, reinforced on buying by Volume. Also by Golden Cross. Selling is determined by K and D entering overselling zone or EMA's Death Cross signal, the first occurring, and some other signals combined. Buy Long when you see a long buy arrow. Sell...


Count:185
Name: Strategy Myth-Busting #13 - MultiEMA+BXTrender - [SP/MYN]
Description: #13 on the Myth-Busting bench, we are automating the "I Found The Highest Win Rate 15 Minute Scalping Trading Strategy Ever" strategy from "TradeIQ" who claims to have backtested this manually and achieved 410% profit over 100 trades within 6 months on Natural Gas with 79 Wins / 21 Losses with an astounding 3.96% Max Drawdown. It was quite challenging emulating...

Count:185
Name: Ultimate Oscillator [Long] Strategy
Description: After I published Short Selling strategy with RSIofUO , I have been working for Long side strategy with same indicator. but for Long strategy , I have used only the Ultimate Oscillator ... (Not the RSI of UO) Logic behind this is , when UO goes below oversold level , high chance of possible reversal from there ... Ultimate Oscialltor values , I have used are...

Count:185
Name: 1-2-3 Reversal Backtest Strategy
Description: This is backtesting script. This System was created from the Book "How I Tripled My Money In The Futures Market" by Ulf Jensen, Page 183. This is reverse type of strategies. The strategy buys at market, if close price is higher than the previous close during 2 days and the meaning of 9-days Stochastic Slow Oscillator is lower than 50. The strategy sells at...

Count:185
Name: EMAMA strategy
Description: EMAMA strategy courtesy of LazyBea'rs original code and John Ehler's theories.

Count:185
Name: Noro's ShiftMA+TP+SL Strategy
Description: This strategy is worse than my strategy of ShiftMA. It is not recommended to use. Take-profit and stop-loss is added. The black line - the price for opening of a long position (limit order) The lime line - the price for take-profit (limit order) The red line - the price for stop-loss (stop order)

Count:184
Name: Consolidation Breakout [Indian Market Timing]
Description: OK let's get started , A Day Trading (Intraday) Consolidation Breakout Indication Strategy that explains time condition for Indian Markets . The commission is also included in the strategy . The basic idea is , 1) Price crosses above upper band , indicated by a color change (green) is the Long condition . 2) Price crosses below lower band , indicated by a color...

Count:184
Name: Poloniex 30 EMA & 50 SMA Strategy
Description: Working great on higher timeframes! Best is to check performance for certain timeframe and then trade on the signals, so far 4H-24H range works best. 9H had best performance on MAIDBTC, but seems lower Timeframes doing well too on BTCUSD. Just check under performance and try it out! :)

Count:184
Name: AVG Stochastic Strategy [M30 Backtesting]
Description: 1. AVG Stochastic Calculate 1.1 AVG %K is calculated by apply EMA with smooth K period on Average of Original Stochastic %k & %d + avg_k=ema((%k+%d)/2,smoothK) 1.2 AVG %D is calculated by apply EMA with %d period on AVG %K + avg_d=ema(avg_k,periodD) 2. Parameter + %K Length: 21 + %K Smoothing: 3 + %D Smoothing: 3 + Symbol: BTC/USDT + Timeframe: M30 + Pyramiding:...

Count:184
Name: Zignaly Tutorial
Description: This strategy serves as a beginner's guide to connect TradingView signals to Zignaly Crypto Trading Platform. It was originally tested at BTCUSDT pair and 1D timeframe. Before using this documentation it's recommended that you: Use default TradingView strategy script or another script and setup its associated alert manually. Just make the alert pop-up in the...

Count:184
Name: Renko Plot Strategy
Description: This strategy lets you plot Renko open and close values, based on your preferred Renko size brick, on normal candle chart. You can use it on any timeframe, define your preferred brick size and trailing stop.

Count:183
Name: High/low crypto strategy with MACD/PSAR/ATR/EWave
Description: Today I am glad to bring you another great creation of mine, this time suited for crypto markets. MARKET Its a high and low strategy, designed for crypto markets( btcusd , btcusdt and so on), and suited for for higher time charts : like 1hour, 4hours, 1 day and so on. Preferably to use 1h time charts. COMPONENTS Higher high and lower low between different...

Count:183
Name: VWAP-Bollinger Bands
Description: This script uses Bollinger bands but with a VWAP as the source, it uses the high crossing the upper band as a buy signal and a low crossing the lower band as a sell signal Its default settings are for a day chart - Crypto 30 periods, forex 24 periods and stocks 20 periods, which basically line up with a month per asset class ive seen good results in crypto and...

Count:183
Name: CandleCounter - Amazingly simple strategy
Description: This might sound like a crazy idea, but actually seems to work, on all time scales nonetheless!

Count:183
Name: MAMA (Ehlers) MESA Adaptive Moving Average
Description: MAMA ( Ehlers ) MESA Adaptive Moving Average: What it is and how it works MESA Phasor is the most advanced futures trading program on the market! MESA Phasor derives its name from the sinewave generator you probably recall from your high school trigonometry class. As you can see in the diagram, the rotating phasor generates a sine wave in the time domain,...

Count:183
Name: Three Line Break Backtest
Description: This is a modified version of the three line break price representation. It is composed with 2 lines made of Close price values forming a “cloud”. If the trend is bullish and the price breach the lower level of the green cloud, a new bearish trend is taking place. If the current trend is bearish and the price breakout the upper band of ...

Count:183
Name: VXMA Bot
Description: This strategy is separated version of Cloud MA form VXD Cloud Edition, Let called it "VXMA". what's changed? renew TP/SL Work Simplify code and clean look. Risk:Reward Calculation Risk of Ruin Setting can now selected between Fixed $ or % if Buy your Stoploss will be Swing low if Sell your Stoploss will be Swing high and can be setting at Pivot...

Count:183
Name: Strategy Test - Cancel Limit Order and Position Sizing
Description: While working thru another project had the need to troubleshoot the canceling of a limit order syntax/process as well as work thru the code and logic to automagically set the position sizing based off two user inputs (Amount to Risk in USD and Leverage to Use) and the potential entry and stop levels for an inside bar candle pattern in this scenario. Once we find...

Count:183
Name: Parabolic SAR Swing strategy GBP JPY Daily timeframe
Description: Today I bring you a new strategy thats made of parabolic sar. It has optmized values for GBPJPY Daily timeframe chart. It also has a time period selection, in order to see how it behave between selected years. The strategy behind it is simple : We have an uptrend , (the psar is below our candles) we go long. We exit when our candle crosses the psar value. The...

Count:183
Name: Strategy Myth-Busting #9 - HullSuite+LSMA - [MYN]
Description: This is part of a new series we are calling "Strategy Myth-Busting" where we take open public manual trading strategies and automate them. The goal is to not only validate the authenticity of the claims but to provide an automated version for traders who wish to trade autonomously. Our 9th one is an automated version of the "I Tested The Best 1 Minute Scalping...

Count:182
Name: Noro's ZigTrend Strategy v1.0
Description: Trend reverse trade strategy. The indicator a zigzag is used. If the candle is closed above than the line of a zigzag - to open a long position. If the candle is closed below than the line of a zigzag - to open a short position.

Count:182
Name: Up Down Strategy with MA Control
Description: a simple up down candle strategy with a built in MA control alerts script:

Count:182
Name: [Autoview][BackTest] Blank R0.13B
Description: This is a fork of JustUncleL's Dual MA Ribbons R0.13 It is now a blank template for making new strategies / alerts for autoview The changes are as follows: Removed actual algo Establish functions for long Signal, long Close Signal and short Signal, short Close Signal to minimize the places code must be edited to update / replace algos Make allow Long and...

Count:182
Name: Rob Booker Reversal Tabs Strategy
Description: Rob Booker Reversal Tabs Strategy is an updated version of Rob Bookers Reversal Tab study: Rob Booker Reversal Tabs While the original is a Pinescript study, this version can be switched between strategy and indicator mode. Rob Bookers script generates reversal signal based on MACD and Stochastics, it is not a true reversal system, default pyramiding value is...

Count:182
Name: LAGging span leaves Bollinger Bands strategy
Description: Abstract This script points out the positions a lagging span leaves a Bollinger Band. This script does not plot a lagging span but moves the Bollinger Band forward. You can find profit opportunities by combining this script and risk management. Introduction Bollinger Bands is a popular indicator. It contains a moving average, an upper band and a lower band. The...

Count:182
Name: Combo Backtest 123 Reversal & Recursive Moving Trend Average
Description: This is combo strategies for get a cumulative signal. First strategy This System was created from the Book "How I Tripled My Money In The Futures Market" by Ulf Jensen, Page 183. This is reverse type of strategies. The strategy buys at market, if close price is higher than the previous close during 2 days and the meaning of 9-days Stochastic Slow...

Count:182
Name: [KL] RSI 14 + 10 Strategy
Description: This strategy uses RSI14 for entry and exit signals; applies RSI10 for confirmation. The thresholds can adjusted in Settings. Trailing stop can also be applied if wanted. Tested on daily/hourly charts.

Count:182
Name: HMA & D1 crossover
Description: Can work on Forex if change equity currency and SL and TP etc This example tuned for ETH/BTC Enters on HMA (Hull Moving Average) and D1 (Daily Candle) crossovers, Exits basket when profit = TP (Target Profit) Has Commission and slippage added, test equity at 1 BTC lotsize set too 1% of equity for each order

Count:182
Name: BBPBΔ(OBV-PVT)BB - Time Series Decomposition & Volume Weighted
Description: This is an indicator that shows 5 different points of information: #1 The Trendline is uses a time-series decomposition to remove noise and seasonality data to provide a trendline without using moving averages. This is then further processed by a custom VWAP block that weights it based on the time frame you're currently using. #2 BB%B - This is the blue histogram...

Count:182
Name: MrBS:Directional Movement Index [Trend Friend Strategy]
Description: This goes with my MrBS:DMI+ indicator. I originally combined them into one, but then you cannot set alerts based on what the ADX and DMI is doing, only strategy alerts, so separate ones have more flexibility and uses. Indicator Version is found under "MrBS:Directional Movement Index " () //// THE IDEA The majority of profits made in the market come from...

Count:182
Name: Noro's DDL Strategy
Description: The lime area is a downward shift in price. The red area is a price shift up. Yellow background - signal for opening position. If the lime range is less than the long parameter, open the long position. If the candle is green, close the long position. If the red range is more than a short parameter, open a short position. If the candle is red, close the short position.

Count:182
Name: Rsi, Ema , Ma and Bollinger Bands for 1 min Btcusdt
Description: This is for 1 min Btcusdt pair. I am tring to find a way to catch %1 ups and downs. Basicly it buys when rsi low and minute candle closes under ema,ma and lower bollinger band, it sells when candle goes over upper bb,low ma, when rsi high. It sells when rsi high ,candle closes over upper bb,over low ma and does the opposite when buying. I know it's crowded but...

Count:181
Name: MACD_Long_Only
Description: I created this indicator to calculate the gains that can be made purely by going long on the market. For exchanges without the ability to short, the standard MACD strategy is unable to accurately calculate the profit/loss from entering and exiting a position, as it includes profit/loss from actively shorting the market, which may either not be possible, or be...

Count:181
Name: Glory Hole with SMA + ADX - Strategy
Description: Here you get a script with the rules for "Glory Hole"-Strategy from Linda Raschke. In Addition, I choose the SMA - not the EMA for this script. MY RECOMMONDATION: If you get a trade Signal, then set an sell- oder buy-order on the high or low. If the next bar doesn't touch into the trade, then delete your order. Have fun and good look.

Count:181
Name: Simple Moving Average + ADX + DMI + Time Range Test
Description: Use long and short moving average to look for a potential price in/out. (default as 14 and 7, bases on the history experience) ADX and DMI to prevent the small volatility and tangling MA. This script allows you to set the beginning & end time to test the bullish & bearish market. If you want an indicator version, here is it. Thanks.

Count:181
Name: Combo Backtest 123 Reversal & Dynamic Pivot Point
Description: This is combo strategies for get a cumulative signal. First strategy This System was created from the Book "How I Tripled My Money In The Futures Market" by Ulf Jensen, Page 183. This is reverse type of strategies. The strategy buys at market, if close price is higher than the previous close during 2 days and the meaning of 9-days Stochastic Slow...

Count:180
Name: Internal Bar Strength Indicator | Reversion system
Description: This strategy buy at the next open when close = low . Then it closes the position after either a small profits OR a (very) small losses. Works with several TF

Count:180
Name: Heiken Ashi & Super Trend
Description: This is one of my open source 1h strategies It works on Binance: BTCUSDTPERP charts This strategy involves two indicators 1. Heiken Ashi - a typical technical indicator to help highlight and clarify the current trend. This somehow allows the chart to ignore unnecessary fluctuations and make the trend more visible. 2.Super Trend - - One of the most common...

Count:180
Name: Combo Backtest 123 Reversal & Relative Volatility Index
Description: This is combo strategies for get a cumulative signal. First strategy This System was created from the Book "How I Tripled My Money In The Futures Market" by Ulf Jensen, Page 183. This is reverse type of strategies. The strategy buys at market, if close price is higher than the previous close during 2 days and the meaning of 9-days Stochastic Slow...

Count:180
Name: Improved Bollinger Swing Strategy Stock Nasdaq
Description: This is an improved bollinger band strategy adapted to Nasdaq Index/Stocks. The new update include a multiple logic calculation BB adapted for long and short, together with a risk management using movement in %. Rules for entry For long we have a crossover between the close and the lower band from the bb For long we have a crossover between the close and the...

Count:180
Name: MACD 50x Leveraged Long Strategy Results with Real Equity
Description: Hello there. I was looking for a way to simulate leveraged transactions in Tradingview and this script came out. You can examine the equity graph without looking at the strategy results. Thus, the facts will come to light. Strategy parameters: Adding margin: Forbidden or not specified. (Add Margin : No) Position size: (for each trade) 1% Stop-Loss:...

Count:180
Name: Bollinger band & Volume based strategy V2
Description: this script is upgraded version of previous one the major change is deleted script which find a highest price after entry the last of strategy is same. If current volume is above daily average volume, and three bollinger band`s Standard Deviation, 1 and 1.5 and 2 if the current lowest price is bigger then 1 stdev and current closed is bigger then 1.5 stdev and the...

Count:180
Name: BreakingDawn [JackTz]
Description: Designed for 4 hour charts - No repaint. BreakingDawn tries to anticipate the trend change before the actual break from one trend to another. This is an extenstion to WaveTrend from LazyBear. Cudos to LazyBear for his awesome WaveTrend script! //Jack

Count:179
Name: Combo Backtest 123 Reversal & 2/20 Exponential MA
Description: This is combo strategies for get a cumulative signal. First strategy This System was created from the Book "How I Tripled My Money In The Futures Market" by Ulf Jensen, Page 183. This is reverse type of strategies. The strategy buys at market, if close price is higher than the previous close during 2 days and the meaning of 9-days Stochastic Slow...

Count:179
Name: Volume Weighted Bollinger Bands Strategy
Description: Simple strategy, Using Volume weighted Bollinger Bands > Directions for Usage: 1. Use only in scripts where volume is specified by tradingview 2. Check on which timeframe the script has a profit factor greater than 1.4 3. Use that timeframe for profitability 4. In some high liquid securities there is a decent profit factor even at 5 min scale (optimise at...

Count:179
Name: Vegas Wave Strategy
Description: A quickly put together strat for the Vegas Wave. Buy and sell currently wait until the crossover or twist of the 233 and 144 EMAs and price action below the wave. This can be probably be fixed to sell faster but I'm feeling lazy.

Count:179
Name: Ichimoku Cloud with MACD (By Coinrule)
Description: The Ichimoku Cloud is a collection of technical indicators that show support and resistance levels, as well as momentum and trend direction. It does this by taking multiple averages and plotting them on a chart. It also uses these figures to compute a “cloud” that attempts to forecast where the price may find support or resistance in the future. The Ichimoku...

Count:179
Name: RWI Strategy
Description: A test of the RWI used purely for long/short signals proves surprisingly profitable on 3H and 4H XBTUSD and ETHUSD.

Count:179
Name: Forex scalper 2xEMA + SRSI + MACD
Description: This is a forex scalping strategy designed for the most liquid pairs, like major forex pairs. Its made of 1 EMA 50 1 EMA 100 Stochastic RSI MACD Rules For long :close of the candle is above moving average 50, moving average 50> moving average 100, macd histogram is positive and cross over of stochastic rsi with the oversold level. For short :close of the...

Count:179
Name: Simple MACD Strategy - Crossover
Description: Simple MACD Crossover Strategy No secret sauce here! Script was requested by user

Count:178
Name: PickingupFromBottom Strategy
Description: PickingupFromBottom Strategy is variation of my earlier strategy HiLoBand This strategy uses lowest lows of 200 and ema of that with length 7. Lets call this ema200Lows line wait for price to close below ema200Lows line Then using camarilla pivot points , wait for camariall centerpoint (actally ema 9 of that ) crossing up the ema200Lows line. When...

Count:178
Name: Millebot
Description: Hello Traders, Here you find a simplified version of the Millebot strategy. This strategy can be used as a complete system with integrated risk management. The strategy also uses a fixed stoploss and take-profit, in contrast to the full version of the Millebot, which applies a variabele SL, TP an trailing TP derived from the assets volatility. The Millebot is a...

Count:178
Name: Kaufman's Efficiency Ratio Strategy [KL]
Description: I recently published an indicator called "Kaufman's Efficiency Ratio Indicator". In the description of that script, I hypothesized about how the Efficiency Ratio could be applied to identify bullish moves in instances where price had already gone up steeply, but rests for a while, allowing for entry in expectation that price will continually rise. I decided to...

Count:178
Name: Big Snapper Alerts R3.0 + Chaiking Volatility condition + TP RSI
Description: //@version=5 // // Bannos // #NotTradingAdvice #DYOR // Disclaimer. // I AM NOT A FINANCIAL ADVISOR. // THESE IDEAS ARE NOT ADVICE AND ARE FOR EDUCATION PURPOSES ONLY. // ALWAYS DO YOUR OWN RESEARCH // // Author: Adaptation from JustUncleL Big Snapper by Bannos // Date: May-2022 // Version: R1.0 //Description of this addon - Script using several new...

Count:178
Name: Noro's TrendMaster Strategy v1.0
Description: Uses: 1) PriceChannel 2) RSI (period = 2) 3) Body-filter

Count:178
Name: ST_greed_spot_example
Description: A simple grid long strategy. The first entry into the transaction is carried out according to the "double bottom" pattern, then when the average entry price decreases by a certain percentage, the position is completed. Dobor is always carried out for the same amount of funds. Take profit with an increase in the average entry price for a given volume

Count:178
Name: Bollinger Band Breakout Positional Strategy- BN -15M
Description: This strategy consists of following criteria: Buy: 1. Candle should have RSI is above 60 and Close above Bollinger band upper limit 2. Exit When candle is closed below 20MA Sell: 1. Candle should have RSI is above 40 and Close below Bollinger band lower limit 2. Exit When candle is closed above 20MA Checkout results.

Count:178
Name: Elder Ray (Bull Power) Strategy Backtest
Description: Developed by Dr Alexander Elder, the Elder-ray indicator measures buying and selling pressure in the market. The Elder-ray is often used as part of the Triple Screen trading system but may also be used on its own. Dr Elder uses a 13-day exponential moving average (EMA) to indicate the market consensus of value. Bull Power measures the ability of buyers to...

Count:177
Name: Swing Stock Market Multi MA Correlation
Description: This is a swing strategy adapted to stock market using correlation with either SP500 or Nasdaq, so its best to trade stocks from this region. Its components are Correlation Candle Fast moving average to choose from SMA , EMA , SMMA (RMA), WMA and VWMA Medium moving Average to choose from SMA , EMA , SMMA (RMA), WMA and VWMA Slow moving average to choose from SMA...

Count:177
Name: Grospector DCA V.3
Description: This is system for DCA with strategy. This has 5 zone Extreme high , high , normal , low , Extreme low. You can dynamic set min - max percent every zone. Extreme zone is derivative short and long which It change Extreme zone to Normal zone all position will be closed. Every Zone is splitted 10 channel. and this strategy calculate contribution. and now can predict...

Count:177
Name: [VJ] Viper VWAP Intraday
Description: Hello Traders, this is a simple intraday strategy involving the ever reliable VWAP and a chop index to add twist to the traditional style . You can modify the values on the stock and see what are your best picks. Comment below if you found something with good returns Strategy: VWAP based strategy but uses an additional powerful indicator Chop index to help us...

Count:177
Name: SB_CCI coded OBV Strategy
Description: Strategy- Buy Order: Previous obv value is green and obv_cci coded line crosses over ema line Sell Order: Previous obv value is red and obv_cci coded line crosses under ema line. Original Idea: Preferable for day/week intervals. For Tips to continue :) - BTC: 1BjswGcRR6c23pka7qh5t5k56j46cuyyy2 ETH: 0x64fed71c9d6c931639c7ba4671aeb6b05e6b3781 LTC:...

Count:177
Name: RSI Strategy Professional Хомячело
Description: Хз чим відрізняється. Його лекго використовувати, треба підшаманити пару параметрів і все. Використовую для ринку крипти і норм трейдиться. Індикатор дає сигнал і я зразу залітаю на всю котлєту куди він каже.

Count:176
Name: MA Divergences Strategy
Description: This is the Strategy version of the Study I published. It is a Moving Average that can be applied to any plot to plot divergences on any oscillator, as well as perform backtesting. You'll need a REALLY good oscillator to perform live trades using this alone, but I think it is a valuable tool and had the Strategy hanging around and for some reason didn't upload it...

Count:176
Name: FSCG-TSSL
Description: A modification of dasanc's "Fisher Stochastic Center of Gravity" Added: - Thresholds for Buy/Sell Signals - Trailing Stop / Stop Loss - Backtest Range Support the open-source community. Screw you people selling open-source scripts to newbies. Tip Jar: 3KNZq8mE24MuBmpDJVF31bBy8zc9beDiZo Contact me for collaborations and let's take things to the next...

Count:176
Name: Positive Volume Index Backtest
Description: The theory behind the indexes is as follows: On days of increasing volume, you can expect prices to increase, and on days of decreasing volume, you can expect prices to decrease. This goes with the idea of the market being in-gear and out-of-gear. Both PVI and NVI work in similar fashions: Both are a running cumulative of values, which means you either...

Count:176
Name: ETF / Stocks / Crypto - DCA Strategy v1
Description: Simple "benchmark" strategy for ETFs, Stocks and Crypto! Super-easy to implement for beginners, a DCA (dollar-cost-averaging) strategy means that you buy a fixed amount of an ETF / Stock / Crypto every several months. For instance, to DCA the S&P 500 (SPY), you could purchase $10,000 USD every 12 months, irrespective of the market price. Assuming the...

Count:176
Name: Volume and Moving average,will this model working in real-trade?
Description: i`ve recently made this script through few month,understand me if there are some incorrect grammar or something. basically this script is based on moving average strategy and the bollinger bands if the buy volume is bigger than sell volume,also buy volume is bigger then daily average volume than it`s defined current market is bullish and entered(of course there is...

Count:175
Name: Noro's Trend MAs Strategy v1.6
Description: Trade strategy which uses only 2 MA. The slow MA (blue) is used for definition of a trend The fast MA (red) is used for an entrance to the transaction For: - For H1 - For crypto/fiat Recomended: Long = true (if it is profitable as a result of backtests) Short = true (if it is profitable as a result of backtests) Type of slow MA = 7 (only for...

Count:175
Name: ROC_PA_Strategy (A3Sh)
Description: Hi there, An experiment with rate of price change in combination with price averaging. The strategy is inspired by Price Change Scalping Strategy developed by Prosum Solutions and Scalping Dips On Trend Strategy developed by Coinrule. Both strategies look at the percentage of price change to open orders. When the price drops beyond a specified percentage, a...


Count:175
Name: Breakout Range Short Strategy Backtest
Description: Breakout Range Short Strategy You can change long to short in the Input Settings Please, use it only for learning or paper trading. Do not for real trading.

Count:175
Name: Noro's Price Channel Strategy v1.1
Description: The blue line is the middle of the price channel . If to use color strategy If there are 2 red candles in a row and a body of the last candle more than a half of an average body of a candle and a candle was closed over the line - to open long-position If there are 2 green candles in a row and a body of the last candle more than a half of an average body of a...

Count:175
Name: Inverse MACD + DMI Scalping with Volatility Stop (By Coinrule)
Description: This script is focused on shorting during downtrends and utilises two strength based indicators to provide confluence that the start of a short-term downtrend has occurred - catching the opportunity as soon as possible. This script can work well on coins you are planning to hodl for long-term and works especially well whilst using an automated bot that can...

Count:175
Name: Bearish Engulfing Backtest
Description: This is a bearish candlestick reversal pattern formed by two candlesticks. Following an uptrend, the first candlestick is a up candlestick which is followed by a down candlestick which has a long real body that engulfs or contains the real body of the prior bar. The Engulfing pattern is the reverse of the Harami pattern. WARNING: - For...

Count:174
Name: [STRATEGY][RS]DemaRSI V0
Description: EXPERIMENTAL: Double EMA RSI Strategy. Optional: N max orders per day, %equity trade size, Time session constraints, TP, SL, Trailing.

Count:174
Name: Volatility System
Description: Despite its crude name, the volatility system strategy, described by Richard Bookstaber in 1984, follows the simple premise that once there is a big volatile movement, the market tends to follow it. Thus, it uses the ATR to measure the volatility, and issues orders when the current change of the closing price exceeds the threshold, calculated by the ATR times a...

Count:174
Name: APEX - Tester - Buy/Sell Strategies - Basic - BACKTESTER
Description: This is a upgraded version of the following study. This is a simple Strategy for backtesting your APEX trading ideas. Be aware that the results will not be exact same as with apex bot.

Count:173
Name: Noro's Brakeout Strategy v2.0
Description: For: - only for H4! - crypto/fiat - crypto/crypto

Count:173
Name: Full Candle Outside BB [Bishnu103]
Description: Bollinger band defines volatility range based on the current market condition. If a full candle is created outside BB then it is highly volatile and it may reverse to the mean, i.e. middle BB. Buy - when a green candle is created below lower BB (alert candle) and price goes above high of it. Buy SL - low of alert candle Target 1 - middle band Target 2- upper...

Count:173
Name: Active trader turtles strategy modified
Description: Enter when price break 55 days high and exit when price break 20 days low

Count:173
Name: Volatility Stop Strategy (by Coinrule)
Description: Traders often use the volatility stop to protect trades dynamically, adjusting the stop price gradually based on the asset's volatility. Just like the volatility stop is a great way to capture trend reversals on the downside, the opposite applies as well. Therefore, another useful application of the volatility stop is to add it to a trading system to signal...

Count:172
Name: Fast EMA above Slow EMA with MACD (by Coinrule)
Description: An exponential moving average ( EMA ) is a type of moving average (MA) that places a greater weight and significance on the most recent data points. The exponential moving average is also referred to as the exponentially weighted moving average . An exponentially weighted moving average reacts more significantly to recent price changes than a simple moving average...

Count:172
Name: RSI OverTrend Strategy (by Marcoweb) v1.0
Description: Hi guys, just adapted the CCI Level zero Strategy with the Over Bought and Over Sold levels provided by the Relative Strength Index. The strat is opening a long position at RSI Oversold 30 Level closing it at RSI Overbought 70 Level flipping the position. Enjoy :D

Count:172
Name: Lancelot RR Strategy
Description: Dear all, Free strategy again. This strategy consists of 2 indicators I think works well with each other as a trend following strategy. The 2 indicators are Renko chart and Relative Vigor Index. This is a long-only breakout strategy that aims to capture the majority of the trend. Works well on BTCUSD XBTUSD, as well as other major liquid Pair. Please...

Count:172
Name: Slow Stochastic OB/OS Strategy
Description: Same concept as my Slow RSI strategy script But in Stoch format I'm finding that i like Slow Stoch better than Slow RSi This chart also includes exit guards. It's up to you to decide if you want to pyramid or not. This chart is set at pyramid = 3

Count:172
Name: Combo Backtest 123 Reversal & D_ELI (Ehlers Leading Indicator)
Description: This is combo strategies for get a cumulative signal. First strategy This System was created from the Book "How I Tripled My Money In The Futures Market" by Ulf Jensen, Page 183. This is reverse type of strategies. The strategy buys at market, if close price is higher than the previous close during 2 days and the meaning of 9-days Stochastic Slow...

Count:172
Name: MA-EMA Crossover LT
Description: Just a simple strategy based on dynamic zones by Allenster. Still a work in progress.

Count:172
Name: Ehlers Fisher Stochastic Relative Vigor Index Strategy
Description: By John Ehlers from his book "Cybernetic Analysis for Stocks and Futures".

Count:172
Name: OTT-Stoch-TP/SL
Description: This strategy combines stochastic oscillator and OTT (OTT is originally owned by Anıl Özekşi). The strategy is triggered at fast OTT and slow OTT crossing points. User can select the "Evaluate Stoch OTT" option which is validate the crossing points through stochastic oscillator. In the same way, user can select "take profit", "stop loss" and position...

Count:171
Name: QuantNomad - MA Strategy - 1 minute - ETHUSD
Description: Interesting performance for simple MA strategy on 1m ETHUSD. I used only close price and 15 SMA in it. Performance is 55% over 10 days with a drawdown of only 3.5%. Percent profitable is only 30% with almost 2k trades. For sure this won't work as a standalone strategy, with 2k trades commission and slippage will destroy all your PNL but it can be a pretty good...

Count:171
Name: CryptoTrader - Simple and effective Ema Crossover
Description: Works well on 4h charts, ETHUSD,BTCUSD,and XRPUSD but can be tested also on other crypto's. On those pairs no need of sofisticate scripts to trade. Can add a trailing stop, but as you see works perfect as it is. KISS (Keep It Simple Stupid).

Count:171
Name: Baseline Strategy - evo
Description: Strategy version of my baseline indicator, helpful for back testing.

Count:171
Name: EMA Cross Strategy
Description: Profitable on BTC and some cryptocurrencies on 15m/1h/4h timeframes.

Count:171
Name: SMA Offset Strategy
Description: This strategy uses simple moving averages and some math to determine buy/sell points. We keep a SMA 100 day line as our basis for our offset. If the close price is below the line, we choose our open position based on how low below the line it is goes, this value (Low Offset) is a percentage and can be configured by the user. Same for closing your position, when...

Count:171
Name: RSI Crossover-SR
Description: rsi cross over helps identify the right points to buy sell. use in combination with Renko/Heiken Ashi charts to maximum gains

Count:171
Name: Elliot Wave - Impulse Strategy
Description: The WHAT =============> A strategy based on combination of 3 indicators. 1) "Elliot Wave - Impulse" indicator from @HeWhoMustNotBeNamed () . 2) "Cyclic RSI High Low With Noise Filter" from @RozaniGhani-RG (). 3) "Mesa Advanced Triggers" from @jordanfung () By using these 3 indicators together, I was able to project and backtrack some very nice return values even...


Count:171
Name: Soldiers Pattern Modified
Description: This can be perceived as modified 3 soldiers, relaxed NR4 or even extended harami candlestick pattern. Works for any instrument and any timeframe. The idea is to find out any number of candles having their individual highs and lows, all within high and low range of base candle. The count of soldiers and if they must be of same color, both can be...

Count:170
Name: BTC 30m Script
Description: What are your thoughts on this script? I connected it to Coinbase Pro via AWS lambda for auto-trading. I'm waiting for BTC to start bullish again before turning it on in production. Thoughts? Thank you! John

Count:170
Name: Grid Strategy with MA
Description: 0. Preface Hello traders, This is a strategy script that allows you to utilize a Grid Strategy using moving averages. It is very simple, but I decided to post it because it was hard to find such shared open-source codes in Pine Script. 1. Main This is a very simple trading method. Based on the moving average line you set, if the price drops by a certain...

Count:170
Name: DC Breakout Strategy | This is simplicity at its finest.
Description: As the title already describes: this is a Donchian breakout strategy. This strategy, as of now, only goes long. It goes long when the price close makes a new high and the 8 day moving average is above the 32 day moving average. The strategy exits the trade if the price breaks the atr trailing stop of * 3 or the 8 day moving average crosses below the 32 day moving...

Count:170
Name: ETH APO Strategy [60MIN]
Description: In general this strategy is wining but I won't recommend a trader to start using it directly. You can you use it as a template to build your own strategy on, with a bit improvement you can get much better results. The APO indicator is the core of this strategy and it only work on Long trades, you may focus on fining a way to filter the wrong long entries to make...

Count:170
Name: DayTradingFutures Cross-Strategy
Description: OVERVIEW This indicator was designed to help beginners use a cross over strategy that can be used for entries, exits and to for trend direction. █ COMPONENTS Here is a brief overview of the indicator: Weighted Moving Averages I find that by using a weighted moving average ( WMA ) to show a crossover, is very close to using a MACD signal line cross or using a...

Count:170
Name: RSI EMA SMA Strat
Description: This script looks at the RSI EMA and RSI SMA crossovers when above a certain price EMA It was mainly written for swingtrading and only for long positions on a daily timeframe for BTC and ETH. They idea is to have a script that indicates when to convert your BTC /ETC to a stable coin and when to buy in again. You could try to use it for other positions (short,...

Count:170
Name: Combo Backtest 123 Reversal & Stochastic
Description: This is combo strategies for get a cumulative signal. First strategy This System was created from the Book "How I Tripled My Money In The Futures Market" by Ulf Jensen, Page 183. This is reverse type of strategies. The strategy buys at market, if close price is higher than the previous close during 2 days and the meaning of 9-days Stochastic Slow...

Count:170
Name: Rising ADX strategy
Description: I have always been a huge fan of ADX. Its good for finding out good trending moves. But it has been said that only ADX after 20 or 25 is good for trending market, but few trend gets completed at that level. So I have come up with a logic to find out the rising ADX. This could be used to determine the trending moves from the start. Buy signal: When close is...

Count:170
Name: Pairs Trading (basic OLS regression)
Description: Pairs trading using hedge ratio. Firstly, it calculates hedge ration using OLS linear regression. Then it calculates spread and z-score of spread. if spread in specific range (which it's possible to change in settings) it makes Long/Short orders. The very basic script.

Count:169
Name: Yuthavithi Kana with S/R Strategy
Description: I have got the idea from this page iwongsakorn.com and wrote my own kana scalper. This strategy draws 3 200 ATR level along side with the sma. It uses 200 ema as trend. Once the price approaches the 20 ema. it will place orders according to trend and take profit and stop loss quickly using the 200 ATR lines. This is a quick scalper strategy with winrate over 50%

Count:169
Name: BreakingDawn [JackTz] V4 (study)
Description: Another take on extending LazyBear's WaveTrend indicator. This one eliminates lots of the lost trades on the sudden drop of the price. Have a look at it and let me know your thoughts.

Count:169
Name: Heikin Ashi Candle Startegy for Long Position
Description: This strategy utilize Heikin-Ashi candlestick chart. Heikin-Ashi technique is a Japanese candlestick-based technical trading tool that uses candlestick charts to represent and visualize market price data. Heikin-Ashi candle is essentially taking an average of the movement. There is a tendency with Heikin-Ashi for the candles to stay red during a downtrend and...

Count:169
Name: Take Profit On Trend (by BHD_Trade_Bot)
Description: The purpose of strategy is to detect long-term uptrend and short-term downtrend so that you can easy to take profit. The strategy also using BHD unit to detect how big you win and lose, so that you can use this strategy for all coins without worry about it have different percentage of price change. ENTRY The buy order is placed on assets that have...


Count:169
Name: Free Strategy #08 (Combo of #01 and #02) (ES / SPY)
Description: This strategy was designed to be traded on daily data on the ES and SPY—the strategy was originally developed for NinjaTrader, which displays daily ES data based on RTH hours instead of 24 hours (1440 minute) like TradingView does, so we are presenting the results on the SPY until we figure out how to overcome this hurdle. The strategy combines the two ideas from...

Count:169
Name: Candle Retrace Strategy
Description: The WHAT =============> A strategy focused on opening trades during a retracement of the so-called Big Candles. Instead of having to recalibrate a strategy every so often (so it stays consistent with the current trend), this Candle strategy tries to use a different approach. It will detect candles with big bodies (which are usually created during a strong push...

Count:169
Name: Gann High Low Strategy
Description: Gann High Low is a moving average based trend indicator consisting of two different simple moving averages. The Gann High Low Activator Indicator was described by Robert Krausz in a 1998 issue of Stocks & Commodities Magazine. It is a simple moving average SMA of the previous n period's highs or lows. The indicator tracks both curves (of the highs and the lows)....

Count:169
Name: Smoothened Williams Accumulation/Distribution (Williams AD)
Description: Accumulation is a term used to describe a market controlled by buyers; whereas distribution is defined by a market controlled by sellers. Williams recommends trading this indicator based on divergences: Distribution of the security is indicated when the security is making a new high and the A/D indicator is failing to make a new high. Sell. ...

Count:168
Name: Schaff Trend Cycle + Double MA
Description: This strategy uses two different moving averages to determine a trend. It opens a position on a pullback from a trend. Conditions for buy signal are: ►Crossover out of Shaff Trend Cycle's extreme levels ►The price is above its short period exponential moving average. ►A short period exponential moving average is above a long period exponential moving...

Count:168
Name: Marubozu Forex Price action
Description: Hi, today I bring you a price action strategy/indicator for Forex, made out for Marubozu candle type. For the entries of it check if we have a long or a short marubozu. For exit we have for long when the actual candle is green and the last previous two were red. For exit we have for short, when the actual candle is red and the last previous two were green. If...

Count:168
Name: Volume Advanced
Description: I have found out this script some time ago. In fact it is not my code (just have modified a little) and I don't know the author (couldn't find). So now I would like to share with the community, maybe somebody would have some idea how to make it better. The script itself is modified volatility oscillator (like ATR) based on volume, making a deal at the moment of...

Count:168
Name: PresentTrend - Strategy [presentTrading]
Description: - Introduction and how it is different The PresentTrend strategy is a unique custom trend-following strategy. This combination allows the strategy to take advantage of both short-term and long-term market trends, making it suitable for various market conditions. BTCUSDT 4hr chart (700.hk) 3D chart - Strategy, How it Works RSI or MFI: The first part uses a...

Count:168
Name: Crypto High Potential Strategy
Description: BTCUSD -- 5 min BUY POSITION 1 : The price is above the EMA 2 : The Parabolic SAR is green 3 : The RSI is above the 50 line SELL POSITION 1 : The price is bellow the EMA 2 : The Parabolic SAR is red 3 : The rsi is below the 50 line

Count:168
Name: Center Of Gravity Backtest
Description: The indicator is based on moving averages. On the basis of these, the "center" of the price is calculated, and price channels are also constructed, which act as corridors for the asset quotations. You can change long to short in the Input Settings WARNING: - For purpose educate only - This script to change bars colors.


Count:167
Name: 2/20 Exponential Moving Average Backtest
Description: Strategy This indicator plots 2/20 exponential moving average. For the Mov Avg X 2/20 Indicator, the EMA bar will be painted when the Alert criteria is met. You can use in the xPrice any series: Open, High, Low, Close, HL2, HLC3, OHLC4 and ect... You can change long to short in the Input Settings Please, use it only for learning or paper trading. Do not...

Count:167
Name: Noro's Ichimoku Stop Strategy
Description: It 's the Ishimoku Cloud and the stop orders.

Count:167
Name: Combination Parabolic MA/IIR/ALMA Strategy, with other goodies
Description: Okay, so this is a lot. It started mostly with me combining indicators and looking for ideal entry criteria. It is also a collection of conditions, whether used or unused, for my current chosen "best" strategy. It is currently set how I like it, but it has changed with time, and will continue to do so. Within, there are variables that are unused, but offer some...

Count:166
Name: Long only strategy VWAP with BB and Golden Cross EMA50/200
Description: This is strategy, mainly designed for stock markets It makes uses of the EMA 50/ 200 ( Golden cross) and VWAP and Bollinger bands. It only takes long positions. It can be adapted to all time frames, but preferably to be used with longer timeframes 1h + The rules for entry are the next ones : 1. EMA50 > EMA 200 2. if current close > vwap session value 3. check...

Count:166
Name: Trend-following RSI Strategy
Description: According to classical technical analysis, an RSI above 70 should signal overbought conditions and, thus, a sell-signal. Cryptocurrencies represent a whole new asset class, and they reshape the classical concepts of technical analysis. FOMO-buying can be very powerful, and coins can remain in overbought conditions enough to provide excellent opportunities for...

Count:166
Name: Smooth Moving Average [STRATEGY] @PuppyTherapy
Description: The Smooth moving average script combo combines the ability to help you create a very simple trend-following strategy or a simple trend-following filter. You are able to select from a large variety of moving averages add Heikin Ashi Candles as a source and also add additional smoothing to every single of the moving averages. The Strategy is using the...

Count:165
Name: M&H_v420b
Description: // //////////////// Attempt to Reduce ReDraw version ///////////////////// // // Microcana.com strategy by pilotgsms - version 4.20b <<<< Edited by Seaside420 >>>> special thanks to 55cosmicpineapple // ...

Count:165
Name: Swing Trades Validator - The One Trader
Description: This swing trading strategy validator is built on the original strategy taught in my bootcamp for swing traders. The strategy is simple and follows a trend trading pattern on prices reacting to Exponential Moving Averages over a multiple time-frame analysis. The details of the strategy are as follows: - Holding Period : Upto a couple of months - Time-frames to...

Count:165
Name: Understanding order sizes
Description: type: properties manipulation, no programming needed time required: 15minutes, at least level: medium (need to know contracts, trading pairs) A strategy can "appear" to work or be broken depending on the pile of cash that is working on. This amount is defined in the strat properties, under "order size". For noobs (like me) this is very confusing at first :) A...

Count:165
Name: Noro's PriceChannel Strategy v1.2
Description: In v1.2 added + Capital, % parameter + Counter-trend entry + Lines of PriceChannel The blue line is the middle of the price channel. If to use trend entry If there are 2 red candles in a row and a body of the last candle more than a half of an average body of a candle and a candle was closed over the line - to open long-position If there are 2 green...

Count:165
Name: Swing VWAP Weekly Stock and Crypto Strategy
Description: This is a simple yet very efficient swing strategy designed for crypto and stock market, using big timeframes. Its main component is VWAP weekly, so for best scenarios its better to use big timeframes such as 8h+. The rules for entry are simple: If our close if above vwap weekly we enter long . If our close is below vwap weekly we enter short. We exit from...

Count:165
Name: Relative Returns Strategy
Description: Looks like an ultimate strategy for buy and hold investors. This is designed based on the indicator : Converting that into strategy with little optimization yield this. One change here is, instead of using the return percentage directly, we are using moving averages on both of them. Buy condition : Moving Average on stock return crosses over that of index...


Count:164
Name: Low Scanner Forex strategy
Description: This strategy is non repainting as the scanner do not use security for its entry and the Hull MTF is non repainted one. it design for forex only why it working as such ? simple once we have good detection of Low using Low scanner and Low scaner strategy which is a killer for stoks as I shown in that script here i show winning non repainting strategy for...

Count:164
Name: Combo Backtest 123 Reversal & Ergodic TSI
Description: This is combo strategies for get a cumulative signal. First strategy This System was created from the Book "How I Tripled My Money In The Futures Market" by Ulf Jensen, Page 183. This is reverse type of strategies. The strategy buys at market, if close price is higher than the previous close during 2 days and the meaning of 9-days Stochastic Slow...

Count:164
Name: MA 12, MA 24, RSI OB-OS, CCI by WP@SITech
Description: Developed by Worachart Pirunruk, MD - Siam Intelligence Technology This is the signal that generates based on 4 Technical Analysis Tools: 1. SMA 12, 2. SMA 26, 3. RSI 14,3,3 4. CCI Signal to Buy/Long when the RSI below Dynamic oversold line based on close price back 60 bars. Parameter. This signal doesn't have to best TP point, I'm working on improvement, now....

Count:164
Name: Stable Coin - Arbitraje
Description: A simple strategy to make money from stable coin volatility

Count:164
Name: Strategy:Reversal-Catcher
Description: What This is a plain and vanilla reversal based strategy for intraday (15m) timeframe on Futures prices of the assets. Now what all it comprises of? It finds out the dynamic support & resistance from Bollinger Band (20 period, 1.5 std dev). It finds out the potential divergence of price deviation from 5 period exponential moving average (EMA). If the...

Count:164
Name: Ehlers-Smoothed Stochastic RSI Strategy
Description: I have been asked by several people for a Strategy based on the ES Stoch RSI Alert so here it is. The strategy has an adjustable backtest date range so that you can adjust the test time period to whatever you like. This strategy is based on a script by fskrypt.

Count:163
Name: Last High and Low Level Backtest
Description: This script shows a high and low period value. SelectPeriod - Day or Week or Month and etc. LookBackPeriods - Shift levels 0 - current period, 1 - previous and etc. You can change long to short in the Input Settings WARNING: - For purpose educate only - This script to change bars colors.

Count:163
Name: DCA After Downtrend v2 (by BHD_Trade_Bot)
Description: The purpose of the strategy is to identify the end of a short-term downtrend . So that you can easily to DCA certain amount of money for each month. ENTRY The buy orders are placed on a monthly basis for assets at the end of a short-term downtrend: - Each month condition: In 1-hour time frame, each month has 24 * 30 candles - The end of short-term downtrend...

Count:163
Name: Noro's Bollinger Strategy v1.4
Description: Uses: - Bollinger Bands - RSI-filter - Body-filter - Color-filter

Count:163
Name: Parabolic SAR Heikin Ashi MTF Candle Scalper
Description: This is scalper strategy designed around parabolic sar indicator, where as an input candle value it uses the heikinashi from a higher timeframe. This example has been adapted to SPY/SPX chart In this case ,we are using a 5 min chart, but the calculations are made on a 15 min heikin ashi chart for the PSAR and then on 5 min chart we plot the results. At the same...

Count:163
Name: GMS: RSI Strategy
Description: This is just a basic RSI strategy that it easy to use and quite comprehensive so you can quickly test out an idea based on RSI. - I made it comprehensive in that you can select long, short, or both. - There is a simple moving average trend filter. You can filter for trades above, below, or don't include it at all. - The exit is based on a simple moving...

Count:163
Name: SELO Triangular Wave
Description: Based on master indicator creator @AlexGrovers scripts i just combined some of his work. Result depends on settings and pairs and is not forward tested yet although the backtest can give some good results.

Count:163
Name: Trend Following with Bollinger Bands
Description: This is a trend following system which uses the Bollinger Bands instead of the Donchian Channels. Long position: * Price closes above the middle line. * The fast EMA (in this case the 40) crosses over or is above the slow one (in this case the 120) Short position: * Price closes below the middle line. * The fast EMA crosses under or is below the slow one....


Count:163
Name: Pivot Point Breakout
Description: This is a strategy taken from Perry Kaufman's book, Trading Systems and Methods. Just like the title says, it's a breakout strategy. It works by buying when the current high is higher than the last pivot high, and selling when the low is lower than the last pivot low. It does not have a good success probability, and relies on the good reward to risk ratio....

Count:162
Name: doncanhin channel statergy
Description: doncanhin channeldoncanhin channeldoncanhin channeldoncanhin channeldoncanhin channeldoncanhin channeldoncanhin channeldoncanhin channeldoncanhin channeldoncanhin channel

Count:162
Name: EMA crossover (daily TF)
Description: This strategy is only applicable for daily timeframe only. EMAs have been smoothened out to make sure to include volatility glitches that may occur. I have used following conditions: >EMA crossover of two frames already occurred > Significant volume in the candle > Candles are properly bullish or bearish not doji > price is near EMA crossover > trading...

Count:162
Name: ATR with EOM and VORTEX
Description: This is a strategy, designed for long trends for stock and crypto market. Its made of ATR for volatility, EOM for volume and VORTEX for the trend direction. In this case on the ATR, I applied an EMA to check if current position is above the EMA -> bull trend, below ema -> bear trend For EOM I am using the positive and negative value scale, if its positive we are...

Count:162
Name: Does your trading pass the seasonality test?
Description: Are you consistently beating the standard "Buy and Hold" benchmark? Check your performance against the next most common strategy: Buy at the start of the holiday season and close in the new year. By default, the strategy starts with $100,000 and risks 25% of the account on each swing trade. Commission is set to be 0.5% of each trade. You can tweak the...

Count:162
Name: SS420FX
Description: Two Moving_Average cross's & Daily_Candle cross Based on Hull_MA Developed by Alan Hull, it is an indicator, that solves the problem with making a moving average more reactive to current price activity. The Hull Moving Average almost eliminates lag and manages to improve smoothing. The HMA manages to stick to rapid changes in price activity, as it has superior...

Count:162
Name: TrendMaAlignmentStrategy - Long term trades
Description: This is another strategy based on moving average alignment and HighLow periods. This is more suitable for long term trend traders and mainly for stocks. Candle is colored lime if : Lookback Period has at least one bar with moving averages fully aligned OR None of the bars in Lookback periods has negatively aligned moving averages (More than half are positively...

Count:162
Name: ATA v4 Strategy
Description: Ata strategy is include 3 different time frame = MTF 2 different moving average =MA Oversold/overbought for relative strength index =RSI Strategy exit for trailing stop loss %2 =TSL MTF like 1 day, 4h and 5 min, between 2 moving averages like fibo numbers 21 and 34. Also strategy test for oversold up to 60 and overbought under the 25 with RSI. Stratefy exit...

Count:161
Name: Volatility Stop trading with risk management
Description: Quick coding of a trading system based on the Volatility Stop (VStop) indicator. In addition to that I added the possibility to calculate the position size based on the amount that you want to risk. Beware, this is the amount you want to risk per trade. The total draw-down might be higher, as you can have multiple loosing trades.

Count:161
Name: Dynamic Pivot Point Backtest
Description: This Pivot points is calculated on the current day. Pivot points simply took the high, low, and closing price from the previous period and divided by 3 to find the pivot. From this pivot, traders would then base their calculations for three support, and three resistance levels. The calculation for the most basic flavor of pivot points, known as...

Count:161
Name: [KL] Bollinger Bands Consolidation Strategy
Description: This strategy will enter into long position based on the volatility of prices implied by indicators of (a) Bollinger bands, and (b) ATR. Application of Bollinger bands ("BOLL") Using plain vanilla settings for BOLL (i.e. 20 period moving average, and 2 standard deviations of closing prices), we are interested to know about the shape of the area that is bounded...

Count:161
Name: SNAP BACK 2.0 Strategy
Description: This strategy is designed to allow you to catch the bounce or "SNAP Back" of an equity that has been in a trend. 1) Once the moving averages are in the order of 200SMA > 50 SMA > 34EMA > 20SMA > 8EMA (or reverse for and uptrend), the strategy is setup. 2) Next you wait for a trigger of the closing price crossing the 8EMA, while there is a desired gap size between...

Count:161
Name: MACD Histogram Backtest
Description: Testing the trades signaled by the daily MACD histogram to see how they would have performed, compared to regular MACD Crosses. I'm going to take the 'List of trades' and analyse it seperately as some of the profit percentages seem a little off in the tradingview calculation, though it could just be my bad math! Hi CryptoLove :) Hope this helps your investigation...

Count:161
Name: Combo Backtest 123 Reversal & Fisher Transform Indicator
Description: This is combo strategies for get a cumulative signal. First strategy This System was created from the Book "How I Tripled My Money In The Futures Market" by Ulf Jensen, Page 183. This is reverse type of strategies. The strategy buys at market, if close price is higher than the previous close during 2 days and the meaning of 9-days Stochastic Slow...

Count:161
Name: Noro's Primitive Strategy v1.0
Description: It is calculated what long a candle body Average length of a body of a candle, for the last 30 candles is calculated If the candle red and a body of a candle is more average / 2 - to open long (and to close short) If long is open, a body of a candle is more average / 2, the candle green and a position is profitable - to close long If the candle green and a...

Count:161
Name: SIDD-Vortex
Description: Sidd-Vortex strategy is using Vortex formula to generate 4 signals Bullish1 Bullish2 and Bearish1 Bearish2. Bullish1 signal is getting generated when smooth ma of VIP is crossing over smooth ma of VIM and smooth VIM is falling from previous bar smooth VIM Bullish2 signal is getting generated when smooth ma of VIP is crossing over smooth ma of VIM and smooth VIP...

Count:161
Name: Noro's Fast RSI Strategy v1.2
Description: For: - crypto/fiat - crypto/crypto - timeframes: 1hour, 30min, 15min, 5min Strategy uses 2 indicators: 1) RSI indicator, period = 7 (default) 2) EMA Body, period = 30 EMA Body Step 1. The candle body size is calculated = abs(close-open) Step 2. The average size of a body of a candle is calculated. Only 30 last candles. EMA . Step 3. If the body...

Count:161
Name: Strategy - DMI Indicator with DPO Indicator as a Guard
Description: The Directional Movement Index Indicator is one of my favorite indicators in tradingview's built-in library. It is free to use for all For more information on what the DMI is, please visit: www.tradingview.com The only problem I've come across with the DMI is that when it hits a 'trade range zone' it triggers false new trends (this is the case with almost every...

Count:160
Name: Liquidity Breakout - Strategy [presentTrading]
Description: - Introduction and How It Is Different The Liquidity Breakout Strategy is a unique trading strategy that focuses on identifying and leveraging patterns in market price data. This strategy, mainly inspired by the script "Master Pattern" by LuxAlgo, takes a different approach from many traditional strategies that rely on technical indicators or fundamental...

Count:160
Name: Ema Backtester
Description: A simple, but useful script for backtesting purposes. Find the optimal Settings for your strategy. tips are always welcome at: 38uGQJDDZDL6wX48x4gYTccPeQ3ZHVYmY4 (btc) I hope you enjoy the script :)

Count:160
Name: Supertrend blind following
Description: This strategy is showing what would be if you just follow supertrand indicator. As we know, supertrand doesn't appear immediately and we need to wait the next bar for decision about entering. So you can see what will happen if you take position after supertrend finally formed. This indicator is extremely dangerous without another tools and can give very serious...

Count:160
Name: Dual Fibonacci Zone & Ranged Vol DCA Strategy - R3c0nTrader
Description: What does this do? This is for educational purposes and allows one to backtest two Fibonacci Zones simultaneously. This also includes an option for Ranged Volume as a parameter. Pre-requisites: First off, this is a Long only strategy as I wrote it with DCA in mind. It cannot be used for shorting. Shorting defeats the purpose of a DCA bot which has a goal that is...


Count:159
Name: SPY 1 Hour Swing Trader
Description: The purpose of this script is to spot 1 hour pivots that indicate ~5 to 6 trading day swings. Results indicate that swings are held approximately 5 to 6 trading days on average, over the last 6 years. This indicator spots a go long opportunity when the 5 ema crosses the 13 ema on the 1 hour along with the RSI > 50. It also spots uses a couple different means to...

Count:159
Name: 50 Pips A Day Strategy - Kaspricci
Description: 50 Pips A Day Strategy This strategy is designed to work on 1 hour timeframe. It is designed to capture the early market move of major forex pairs like EURUSD or GBPUSD. It takes the high and low of the first candle (7 a.m. GMT, London Stock Exchange opens) and places to pending orders at these prices levels. High + additional gap in pips = buy stop pending...

Count:159
Name: Noro's Trend SMA Strategy v1.3
Description: Trade strategy which uses only 2 SMA . The slow SMA (blue) is used for definition of a trend The fast SMA (red) is used for an entrance to the transaction Recomended: For H1 For crypto/fiat Fast SMA Period = 5 Slow SMA Period = 20 In the new version 1.3 - priceChannel In the new version 1.2 - profit became more - the risk became less - strategy...

Count:159
Name: EURUSD 5min london session strategy
Description: Hey, today I bring you another strategy that I pull up together. Its a KISS system ( keep it stupid simple ) We have 2 ma of 5 lenght each, one applied to the high and the other to low. With this we create a channel. If the candle close above or below the channel we got a signal. Then we can optionally verify with the RSI to increase our chances. At the same...

Count:159
Name: [STRATEGY][RS]MicuRobert EMA cross V2
Description: Fixed a error were if trailing stop wasnt selected it wasnt activating stops. changed property's to fit 5min timeframe parameters.

Count:159
Name: Renko Bollinger Strategy
Description: If you build Bollinger Bands from the values of Renko or Haken Ashi, then you can get an interesting strategy.

Count:158
Name: CCI Strategy
Description: This CCI strategy will allow you to enter a long or short off a CCI zero line cross or control entries and exits from custom upper and lower band lengths. You can set a custom upper band which it will buy when it crosses up and then a custom upper band exit which it will sell when it crosses down. For a short you can set a custom lower band which it will short...

Count:158
Name: Noro's Shift MA Strategy v1.0
Description: Strategy uses 2 moving averages. On lower buys. On top sells. Marginal trade isn't used. For crypto, any timeframe.

Count:158
Name: Combo Backtest 123 Reversal & RSI based on ROC
Description: This is combo strategies for get a cumulative signal. First strategy This System was created from the Book "How I Tripled My Money In The Futures Market" by Ulf Jensen, Page 183. This is reverse type of strategies. The strategy buys at market, if close price is higher than the previous close during 2 days and the meaning of 9-days Stochastic Slow...

Count:158
Name: PIVOT STRATEGY [INDIAN MARKET TIMING]
Description: A Back-tested Profitable Strategy for Free!! A PIVOT INTRADAY STRATEGY for 5 minute Time-Frame , that also explains the time condition for Indian Markets The Timing can be changed to fit other markets, scroll down to "TIME CONDITION" to know more. The commission is also included in the strategy . The basic idea is when , 1) Price crosses above ema1...

Count:158
Name: Donchian Channels System [racer8]
Description: Donchian Channels was developed by Richard Donchian in 1949. They have been used with great success by the Turtles, a group of traders in the 1980s who managed to obtain returns of 80% annually. Truly incredible story. This particular indicator is a trend trading system I coded that shows you when to enter long or short and when to exit those longs or shorts. In...

Count:158
Name: Bollinger Blast Buy Unholy Grail
Description: This strategy copy the Nick Radge's trading ideas for a profitable systems. He mentions a Bollinger Band idea which is also published in his book Unholy Grails. Nick says: he strategy that we did test and showed very promising results was an entry using a Bollinger band and an exit using the opposite Bollinger band, but we use 3 standard deviations for the...

Count:158
Name: Strategy LinReg ST@RL
Description: Strategy LinReg ST@RL Strategy LinReg ST@RL is a visual trend following indicator. It is compiled in PINE Script Version V5 language. This indicator/strategy, based on Linear Regression Calculation, is intended to help beginners (and also the more experienced ones) to trade in the right direction of the market trend and test strategy. It allows you to avoid...

Count:158
Name: Two level TP + TrailStp exits example
Description: Multi level exist example. When you need take profit 50% of position size and trailing stop for remain part. The different ids names for exits is important. Same id needs when we want to modify exit's parameters.

Count:157
Name: Noro's Bollinger Strategy v1.2
Description: Bollinger Bands Pyramiding!!! For: - any crypto - timeframe: 1min, 3min, 5min, 15min, 30min, 1h

Count:157
Name: Short Selling EMA Cross (By Coinrule)
Description: BINANCE:AVAXUSDT This short selling script works best in periods of downtrends and general bearish market conditions, with the ultimate goal to sell as the the price decreases further and buy back before a rebound. This script can work well on coins you are planning to hodl for long-term and works especially well whilst using an automated bot that can execute...

Count:157
Name: 3-Signal Directional Trend Strategy for E-Minis
Description: This is a conceptual strategy intended for E-mini S&P 500 futures with hourly bars. It uses three signals, going long or short when two or more change in the same direction. First is MACD. A positive oscillator is considered a bullish signal and a falling oscillator is interpreted bearishly. Next, stochastics are used as an overbought/oversold indicator....

Count:157
Name: example for panel signals
Description: This is just easy way to make your take profit , stop loss etc in panel so any signal or lines you can can put via similar template the strategy here is not important

Count:156
Name: VXD Cloud Edition for Python-Binance-bots.
Description: VXD Cloud Edition for Python-Binance-bots. to overcome sideways market conditions this cloud configured for low timeframe. every TA is same as VXD Cloud Edition but custom alert message for bots. Risk:Reward Calculation Risk of Ruin Setting can now selected between Fixed $ or % if Buy your Stoploss will be Swing low if Sell your Stoploss will be Swing high...

Count:156
Name: WhaleCrew Backtester
Description: Backtesting indicators is easy , just add the following line of code to your script: plot(longEntry ? 1 : shortEntry ? -1 : longTP ? 0.5 : shortTP ? -0.5 : 0, color=na, editable=false, title='Backtest') These numbers are defined as constants in the backtester source-code. After adding this indicator to your chart: 1. Open Settings 2. Select supported...

Count:156
Name: Classic Long Term Trend Following System
Description: This is a classic long term trend following system. The breakout period is 50 days instead of 20 and the moving average crossover are 40 and 120. The moving averages are also exponential instead of simple. The stoploss is 4 ATRs away from the price. Recommendations: Donchian Channels settings > 50 days Moving Averages > 40 and 120, 80 and 140 Important...

Count:156
Name: Noro's ShiftMA-multi Strategy v1.0
Description: Strategy ShiftMA with 3 lines for long positions.

Count:156
Name: FTR, WMA, OBV & RSI Strategy
Description: This Pine Script code is a trading strategy that uses several indicators such as Fisher Transform (FTR), On-Balance Volume (OBV), Relative Strength Index (RSI), and a Weighted Moving Average (WMA). The strategy generates buy and sell signals based on the conditions of these indicators. The Fisher Transform function is a technical indicator that uses past prices...

Count:155
Name: Noro's Shift Close Strategy v1.0
Description: It is Noro's Shift MA strategy, but looks as the oscillator. Positions open at the time of closing of a candle. Not the limit order. It is possible to use a pyramiding.

Count:155
Name: EVWMA 6HR BF
Description: Credit goes to QuantNomad for the idea behind this code. Here is the original script. This strategy simply goes long on a cross above zero of the calculated delta line and short on a cross down below zero. The delta line is calculated using 2 volume based moving averages. There is a fixed 9% stop loss but you can change this to an ATR Derived stop in the settings.

Count:155
Name: Combo Backtest 123 Percent change bar
Description: This is combo strategies for get a cumulative signal. First strategy This System was created from the Book "How I Tripled My Money In The Futures Market" by Ulf Jensen, Page 183. This is reverse type of strategies. The strategy buys at market, if close price is higher than the previous close during 2 days and the meaning of 9-days Stochastic Slow...

Count:155
Name: EMA & Supertrend
Description: Strategy has been built based on the crossover of 21 EMA (EMA 1) and 55 EMA (EMA 2). Along with with strategy, user can alter the period of EMA 1 & EMA 2 based on their suitability. When EMA 1 crossover EMA2 or when prices closes above EMA 1 and EMA 1 is greater than EMA 2, strategy will generate Buy signal. Position gets closed when price closes below EMA...

Count:155
Name: BTC Daily Strategy BF
Description: Strategy based on code by @CredibleHulk so thanks for that. This is a strategy for the Daily Bitcoin chart which uses the MACD, RSI, Stochastic RSI and a moving average. The conditions for long or short signals depend on the indicators above crossing user-defined thresholds. Long signal = (Stochastic RSI k value is below Stochastic Sell Threshold) AND EITHER...

Count:155
Name: Moar Likes Strategy
Description: Logic from top ANN strategy. Base is future day close price. //only for fun

Count:155
Name: Ranged Volume DCA Strategy - R3c0nTrader
Description: Update: Republishing this as Public Open-Source script. Credits: Thank you "EvoCrypto" for granting me permission to use "Ranged Volume" to create this strategy. Thank you "junyou0424" for granting me permission to use "DCA Bot with SuperTrend Emulator" which I used for adding bot inputs, calculations, and strategy What does this do? This script is mainly used...

Count:154
Name: Open Drive
Description: Open Drive is a market profile concept introduced by Jim Dalton. It occurs when the price moves directionally and persistently for the first 30 minutes from the cash market open. It is necessary to use 30-minute bars as there needs to be enough time to measure an extreme move of the cash open. This means there will be fewer trades than other strategies using...

Count:154
Name: cRSI + Waves Strategy with VWMA overlay + sessions and order qty
Description: This is a fork of the cRSI + Waves Strategy with VWMA overlay strategy by Dr_Roboto , which adds two additional features, namely: the ability to limit trade signals to certain defined periods of time ("Sessions") during the trading day and, optionally, to close any open position at the end of either or both "Sessions" the ability to control the maximum...

Count:154
Name: EMA and MACD with Trailing Stop Loss (by Coinrule)
Description: An exponential moving average ( EMA ) is a type of moving average (MA) that places a greater weight and significance on the most recent data points. The exponential moving average is also referred to as the exponentially weighted moving average. An exponentially weighted moving average reacts more significantly to recent price changes than a simple moving average...

Count:154
Name: High Low Cloud Strategy Backtesting
Description: High Low Cloud Strategy Backtesting: this is a breakout and reversal previous trend strategy A. Indicator: row 6 to row 17 1. Fast Cloud Upper line = ema of High with 60 periods Lower line = ema of Low with 60 periods 1. Slow Cloud Upper line = ema of High with 240 periods Lower line = ema of Low with 240 periods B. Strategy Backtesting 1. Chart IDC, Time...

Count:154
Name: Automatic Moving Average Strategy
Description: A strategy based on Use in wavy markets on high timeframes.

Count:154
Name: vwap-ma-strategy-v0.7
Description: This strategy was inspired by my Israeli fellow iAtiya. I love it because it's my first pine v3 script that actually works. Powerful with respect to it's simplicity.

Count:154
Name: Profitable Easy Simple Strategy !!!
Description: I need you guys to have a look at this script and tell me why it is so profitable in the last 20 years or what i have missed . I can't seem to see anything wrong with it but i'm sure it can't be that easy . PS. This is my first script here so go easy on me i just seems too simple to be correct.

Count:154
Name: RMI + Triple HMRSI + Double EVWRSI + TERSI + CMO Strategy
Description: This is a strange experimental strategy WIP that I decided to upload an early version to share some of what I am working on. Just one script of a few. It combines Chande Momentum with RMI and some weird ones I am experimenting with - Triple Hull MA RSI, Double Exponential + Volume Weighted RSI, Triple Exponential RSI. And to top it off, a final oscillator that...

Count:153
Name: Zazzamira 50-25-25 Trend System
Description: Publishing my trading system script. It consist of several conditions to happen in order to open a trade. Work best on ES/MES 5 minute timeframe. I like to use it with this settings: - UTC -6 (don't tick Exchange Timezone) and rest as default To enter a trade, the following conditions must be met: Entry 1: the opening range (8:30AM - 9:15AM UTC-6) must be...

Count:153
Name: BTC Swinger v1
Description: Daily interval swing trading algorithm based on momentum techniques using ATR Stops. Made by Kory Hoang from Stably. Shout out to the Advanced Crypto Asset Trading crew! ;)

Count:153
Name: ARR-Pivote-India-Stategy
Description: A pivot point strategy for Indian Intraday users

Count:153
Name: BTC Profitable Wallets Strategy
Description: BTC Profitable Wallets Strategy - plots the percentage of profitable BTC wallets and places long orders when the profitable wallet share crosses above 50%, historically a very accurate point to catch the next Bull Run early. The only setting is a smoothing option using the Moving Average method and length of your choice. On Chain Data is queried from...

Count:153
Name: trend Screener downtrend
Description: this is in continuation with - previous trend screener i have published, In this code only downtrend screener is there ,This is type of custom screener I searched and made to screen bulk stocks any one can modify it, other may get help out of it. you can change or add new symbol in input section. in my code i have made defined and printed last close price when...

Count:152
Name: Noro's Fast RSI Strategy v1.4
Description: In 1.4 added: + SMA Filter + Min/Max Bars For: - crypto/fiat - crypto/crypto - timeframes: 1hour, 30min, 15min, 5min

Count:152
Name: TrendGuard Flag Finder - Strategy [presentTrading]
Description: Introduction and How It Is Different In the vast world of trading strategies, the TrendGuard Flag Finder stands out as a unique blend of traditional flag pattern detection and the renowned SuperTrend indicator. - A significant portion of the Flag Pattern detection is inspired by the "Flag Finder" code by @Amphibiantrading, which serves as one of foundational...

Count:152
Name: Rainbow Strategy
Description: The strategy is based on the following idea: www.youtube.com Not a fan of this but no script was present to show this idea's performance. Best suitable for the 1-minute chart. You can change the ema values as per your needs. For Tips to continue :) - BTC: 1BjswGcRR6c23pka7qh5t5k56j46cuyyy2 ETH: 0x64fed71c9d6c931639c7ba4671aeb6b05e6b3781 LTC:...


Count:152
Name: R19 STRATEGY
Description: Hello again. Let me introduce you R19 Strategy I wrote for mostly BTC long/short signals This is an upgrated version of STRATEGY R18 F BTC strategy. I checked this strategy on different timeframes and different assest and found it very usefull for BTC 1 Hour and 5 minutes chart. Strategy is basically takes BTC/USDT as a main indicator, so you can apply this...


Count:152
Name: 4 JMA Crossover Strategy (ps4)
Description: This is a PS4 update to my previous 4 JMA strategy that received many likes. In this and several recent strategies I use a simplified strategy setup, featuring trailing stops with very tiny increments. This is done intentionally in order to boost performance to the limit, so that to pinpoint that limit. Strategies with performance of about 90% or above are...

Count:152
Name: Sideways Strategy DMI + Bollinger Bands (by Coinrule)
Description: Markets don’t always trade in a clear direction. At a closer look, most of the time, they move sideways. Relying on trend-following strategies all the time can thus lead to repeated false signals in such conditions. However, before you can safely trade sideways, you have to identify the most suitable market conditions. The main features of such strategies...

Count:152
Name: MACD - EURUSD - 1min Long Only
Description: MACD strategy with a specified level the MACD and signal line must be under. Once the two lines cross under the specified level, a long entry is executed. When the MACD line crosses over the historian, the close entry will be executed. This strategy is designed around the high probability of a reversal in an under-bought trend.

Count:152
Name: Reversal closing price
Description: The reversal closing price (RCP) is a candlestick pattern which follows two simples rules: the low price of current candle needs to be lower than the low price of the last 2 candles the closing price of current candle needes to be higher than the closing price of the last candle This generates a signal for a long position. For a short position, the...

Count:152
Name: Combo Backtest 123 Reversal & DSS Bressert
Description: This is combo strategies for get a cumulative signal. First strategy This System was created from the Book "How I Tripled My Money In The Futures Market" by Ulf Jensen, Page 183. This is reverse type of strategies. The strategy buys at market, if close price is higher than the previous close during 2 days and the meaning of 9-days Stochastic Slow...

Count:152
Name: Combo Backtest 123 Difference between price and MA
Description: This is combo strategies for get a cumulative signal. First strategy This System was created from the Book "How I Tripled My Money In The Futures Market" by Ulf Jensen, Page 183. This is reverse type of strategies. The strategy buys at market, if close price is higher than the previous close during 2 days and the meaning of 9-days Stochastic Slow...

Count:151
Name: Bollinger DCA v1
Description: Simple "benchmark" strategy for ETFs, Stocks and Crypto! Super-easy to implement for beginners, a BTD (buy-the-dip) strategy means that you buy a fixed amount of an ETF / Stock / Crypto every time it falls. For instance, to BTD the S&P 500 ( SPY ), you could purchase $500 USD each time the price falls. Assuming the macro-economic conditions of the underlying...

Count:151
Name: CCI Scalping Strategy
Description: ---From the "Bitcoin Trading Strategies" book, by David Hanson--- After testing, works better with an ATR stop instead of the Strategy Stop. This parameter can be changed from the strategy Inputs panel. "CCI Scalping Strategy Recommended Timeframe: 5 minutes Indicators: 20 Period CCI, 20 WMA Long when: Price closes above 20 WMA and CCI is below -100, enter when...

Count:151
Name: Combo Backtest 123 Reversal & Bull Power
Description: This is combo strategies for get a cumulative signal. First strategy This System was created from the Book "How I Tripled My Money In The Futures Market" by Ulf Jensen, Page 183. This is reverse type of strategies. The strategy buys at market, if close price is higher than the previous close during 2 days and the meaning of 9-days Stochastic Slow...

Count:151
Name: TFO + ATR Strategy with Trailing Stop Loss
Description: This strategy is an experiment to learn what happens when The Trend Flex Oscillator (by Dr. John Ehlers) is used in conjunction with a volatility indicator like ATR. It was designed with cryptocurrency trading in mind. The way I coded this experiment makes it unsuitable for bear market conditions. When applied to a bull market, this trend-following...

Count:151
Name: EMA Envelope
Description: This is an attempt to convert gunbot's SG strategy into a proper TradingView strategy. The problem is that SG Sell Level relies on % above purchase price, which we don't actually know in TradingView. So we could try to get the average of the next bar or something, which maybe this is what the Slippage setting is? I'm not sure. Anyways, using % above EMA does...

Count:151
Name: TrianglePoint strategy
Description: This is trend following strategy ... when price is trading well above 200 ema and forms a triangle (based on number of bars defined) BUY ==== when fast ema > 200 ema check for triangle of last N bars (default set to 9) EXIT ====== when fast ema crosses down middle term ema if price reaches above 5% of buy , it changes the color to purple. You can...

Count:151
Name: EMA X BF 🚀
Description: EMA Crossover Strategy A simple EMA cross is a useful indication of a change in direction of a trend and is a very popular tool in trading. It can also be useful to judge price action momentum or severity by looking at the angle of the 2 EMAs, or the distance between them. There are 2 Exponential Moving Averages, one fast and one slow. When the fast EMA crosses...


Count:151
Name: Combo Backtest 123 Reversal & Klinger Volume Oscillator
Description: This is combo strategies for get a cumulative signal. First strategy This System was created from the Book "How I Tripled My Money In The Futures Market" by Ulf Jensen, Page 183. This is reverse type of strategies. The strategy buys at market, if close price is higher than the previous close during 2 days and the meaning of 9-days Stochastic Slow...

Count:151
Name: Weird Renko Strat
Description: This strategy uses Renko, it generates a signal when there is a reversal in Renko. When using historical data, it provides a good entry and an okay exit. However, in a real-time environment, this strategy is subject to repaint and may produce a false signal. As a result, the backtesting result should not be used as a metric to predict future results. It is highly...

Count:151
Name: Binary Options Strategy Template
Description: With the hype around Binary Options trading (more like gambling instead of trading) it is good to be able to backtest a strategy before using it in the live markets. In a Binary Options trade the trade get's closed after a specific amount of time and the only thing that matters is if the market has increased in price or decreased after that amount of...

Count:151
Name: Schaff Trend Cycle Strategy for XBTUSD 15m Backtest
Description: Schaff Trend Cycle Strategy for XBTUSD 15m Backtest

Count:151
Name: Bill Williams. Awesome Oscillator (AC) Backtest
Description: This indicator plots the oscillator as a histogram where blue denotes periods suited for buying and red . for selling. If the current value of AO (Awesome Oscillator) is above previous, the period is considered suited for buying and the period is marked blue. If the AO value is not above previous, the period is considered suited for selling...

Count:151
Name: DMI Swings (by Coinrule)
Description: The Directional Movement Index is a handy indicator that helps catch the direction in which the price of an asset is moving. It compares the prior highs and lows to draw three lines: Positive directional line (+DI) Negative directional line (-DI) Average direction index (ADX) DMI is simple to interpret. When +DI > - DI, it means the price is trending up....

Count:151
Name: EMA_cumulativeVolume_crossover[Strategy]
Description: This strategy is back test for EMA_cumulativeVolume_crossover BUY When ema50 crossover cumulative volume of 100 period Exit When ema50 cross down cumulative volume of 100 period Partial Exit for the partial profit I have used stopLoss value , but up side. When price is above partial profit and crossing down EMA 50 , exit 1/3 position Please note when you...

Count:150
Name: MA Cross
Description: Buys when short-MA crosses above long-MA. Shorts when short-MA crosses below long-MA.

Count:150
Name: Combo Backtest 123 Reversal & PFE (Polarized Fractal Efficiency)
Description: This is combo strategies for get a cumulative signal. First strategy This System was created from the Book "How I Tripled My Money In The Futures Market" by Ulf Jensen, Page 183. This is reverse type of strategies. The strategy buys at market, if close price is higher than the previous close during 2 days and the meaning of 9-days Stochastic Slow...

Count:150
Name: Moving Averages - Backtesting
Description: Alerts script that has triggers on multiple moving average crossovers so that profit is maximised, it also has an optional control moving average, enabled by default, that when active will stop trading when the price (first ma) is below the control moving average. Source code is open so that others can use and modify Click Below for Alerts Study version:...

Count:150
Name: EMA RSI Strategy
Description: Simple strategy ============= If the last two closes are in ascending order, the rsi is below 50 and ascending, and the current candle is above 200 ema, then LONG. If the last two closes are in descending order, the rsi is above 50 and descending, and the current candle is below 200 ema, then SHORT. LONG Exit strategy: ATR: Last 14 day Lowest: The lowest...

Count:150
Name: ░S░k░e░w░e░r░ ░S░e░w░e░r░
Description: This is a 10-day Skew Strategy on v2. The strategy: You go long in negative skew because the data looks like its leaning forward like a bull. You sell when the skew is positive because it looks like energy decay. notes: It might be more responsive using the median instead of ema? I'm not good with v3 yet. Don't PM for code help. Click the Help documents.

Count:150
Name: Simple Ema_ATR Strategy HulkTrading
Description: Simple EMA strategy, based on ema55+ema21 and ATR(Average True Range) and it enters a deal from ema55 when the other entry conditions are met Basically long and short conditions If long: 1) close must be less than open (because we are searching for a pullback) 2) emaFast(21) must be bigger than emaSlow(55) - for a trend detection 3) Difference between emaFast...

Count:150
Name: RSI Mean Reversion Strategy
Description: This is a scalping strategy designed to be used for crypto trading. It uses an Exponential Moving Average with a default length of 100 in order to identify the trend of the market. If the price is trading above 100, it will only take long trades, and vice versa for shorts. It places long orders when the RSI value closes below 40, and the price is also above the...

Count:150
Name: [XC] Adaptive strategy with volume bands
Description: First much thanks to alexgrover for his rich source of unbelievable indicators The list below shows as an example some might profitable strategy settings. But like every new strategy only a long term test can tell you if it works. //Curency - - src Time stategy Length C. Factor Smoothed SL TP Profit Factor (with no...

Count:150
Name: AlphaTrend Strategy with Trailing SL %
Description: this is a modified version of AlphaTrend Strategy with added trailing Stop Loss this is my first script that I have added to tradingview community the trailing SL makes it very effective to lower the losses and can improve the overall return

Count:150
Name: TEMA Cross Backtest
Description: A simple strategy backtest using two Triple Exponential Moving Averages (TEMA) crossing up and down. The default is a 20 TEMA crossing above 60 TEMA generates a long signal. Short signals are turned off by default, but included in the code at the last 2 lines (remove the '//'). Parts of script borrowed from other public scripts.

Count:149
Name: Yesterday's High v.17.07
Description: Yesterday’s High Breakout it is a trading system based on the analysis of yesterday's highs, it works in trend-following mode therefore it opens a long position at the breakout of yesterday's highs even if they occur several times in one day. There are several methods for exiting a trade, each with its own unique strategy. The first method involves setting...

Count:149
Name: Bitcoin - MA Crossover Strategy
Description: Before You Begin: Please read these warnings carefully before using this script, you will bear all fiscal responsibility for your own trades. Trading Strategy Warning - Past performance of this strategy may not equal future performance, due to macro-environment changes, etc. Account Size Warning - Performance based upon default 10% risk per trade, of account...

Count:149
Name: SMA Strategy
Description: In this strategy, I took advantage of two different sma intersections for buying and selling points. You can use the intersection of 2 sma values for buying and 2 separate sma intersection for selling. The main purpose of this strategy is to calculate the rate of return of the indicator belonging to this system. You can access the indicator version from this ...

Count:149
Name: 2/20 Exponential Moving Average Strategy
Description: This indicator plots 2/20 exponential moving average. For the Mov Avg X 2/20 Indicator, the EMA bar will be painted when the Alert criteria is met. Please, use it only for learning or paper trading. Do not for real trading.

Count:149
Name: QuantNomad - RSI Strategy - NKE - 5m
Description: Really good performance of Simple RSI Strategy for Nike (NKE) 5m chart. Params: RSI Length: 30, RSI OverSold level: 45, RSI OverBought Level: 60 Performance:57% profit, 112 trades, 73% prof, 6.7% dd, 1.36 sharpe. And remember: Past performance does not guarantee future results.

Count:149
Name: Vix FIX / StochRSI Strategy
Description: Updated to Pine V5 Enter upon a filtered or aggressive entry If there are multiple entry signals, allow pyramiding Exit when there is Stochastic RSI crossover above 80 Work with some futures and futures timeframes Based on Chris Moody's Vix Fix

Count:149
Name: Combo Backtest 123 Reversal & Percentage Volume Oscillator (PVO)
Description: This is combo strategies for get a cumulative signal. First strategy This System was created from the Book "How I Tripled My Money In The Futures Market" by Ulf Jensen, Page 183. This is reverse type of strategies. The strategy buys at market, if close price is higher than the previous close during 2 days and the meaning of 9-days Stochastic Slow...

Count:149
Name: Bollinger Bands + ADX Strategy
Description: // This strategy uses Bollinger Bands to buy when the price // crosses over the lower band and sell when it crosses down // the upper band. It only takes trades when the ADX is // below a certain level, and exits all trades when it's above it.

Count:149
Name: CMARSI Strategy (on ETHUSD) Seems working good
Description: there it is, it's using the Connor RSI with little variations. C onnor M oving A verage RSI

Count:149
Name: Momentum Strategy Idea
Description: This strategy idea uses two, fast and slow, momentum indicators for trade setups and exits. This is a fast reacting strategy which is very useful in trending instruments on 1D and 4H timeframes. This is the implementation used in QuantCT app. You can set operation mode to be Long/Short or long-only. You also can set a fixed stop-loss or ignore it so that the...

Count:148
Name: Kimchi Premium Strategy
Description: This strategy is based on the Korea Premium, also known as the “Kimchi Premium,” which indicates how expensive or cheap the price of Bitcoin in Korean Won on a Bitcoin exchange in South Korea is relative to the price of Bitcoin being traded in USD or Tether. Inverse Kimchi Premium RSI was newly defined to create a strategy with Kimchi Premium. Assuming that the...

Count:148
Name: GetTrendStrategy timing
Description: In this version you can select a period of time. Use only for analysis not for trading.

Count:148
Name: f.society
Description: beta indicator let me know any ideas and suggestions dejenme saber si tienen alguna sugerencia

Count:148
Name: Gidra's RSI or MFI Strategy v 0.1
Description: Strategy based on Gregg_s indicator RSI or MFI (ru.tradingview.com) When crossing above 0 - close short, open long When crossing below 1 - close long, open short For crypto/fiat and any timeframe

Count:148
Name: Ema(Ema10,10) Ema(Ema21,21) crossover strategy
Description: This code works better in 1 hour for crypto currencies like BTC 1.51% or LTC. It seems to beat the market. Feedback or improvement are welcome.

Count:148
Name: LFH/ Long positions using MACD histogram, long EMA and short EMA
Description: Disclaimer: I'm a noob. Hey there! I'm trying to implement a script which enter market long position when long EMA crossover short EMA and MACD histogram is positive and histogram at T time is lesser than histogram at T-1. And when short EMA crossover long EMA, plus MACD histogram is negative and histogram at T is greater than histogram at T-1, I want the...

Count:147
Name: Simple EMA20 Strategy + Stochastic
Description: This is a Trend Following Strategy. The intent of this strategy is to catchthe price as it trends higher than the 20-period EMA and sell immediately after the price closes below it. I have implemented calculations from Stochastic to make sure the price is coming from an oversold area. There is also a check to see if the 20-period EMA is trending higher than before.

Count:147
Name: MACD of Linear Regression Slope Indicator
Description: I used MACD to find peak and trough points in the Linear Regression Slope

Count:147
Name: New Highs-Lows Strategy
Description: Strategy based on the net of new highs minus new lows on the NASDAQ.

Count:147
Name: Detrended Price Oscillator Strategy Backtest
Description: The Detrend Price Osc indicator is similar to a moving average, in that it filters out trends in prices to more easily identify cycles. The indicator is an attempt to define cycles in a trend by drawing a moving average as a horizontal straight line and placing prices along the line according to their relation to a moving average. It provides a means of...

Count:147
Name: [2021] SISIv SCALPER V1/0
Description: script of a scalping crypto strategy aim to capture very short reversal on low timeframe

Count:147
Name: Relative Momentum Index Backtest
Description: The Relative Momentum Index (RMI) was developed by Roger Altman. Impressed with the Relative Strength Index's sensitivity to the number of look-back periods, yet frustrated with it's inconsistent oscillation between defined overbought and oversold levels, Mr. Altman added a momentum component to the RSI. As mentioned, the RMI is a variation of the RSI...

Count:147
Name: Custom Triple Moving Average Strategy | Auto Backtesting
Description: Create your own MA Strategy set of up to three moving averages! Auto Backtesting. Cloud between MA1 and MA2. Many different MA types to choose from. Totally Custom! Happy Trading, and algorithm analysis!

Count:147
Name: Bullish Divergence Short-term Long Trade Finder
Description: This script is a Bullish divergence trade finder built to find small periods where Bitcoin will likely rise from. It looks for bullish divergence followed by a higher low as long as the hour RSI value is below the 40 mark, if then it will enter an long. It marks out Buy signals on the RSI if the value dips below 'RSI Bull Condition Minimum' (Default 40) on the...

Count:146
Name: BadaBing Ichimoku
Description: Uses a combination of entry parameters to define a very strict entry criterion Uses a simple criteria to close trades Intended for long-term trending trades

Count:146
Name: Ichimoku with ADX
Description: My first attempt at coding a strategy in pine script. The strategy tests for a confluence of bull / bear signals and executes a trade when these are met. It uses the ADX as a screen against fake breakouts.

Count:146
Name: Long only EMA CROSS 8/50/200 Backtest
Description: Improve EMA CROSS 8/50/200 with adjustable Exit EMA Level, and can open trade only when above EMA200


Count:146
Name: SMA EMA HMA VWMA Crossover Strategy with MA Turning Point Exits
Description: This version adds HMA and VWMA, allowing you to backtest different crossover strategies for any combination, with the exits on the turning point of the faster MA. Due to order limitations this will only work on higher timeframes for some combinations, or on more recent exchanges with less history. You can edit the code though to add the timestamp to a recent date.

Count:146
Name: Underworld Hunter Backtesting Algorhitm
Description: This strategy is built to prove the profitability of my Underworld Hunter indicator . It tests two different strategies. I won't be going into the calculation again since it is part of the original script. I just made a few adjustments. First one is clearly visual. It plots slimmer twin-coloured lines now and has a different colour for every extreme level....

Count:146
Name: Long Term Long/Short Strategy (Pair Trading)
Description: Longing or shorting an asset ratio depending on long term trend. Long term trend is defined by crossing of an asset or index and its SMA. Input values: * trend asset * SMA configuration (periods, resolution) * strategy: long only, long/short, short only

Count:146
Name: Ergotic TSI Strategy Backtest
Description: r - Length of first EMA smoothing of 1 day momentum 4 s - Length of second EMA smoothing of 1 day smoothing 8 u- Length of third EMA smoothing of 1 day momentum 6 Length of EMA signal line 3 Source of Ergotic TSI Close This is one of the techniques described by...

Count:146
Name: MACD BF 🚀
Description: Customised MACD strategy with dynamic stop losses based on ATR. Signals are generated when the delta value becomes positive or negative (when it crosses the zero line) Stop losses are printed on the chart in yellow and orange. They are based on recent average True Range to allow for volatility. INSTRUCTIONS Green background = long Red background = short ...


Count:145
Name: Vwap mtf Swing Stock Strategy
Description: This is a trending strategy designed for stock market, especially long trending assets such as TSLA, NIO, AMAZON and so on. Its made of volatility bands and weekly VWAP, in this case daily and weekly. This strategy has been adapted to go long only. Rules for entry For long , we want to enter close of a candle is above vwap weekly, and at the same time the...

Count:145
Name: Overnight Gap Analysis
Description: There is a wide range of opinion on holding positions overnight due to gap risk. So, out of curiosity, I coded this analysis as a strategy to see what the result of only holding a position overnight on an asset would be. The results really surprised me. The script backtests 10+ years, and here are the findings: Holding a position for 1 hour bar overnight on...

Count:145
Name: Golden Transform
Description: The Golden Transform Oscillator contains multiple technical indicators and conditions for making buy and sell decisions. Here's a breakdown of its components and what it's trying to achieve: Strategy Setup: The GT is designed to be plotted on the chart without overlaying other indicators. Rate of Change (ROC) Calculation: The Rate of Change (ROC) indicator is...

Count:145
Name: Pivot Profit Taker Strategy - With TimeFrames
Description: This is Pivot Profit Taker Strategy with TimeFrames

Count:145
Name: Linear Regression - Reverse Up/Down Strategy
Description: For my first foray into pine script I took the code from the generic "Consecutive up/down" and flipped the logic. I added a linear regression filter to try and stay with the overall trend. ATR added for visual, I eventually want to use it as part of the money management. Rules to open trade or close the opposite: IF the linear regression slope is >=0 AND the...

Count:145
Name: ZEGUELA DEMABOT
Description: Swing trading bot strategy. This indicator uses Dema 8 and Dema 24 crosses to throw buy and sell signals. You can also se take profit and stop loss parameters

Count:145
Name: ATR trailing Stop Loss tight to slack [Takazudo]
Description: This is a demo of ATR based trailing Stop Loss. This SL strategy uses 2 types of ATR based SL. tight SL as initial (ATR * 1.5) slack SL as trailing (ATR * 4) When any entry singal occurs by the buy/sell conditions, this SL strategy uses the "tight SL" as the initial SL. Then the SL will chase the price as trailing SL. However, this strategy uses the...

Count:145
Name: Timeframe Time of Day Buying and Selling Strategy
Description: This strategy allows you to back test longing or shorting or do nothing during time increments of 30 minutes. The price trends in one direction every 30 minutes and this strategy allows you to test various 30 minute time frames across a range of dates to capitalize on this. Make sure you are in the 30 minute time frame while viewing the performance and trade history.

Count:145
Name: Williams %R Strategy
Description: The Williams %R Strategy is a trading approach that is based on the Williams Percent Range indicator, available on the TradingView platform. This strategy aims to identify potential overbought and oversold conditions in the market, providing clear buy and sell signals for entry and exit. The strategy utilizes the Williams %R indicator, which measures the...

Count:145
Name: drnkk Strategy
Description: Strategy based upon combination with, ROC of Vortex, modified RSI, modified Price ROC, Bu da mı gol değil?

Count:145
Name: Average Directional Movement Index Rating Backtest
Description: The Average Directional Movement Index Rating (ADXR) measures the strength of the Average Directional Movement Index (ADX). It's calculated by taking the average of the current ADX and the ADX from one time period before (time periods can vary, but the most typical period used is 14 days). Like the ADX, the ADXR ranges from values of 0 to 100 and reflects...


Count:145
Name: Slow Heiken Ashi and Exponential Moving average Strategy 2.2
Description: Strategy using Slow Heiken Ashi by Glaz and Exponential moving averages. Looking for someone to help me turn the strategy into non-reoccuring alerts as I am having trouble doing so.

Count:145
Name: Ehler's Super Smoother strategy
Description: This strategy is a mean-reversal strategy based on John F. Ehlers's Super Smoother filter. I tried it on 15m timeframe with 'Recalculate After Order Filled' option checked.


Count:144
Name: IFR2
Description: The IFR2 strategy is based on the RSI indicator. If the two period RSI is less than the overbought level (25 is the default, but you can configure it to be lower), a long position is placed at the close of the candle. If you are doing it live, you'd have to enter the market ~ 10 minutes before it closes, check the RSI, and buy if it is lower than your overbought...

Count:144
Name: Scaled Normalized Vector Strategy, ver.4
Description: This is a modification of my Scaled Normalized Vector Strategy. This mod features some activation functions. Performance remains high. The repainting problem should be tested out.


Count:144
Name: RSI %b Signal [H1 Backtesting]
Description: ----------------------------------------------------------------- This simple strategy base on RSI, EMA, Bollinger Bands to get Buy and Sell Signal with detail as below: ----------------------------------------------------------------- 1.Define Oscillator Line + Oscillator Line is smoothed by ema(28) of RSI(14) on H1 Timeframe 2.Define Overbought and Oversold +...

Count:144
Name: Steven Primo's bollinger bands strategy
Description: Hi, this strategy is taken from a video made by Steven Primo. You can look it up on YouTube if you want to know about it. It is a mean-reversion strategy based on the Bollinger Bands, in which we wait for 5 consecutive closes above the upper band, and for a short-term top. Once it happens, we place an entry order on this top, with a stop at the nearest bottom...

Count:144
Name: Smoothed Heikin Ashi Trend on Chart - TraderHalai BACKTEST
Description: Smoothed Heikin Ashi Trend on chart - Backtest This is a backtest of the Smoothed Heikin Ashi Trend indicator, which computes the reverse candle close price required to flip a Heikin Ashi trend from red to green and vice versa. The original indicator can be found in the scripts section of my profile. This particular back test uses this indicator with a Trend...

Count:144
Name: Noro's KAMA Strategy
Description: KAMA = Kaufman's Adaptive Moving Average For: - any crypto - any timeframe

Count:144
Name: Noro's VixFix + RSI Strategy v1.0
Description: Strategy uses 2 indicators: 1) VixFix 2) RSI (period = 7) For an entrance signals from both indicators at the same time are necessary.

Count:143
Name: Combo Backtest 123 Reversal & Pivot Point V2
Description: This is combo strategies for get a cumulative signal. First strategy This System was created from the Book "How I Tripled My Money In The Futures Market" by Ulf Jensen, Page 183. This is reverse type of strategies. The strategy buys at market, if close price is higher than the previous close during 2 days and the meaning of 9-days Stochastic Slow...

Count:143
Name: Dragon Bot - Default Script
Description: Dragon Script is a framework to make it as easy as possible to test your own strategies and set alerts for external execution bots. The script has many features build in, like: 1) A ping/pong mechanism between longs and shorts 2) A stop-loss 3) Trailing Stops with several ways to calculate them. 4) 2 different ways to flip from long to short. The script is...

Count:143
Name: I11L - Meanreverter 4h
Description: ---Overview--- The system buys fear and sells greed. Its relies on a Relative Strength Index (RSI) and moving averages (MA) to find oversold and overbought states. It seems to work best in market conditions where the Bond market has a negative Beta to Stocks. Backtests in a longer Timeframe will clearly show this. ---Parameter--- Frequency: Smothens the RSI...

Count:143
Name: Trailing Stop with RSI - Momentum-Based Strategy
Description: Trailing Stop with RSI - Momentum-Based Strategy Description: The Trailing Stop with RSI strategy combines momentum analysis and trailing stop functionality to help traders identify potential entry and exit points in their trading decisions. This strategy is suitable for various markets and timeframes. Key Features: Momentum Analysis: The strategy...

Count:143
Name: RBI Strategy /w TSSL
Description: This is the Strategy with Backtest Date Range and Trailing Stop / Stop-Loss to vitelot's RBI indicator:

Count:143
Name: Stock trending strategy
Description: This is a long only strategy designed maily for stock markets and futures. In general it works best with 1h, however it can be optimized with other timeframes as well. Components: VWAP MACD histogram EMA 9 Rules for entry Long : For VWAP: close is above the vwap daily EMA: close is above the moving average MACD histogram is above 0 Short: For VWAP: close...

Count:142
Name: Combo Backtest 123 Reversal & Fractal Chaos Bands
Description: This is combo strategies for get a cumulative signal. First strategy This System was created from the Book "How I Tripled My Money In The Futures Market" by Ulf Jensen, Page 183. This is reverse type of strategies. The strategy buys at market, if close price is higher than the previous close during 2 days and the meaning of 9-days Stochastic Slow...

Count:142
Name: cowboy30minswing
Description: combination of rsi emas and moving averages 30 minute time frame to find swing trades

Count:142
Name: Noro's Trend SMA Strategy v1.4
Description: Trade strategy which uses only 2 SMA . The slow SMA (blue) is used for definition of a trend The fast SMA (red) is used for an entrance to the transaction Recomended: For H1 For crypto/fiat Long = true (if it is profitable as a result of backtests) Short = true (if it is profitable as a result of backtests) Use Fast SMA = true Fast SMA Period = 5 Slow...

Count:142
Name: Ichimoku Cloud and Bollinger Bands (by Coinrule)
Description: The Ichimoku Cloud is a collection of technical indicators that show support and resistance levels, as well as momentum and trend direction. It does this by taking multiple averages and plotting them on a chart. It also uses these figures to compute a “cloud” that attempts to forecast where the price may find support or resistance in the future. The Ichimoku...

Count:142
Name: Ergotic MACD Strategy [forked from HPotter]
Description: Ergotic MACD Strategy forked from HPotter In addition to this fine script you will find some additional features: - Backtester - Alerts - Filters: RSI, MFI, Price trend - Trailing Stop Loss - Other minor adjustments

Count:142
Name: Brrrrr strategy
Description: Theory When Tether prints new USDT the price of BTC rises. When Tether burns USDT the price of BTC goes down. Idea Open a long position when Tether starts printing new USDT. Close a long position when Tether begins to burn USDT. Optional: open a short position. (Short positions can be disabled in this script's settings.) Donchian Channel USDT changes...

Count:142
Name: RSITrendStrategy
Description: I don't know if there is any strategy based on RSI cross over. The strategy is designed based on RSI crossover, considering RSI(5) and RSI(11), with RSI(6) to identify highs & lows. I used this strategy to trade in Nifty 50 & Nifty bank indices. Whenever there is long mentioned on chart, I go for buying call option with premium near to 300, and placing stoploss...

Count:142
Name: Combo Backtest 123 Reversal & Moving Average Envelopes
Description: This is combo strategies for get a cumulative signal. First strategy This System was created from the Book "How I Tripled My Money In The Futures Market" by Ulf Jensen, Page 183. This is reverse type of strategies. The strategy buys at market, if close price is higher than the previous close during 2 days and the meaning of 9-days Stochastic Slow...

Count:142
Name: Strategy example1
Description: There is nothing special in this strategy , the only reason why its work becouse the take profit and the stop loss I put this example just for teaching by twiking the model to buy and sell allot we get fantastic results but the question is it true results or not? so the avreage buy and sell here is about 8 bars (x30 min ) so it buy and sell every 4 hours which...


Count:141
Name: Combo Backtest 123 Reversal & Inertia Strategy
Description: This is combo strategies for get a cumulative signal. First strategy This System was created from the Book "How I Tripled My Money In The Futures Market" by Ulf Jensen, Page 183. This is reverse type of strategies. The strategy buys at market, if close price is higher than the previous close during 2 days and the meaning of 9-days Stochastic Slow...

Count:141
Name: Noro's MAs Tests v1.1
Description: Trade strategy from one moving average. To choose what sliding average it is more effective to use for this pair and this timeframe. Types: 1 = SMA = Simple Moving Average 2 = EMA = Exponential Moving Average 3 = VWMA = Volume-Weighted Moving Average 4 = DEMA = Double Exponential Moving Average 5 = TEMA = Triple Exponential Moving Average 6 = KAMA =...

Count:141
Name: Kifier's MFI/STOCH Hidden Divergence/Trend Beater
Description: MFI/STOCH Hidden Divergence/Trend Beater General Idea: My premise around this strategy was to make a general strategy for crypto that would help out with finding entry positions for when you’re bullish on a crypto and want to hold on for a while, and at the same time avoiding massive drops. Essentially a way to mix long term/ swing trading; I somewhat achieved...

Count:141
Name: EMA Cloud Intraday Strategy
Description: ********NOT TRADING ADVICE - USE AT YOUR OWN RISK - TRADING IS RISKY - DO NOT BLINDLY FOLLOW THE SIGNALS FROM THIS STRATEGY******** This strategy utilizes the 9 and 20 period exponential moving averages to create a colored cloud between similar to what is seen on the Ichimoku Cloud. The strategy closes all trades by the end of the trading day. Entry is when the...

Count:141
Name: Ichimoku+SMAsmoothed
Description: SMA_smoothed with Ichimoku added makes good yet still simple strategy perhaps useful to APIbot programmers

Count:141
Name: Simple 17 BF 🚀
Description: A Simple Moving Average of period 17 based on ohlc4 values. We go long when price closes above it. We go short when price closes below it. No stop loss. No take profit. This strategy is really to showcase how effective a basic system can be, and that with discipline and patience, trading does not need to be complex to yield good results over time. You can change...

Count:141
Name: I11L Long Put/Call Ratio Inversion
Description: The Strategy uses the Put/Call Options Ratio Inversaion as a Signal and Implements simple Money Management rules. It is adjusted for the NDX and for the SPX in the 30min Range. The Oscilation has to be finetuned to reflect the correct Reversal point. A good indicator of the correct Reversal Point is a solid range of good backtesting results..

Count:141
Name: MA Turning Point Strategy
Description: Strategy based on going long on bottom turning point of a user-definable MA, and short at the top turning point. Can set any length of MA, and choose between SMA or EMA.

Count:141
Name: Buy and Hold, which day of month is best to buy?
Description: I wanted to invest a certain fiat amount each month and was wondering which day would be best to do this. So, with this script, you can set your entry day. On the last day of the date range, it will close all positions. You can then see what amount of the asset you have accumulated to date. If you try all the days of the month and see when you can sell the most...

Count:141
Name: Supertrend LSMA long Strategy
Description: This is a long strategy which combines Super trend indicator with LSMA moving average. In general it tends to works better with long trending markets such as stocks and cryptos using a big timeframe. The rules are simple Long entry: Supertrend is telling us to go long and close of a candle is above moving average Long exit: Supertrend is telling us to go...

Count:141
Name: Vin's Playzone Strategy
Description: How it works Playzone is a very simple system, utilizing just two exponential moving averages. The 'Zones' in which different 'actions' should be taken is highlighted with different colors on the chart. Calculations for the zones are based on the relative position of price to the two EMA lines and the relationship between the two EMAs How to use The basic...

Count:141
Name: Empirical Mode Decomposition Strategy Backtest
Description: The related article is copyrighted material from Stocks & Commodities Mar 2010 You can use in the xPrice any series: Open, High, Low, Close, HL2, HLC3, OHLC4 and ect... You can change long to short in the Input Settings Please, use it only for learning or paper trading. Do not for real trading.

Count:141
Name: MP Rollercoaster Strat
Description: This TMA strategy is called rollercoaster for the rounded ways it follows the moving average. Tried pinpointing entry/exit points as well as I could. Included alertconditions as well as syntax at the bottom for use with Autoview in a margin or spot trading environment. There is also the Study side for syntax and alertconditions use :) (autoview users and...

Count:140
Name: BB+K strategy
Description: Applying Bollinger Bands and K-bar strategies Suitable for long time periods Suitable for forex trading, when the forex deviation is too large, the Fed will intervene and thus correct Strategy: Enter when the price hits the upper or lower BB track and there is a reversal of the strong signal, and exit when it hits the other track and there is a reversal signal.

Count:140
Name: Combo Backtest 123 Reversal & Volatility Finite Volume Elements
Description: This is combo strategies for get a cumulative signal. First strategy This System was created from the Book "How I Tripled My Money In The Futures Market" by Ulf Jensen, Page 183. This is reverse type of strategies. The strategy buys at market, if close price is higher than the previous close during 2 days and the meaning of 9-days Stochastic Slow...

Count:140
Name: RSI with Slow and Fast MA Crossing Strategy (by Coinrule)
Description: This strategy utilises 3 different conditions that have to be met to buy and 1 condition to sell. This strategy works best on the ETH/USDT pair on the 4-hour timescale. In order for the strategy to enter the trade, it must meet all of the conditions listed below: ENTRY RSI increases by 5 RSI is lower than 70 MA9 crosses above MA50 To exit a trade, the below...

Count:140
Name: Active trader turtle trading modified version
Description: Modified the script from from turtle trader to only long when high break 55 days high and sell when low break 20 days low

Count:140
Name: VWMA + SMA BBollinger + RSI Strategy (ChartArt) mod by BiO618
Description: This is a script I remade from the original ChartArt's "CA_RSI_Bolling_Strat". I added a VWMA following the SMA basis curve. BBand was made with the SMA curve, +2DS. The point of adding VWMA to the script is to get a fast correlation between price change and volume change. How to interpret it: Since 3-Intervals-VWMA = (P1*V1 + P2*V2 + P3*V3) / (V1+V2+V3) As the...

Count:140
Name: OBV EMA X BF 🚀
Description: Credit to Lancelot_Augur for the idea of EMAs of On Balance Volume. The signals are generated when the faster OBV EMA crosses the slower one. BACKGROUND COLORS: Green = go long Red = go short White = you have been stopped out This strategy uses a 3% stop loss.


Count:140
Name: Bollinger Band Strategy (Basic) Version 1
Description: This strategy is for learning purposes only. Pay special attention to these strategies on longer aggregation periods (like 1 hr chart or more). Don't expect accurate results when you set a limit to 10 cents above your entry to be accurate. For example if you set the chart to 1 day, the price may move down and hit a stop 10 times then tag your limit. If this...

Count:140
Name: Heikin Ashi Strategy - v3- 15 mins TF
Description: Modified Script with high success rate

Count:140
Name: CMO (Chande Momentum Oscillator) Strategy Backtest
Description: This indicator plots Chande Momentum Oscillator. This indicator was developed by Tushar Chande. A scientist, an inventor, and a respected trading system developer, Mr. Chande developed the CMO to capture what he calls "pure momentum". For more definitive information on the CMO and other indicators we recommend the book The New Technical...

Count:139
Name: Ichimoku Cloud with ADX (By Coinrule)
Description: The Ichimoku Cloud is a collection of technical indicators that show support and resistance levels, as well as momentum and trend direction. It does this by taking multiple averages and plotting them on a chart. It also uses these figures to compute a “cloud” that attempts to forecast where the price may find support or resistance in the future. The Ichimoku...

Count:139
Name: HOWTO Plot Entry Price
Description: Hi! It's just an answer to question from one TV user: "How can I store the price at which I enter the long or short position, so that I can use it later to calculate a percentage based exit strategy. " Hope this would help!

Count:139
Name: Noro's Trend MAs Strategy v1.7
Description: Trade strategy which uses only 2 MA. The slow MA (blue) is used for definition of a trend The fast MA (red) is used for an entrance to the transaction For: - For H1 - For crypto/fiat Recomended: Long = true (if it is profitable as a result of backtests) Short = true (if it is profitable as a result of backtests) Stops = false Stop, % = any Type of...

Count:139
Name: Noro's Fast RSI Strategy v1.1
Description: For: - crypto/fiat - crypto/crypto - timeframes: 1hour, 30min, 15min, 5min Strategy uses 2 indicators: 1) RSI indicator, period = 7 (default) 2) EMA Body, period = 30 EMA Body Step 1. The candle body size is calculated = abs(close-open) Step 2. The average size of a body of a candle is calculated. Only 30 last candles. EMA . Step 3. If the body of...

Count:139
Name: Backtest Custom HiLo Strategy
Description: This script implements the HiLo trend follower strategy for backtesting the HiLo indicator. It comes with some custom options. Among them is the Type option that allows to choose between the moving averages for the highs and lows (HiLo), or highest and lowest values for those moving averages, respectively (HiLo Activator).

Count:139
Name: Donchian Channels Strategy - Long Term Trend
Description: For Educational Purposes. Results can differ on different markets and can fail at any time. Profit is not guaranteed. This only works in a few markets and in certain situations. Changing the settings can give better or worse results for other markets. This is a longer term trend following strategy that uses Donchian Channels for trend following and uses the upper...

Count:139
Name: Line Regression Intercept Backtest
Description: Linear Regression Intercept is one of the indicators calculated by using the Linear Regression technique. Linear regression indicates the value of the Y (generally the price) when the value of X (the time series) is 0. Linear Regression Intercept is used along with the Linear Regression Slope to create the Linear Regression Line. The Linear Regression...

Count:139
Name: Gui's Turtle or The everythings Script
Description: This script has a lot of stuff. Its cool.

Count:139
Name: Risk Management and Positionsize - MACD example
Description: Mastering Risk Management Risk management is the cornerstone of successful trading, and it's often the difference between turning a profit and suffering a loss. In light of its importance, I share a risk management tool which you can use for your trading strategies. The script not only assists in position sizing but also comes with built-in technical features...

Count:138
Name: WMX Keltner Channels strategy
Description: A simple Keltner Channels strategy For any suggestions about this strategy, please leave your comment below.

Count:138
Name: Donchian Channels Trending Breakout Strategy
Description: This script looks for two entry signals. Long is when the previous breakout of the donchian channels was a low, price is above the input EMA, current price is equal or higher than the upper band and we're not in a position yet. Short is the other way around, so previous breakout of the donchian channels was a high, price is below the input EMA, current price is...

Count:138
Name: Combo Backtest 123 Reversal & Future Lines of Demarcation
Description: This is combo strategies for get a cumulative signal. First strategy This System was created from the Book "How I Tripled My Money In The Futures Market" by Ulf Jensen, Page 183. This is reverse type of strategies. The strategy buys at market, if close price is higher than the previous close during 2 days and the meaning of 9-days Stochastic Slow...

Count:138
Name: HiLo
Description: Hi everyone. This is my first strategy ever. So, I'm having a trouble with the exits and was wondering if anyone could help me out. The error says that the order's limit was reached. Doesn't matter if I back test it just for one day. Any ideas on what's going on?

Count:138
Name: Kase Dev Stops Backtest
Description: The Kase Dev Stops system finds the optimal statistical balance between letting profits run, while cutting losses. Kase DevStop seeks an ideal stop level by accounting for volatility (risk), the variance in volatility (the change in volatility from bar to bar), and volatility skew (the propensity for volatility to occasionally spike incorrectly). ...

Count:138
Name: MCI and VCI - Modified CCI Formulas
Description: For private peeps only - Takes a modified version of the CCI formula into 2 parts VCI - Volume Channel Index (Yellow Histogram) - Measures accurate accumulation and distribution levels and times MCI - Modified Channel Index - Measures (when compared to VCI) levels where clearly buys are interested vs not interested. Example: If VCI > MCI - Shows buyer's are...

Count:138
Name: Basic SMA 200 Strategy
Description: The SMA 200 basic strategy will be more than familiar to most traders. This strategy is to stay with the programming language so to say the "Hello World" of trading. The SMA 200 basic strategy is also one of the simplest strategies in trading. All that is required is the price and a 200 period moving average. Usually the strategy is used in the daily chart....

Count:138
Name: Aroon Oscillator strategy by Saucius
Description: This strategy suits better for stock, indexes and commodities sufficiently volatile but with not so strong trend, where perspective of future quotations are not so certain. For these financial instruments this system works better than others based on classical trend oscillator (like Supertrend) This strategy starts from the idea of the creator of Aroon lines,...

Count:138
Name: Noro's Fast RSI Strategy v1.5
Description: In 1.5: Profit became bigger For: - crypto/fiat - crypto/crypto - timeframes: 1hour, 45min, 30min, 15min, 5min

Count:138
Name: [D] Dudu 95 Strategy Template ver.1.1.
Description: Hello Guys! Nice to meet you all! This is my Second script after changing My Profile Name! I updated my strategy template before - I added some filter conditions (EMA, ADX, DMI). If there's something to update, I will update this script! Thank you! ----- I made this based on the open source strategies by jason5480, kevinmck100, myncrypto. Thank you All! ###...


Count:137
Name: Linear Regression Curve CrossOver Strategy
Description: The worst way of the using Linear Regression

Count:137
Name: Cloud Breakout BF
Description: Based on code by nathanhoffer Long signal is after a close above Kumo cloud, short signal after close below it. You can adjust stuff in the settings.

Count:137
Name: EMA_TREND_CATCHER
Description: Simple strategy based on the crossing of moving averages of 50,100 and 200 periods. Designed to identify trends You are ready to use trading bots (all you have to do is fill in "Variables for Alert"). However, it can also be used for discretionary operations. BTCUSDT FUTURES BINANCE 4H

Count:137
Name: Short In Downtrend Below MA100 (Coinrule)
Description: This is a simple strategy to take advantage of downtrends. It's useful to run such a strategy as a hedge in times of market uncertainty. The Sell Condition - Entry The sell signal triggers when: the coin has MA (100) greater than the price in a timeframe of 15 minutes, meaning that the coin is in a short-term downtrend. the coin has an RSI greater than...

Count:137
Name: stoch pop and RSI2 strategy
Description: I have combined stochsatic POP and RSI2 strategy. Go Long on stochstaic > 80 and RSI2 pulled back to 30 (note when you are entering Long, check that stochsatic is still above 80 ) Close Long when stochastic crossing down 55 I have back tested this on SPY weekly. It has less trades but high profitable with very less draw down. Other time frames you have...

Count:136
Name: Refined CandleCounter Strategy
Description: A while ago I published a Candle Counter strategy that got quite some attention. Unfortunately it didn't work for all charts for some reason, so I decided to rewrite it. The result is, to me, astonishing. Judge for yourselves!

Count:136
Name: Crypto MultiTrend multi timeframes
Description: Hello, today I bring you another crypto strategy which can work with multiple timeframes and most of crypto currencies Its made entirelly of multiple EMA , of different lengths : like super fast, fast, normal, slow and very slow We also combine a little bit of price action together with the trend direction both for entry and for exits, to have a more precise...

Count:136
Name: Pair Trade
Description: Pair trade with inputs: * length of correlation and moving average * trade pair * spread threshold to enter long / short * spread threshold to exit long / short

Count:136
Name: GoldenCross Strategy by Clefsphere
Description: Golden cross when 50SMA crosses 200SMA. Can be used for any market. Day time frame is ideal.

Count:136
Name: Combo Backtest 123 Reversal & CMOfilt
Description: This is combo strategies for get a cumulative signal. First strategy This System was created from the Book "How I Tripled My Money In The Futures Market" by Ulf Jensen, Page 183. This is reverse type of strategies. The strategy buys at market, if close price is higher than the previous close during 2 days and the meaning of 9-days Stochastic Slow...

Count:136
Name: ADX Strategy
Description: Here's a great strategy that works well on the Bitcoin charts.

Count:136
Name: Pure Stochastic long only
Description: Just a stochastic for giving you a smart and quick signals of entering and exiting. Your enter is K>D in the low band and close > last bar's high. An Ema has been added for targeting and stops. You exit also in case of high values of K or in case D crosses over K but in the "upper". Length, periods and level of bands are personalized. The system goes long only,...

Count:135
Name: Compound strategy
Description: In this strategy, I looked at how to manage the crypto I bought. Once we have a little understanding of how cryptocurrency is valued, we can manage the coins we have. For example, the most valuable coin in a coin is to sell when it is overvalued and re-buy when it is undervalued. Furthermore, I realised that buying from the right place and selling at the right...

Count:135
Name: Volume ValueWhen Velocity
Description: Title: Volume ValueWhen Velocity Trading Strategy ▶ Introduction: The " Volume ValueWhen Velocity " trading strategy is designed to generate long position signals based on various technical conditions, including volume thresholds, RSI (Relative Strength Index), and price action relative to the Simple Moving Average (SMA). The strategy aims to identify...

Count:135
Name: MACD,RSI & EMA strategy with MA+PSAR by MAM
Description: MACD,RSI & EMA strategy with MA+PSAR Buy strategy - MACD above signal - RSI above RSI signal - Close price above EMA Sell Strategy - MACD below signal - RSI below RSI signal - Close price below EMA

Count:135
Name: Best strategy for TradingView (fake)
Description: Hello everyone! I want to show you this strategy so you don't fall for the tricks of scammers. On TradingView, you can write an algorithm (probably more than one) that will show any profit you want: from 1% to 100,000% in one year (maybe more)! This can be done, for example, using the built-in linebreak () function and several conditions for opening long and...

Count:135
Name: MavXtrender
Description: Converted the B-Xtrender script from Puppytherapy into a strategy script. B-Xtrender was created by Bharat Jhunjhunwal and published in this IFTA Journal . I've added the following features: Ability to use factors instead of individual values for each parameter. This will allow you to quickly check different averages (5 vs 7 for example). Defaults...

Count:135
Name: EMA50Diff & MACD Strategy
Description: One of my attempts to create a strategy for BTC. Its a combination of EMA50Diff (the difference between spot and EMA50) and MACD. Buy signal if (EMA50Diff) < -(EMADiffThreshold), (MACD bearish crossunder), (MACD) < -(MACDThreshold), (EMA50Diff) > (EMA50Diff 1 candle ago), (EMA50Diff 1 candle ago) <...

Count:135
Name: Trend Balance Point System by Welles Wilder
Description: This is the original Trend Balance Point System created by Welles Wilders in 1978, rules can be found in his book New Concepts in Technical Trading Systems.

Count:135
Name: Larry Williams 3 Period EMAs strategy
Description: Larry R. Williams explains this strategy in his book "Long-Term secrets to Short-Term trading", it consists of using two 3-period EMAs, one representing the Highs and the other the Lows. When the price falls below the 3-period Lows EMA we have a long signal. The trade is closed when the price closes above the 3-period Highs EMA . BINANCE:BTCUSDT

Count:134
Name: Ichimoku Kinko Hyo Strategy
Description: Strategy based on the Ishimoku Kinko Hyo system, using the different indicators it provides to build signals. This strategy could be better as it should ideally use the position of the price line compared to Chikou to determine if signals should be looked for, but I've been unable to fully implement this so far (an imperfect implementation is provided, but...

Count:134
Name: [RS]Khizon (DWTI) Strategy V0
Description: Request for Khizon01: corrected a issue with the default stoch rsi settings (14 smoothing when it should be 3), can always change back since the 14 settings were better performing at the current chart. added option to just open buy trades or sell trades separately and close were previously swing trade occur. added plot titles.

Count:134
Name: Fisher Transform Multi-Timeframe (Backtest)
Description: This is the Backtest Strategy for mortdiggiddy's "Fisher Transform Multi-Timeframe" For more details check his study:

Count:134
Name: Dual MACD Strategy
Description: This strategy Multi Time Frame Macd Indicator We take the first long position when we have a buy signal in Weekly Macd (Macd line crosses above Signal line). This open a trading window, showed with green background color We close the first position when either Weekly or Daily Macd give us a sell signal ((Macd line crosses below Signal line)) Enable Profit and...

Count:134
Name: Coin Flipper Pro with strategy tester
Description: Converted the script "Coin Flipper Pro" into a Strategy. The same random "Coin Flip" trading fun with new features. Now users can run back test on the random trades and see how adjusting the risk to reward ratio affects the over all win rate and the profit of each trade. The Back test can be enabled or disabled in the settings along with the option to choose...

Count:134
Name: CCI Level Zero Strategy (by Marcoweb) v1.0
Description: Hi guys, My strategy is ready :) Finally the zero level of the CCI gives the start and stop to my positions. As you could notice, setting up the CCI length to 340 area on 1 minute chart will let the profit factor go up to 20% from an already wonderful 16%. This is a great result cause will let profitable trades run while stopping the wrong ones with a very...

Count:134
Name: Parabolic SAR along with Heiken ashi Open strategy and EMA move
Description: Parabolic SAR along with Heiken ashi Open strategy and EMA move

Count:134
Name: RSI Strategy
Description: Simple way how to use RSI and MA indicators for trading. What we use: • RSI • SMA calculated by RSI (title: SMA_RSI) • Delta of RSI and SMA_RSI (title: delta) • SMA calculated by delta of RSI and SMA & RSI (title: SMA_RSI2) Logic: Upon the fact that we use the difference between two indicators that have similar values ( RSI and SMA_RSI), we get number...

Count:134
Name: SPX Scalping Strategy
Description: This strategy points out good entries and exits to go with the direction of SPY Used with: Ticker: SPX 500 USD Heiken Ashi Candles 1, 3, 5 min timeframe

Count:134
Name: Internal Bar Strength Indicator
Description: The internal bar strength or (IBS) is an oscillating indicator which measures the relative position of the close price with respect to the low to high range for the same period.

Count:134
Name: VWAP Bands Backtest
Description: This is a backtest for evaluating the profitability of a vwap offsets strategy over time. I took part of the code to create the script from Noro So there is a link for its code

Count:134
Name: [Strategy] CCI EMA scalping [DEV]
Description: Recommended timeframe: 5M or higher Based on EMA crosses and CCI levels. Take profit can be also at Pivot levels like Daily/Weekly Stop loss should be between 12-15 pips. This strategy is still under development!

Count:134
Name: EMA Stoch Strategy For ProfitView
Description: This strategy will enter positions when the set stochastic conditions are met, and uses the moving average to filter the direction of the trades (long/short). The background is used to illustrate the strength of the stochastic values. The following is a step by step guide in order to automate the trading of the strategy with ProfitView: In the indicator...

Count:134
Name: Intraday Grid trading example
Description: Hello everyone, This was a grid trading example for intraday trading. Please be advised that every commodity have diferent kind of reaction and rate of change between periods therefore the percentages need to be adjusted acording to the commodities change %. In order to specify the adjustment rate we add the Zig Zag in the script. For Example ; Last 3 days zigzag...

Count:133
Name: Combo Backtest 123 Reversal & Elder Ray (Bull Power)
Description: This is combo strategies for get a cumulative signal. First strategy This System was created from the Book "How I Tripled My Money In The Futures Market" by Ulf Jensen, Page 183. This is reverse type of strategies. The strategy buys at market, if close price is higher than the previous close during 2 days and the meaning of 9-days Stochastic Slow...

Count:133
Name: Swing Hull/SonicR/EMA/Linear Regression Strategy
Description: A Swing trading strategy that use a combination of indicators, linear regression for target, hull for overall direction, sonicR for entering the martket!

Count:133
Name: 4H CCI Strategy 1.3
Description: Still working on fixing the code 100%. Will update with a new version soon. This one's fine tuned for gold (tp and sl size, and contract size for a 100k account) Cheers, Ivan Labrie Time at Mode FX

Count:133
Name: Moving Average Band - Taylor V1
Description: A Very Simple Strategy From Moving Average - Price Breakout Upper Band = Long - Price Breakout Lower Band = Short Moving Average Type = Able to Change RMA, EMA, SMA, WMA Moving Average Period = Able to Change Upper Band & Lower Band Gap = Able to Change With Stop Lose & Take Profit = Able to Change

Count:133
Name: Good Mode RSI v2
Description: ► Description: "Good Mode RSI v2" is a powerful trading strategy designed to provide informed trading decisions. This script utilizes the popular RSI (Relative Strength Index) indicator to identify potential buying and selling opportunities in the market. It goes beyond the traditional use of RSI by incorporating carefully selected parameters to enhance its...

Count:133
Name: MACD Strategy With Histogram
Description: Combines MACD strategy for backtesting with a plotted histogram and orders

Count:132
Name: EMA Strategy
Description: This is a simple EMA cross strategy. This script was published by CaptJava. I added in the ability to check off a box and allow shorting, the ability to select a back testing date range and also the ability to enter the buy message and sell message in the properties. You then create the webhook alert and put only this in the...

Count:132
Name: [fpemehd] Strategy Template
Description: Hello Guys! Nice to meet you all! This is my fourth script! This is the Strategy Template for traders who wants to make their own strategy. I made this based on the open source strategies by jason5480, kevinmck100, myncrypto. Thank you All! ### StopLoss 1. Can Choose Stop Loss Type: Percent, ATR, Previous Low / High. 2. Can Chosse inputs of each Stop Loss...

Count:132
Name: Combo 2/20 EMA & ADXR
Description: This is combo strategies for get a cumulative signal. First strategy This indicator plots 2/20 exponential moving average. For the Mov Avg X 2/20 Indicator, the EMA bar will be painted when the Alert criteria is met. Second strategy The Average Directional Movement Index Rating (ADXR) measures the strength of the Average Directional Movement Index...

Count:132
Name: RSI cyclic smoothed strategy backtest
Description: I added a few lines of code to "when to trade"'s code to see that backtest result of "RSI cyclic smoothed v2".

Count:132
Name: MAPM-V1
Description: Greetings dear traders! I would like to introduce you the script for testing the strategy by crossing two signal EMAs based on the MACD indicator. In the strategy itself: The entry is made as a percentage of the deposit by EMA crossings. There are additional purchases, they are set from the entry price for a given percentage in the opposite direction of the...

Count:132
Name: Buy Dip MA & PSAR
Description: This is my first script. Please don't use because I was just testing.

Count:132
Name: Revised Tony's EMA Scalper - Long/short
Description: Did this to help @rj007 in the Tradingview Chat

Count:132
Name: ADX + BB %B + AO + EMA [Luca Massuda]
Description: This trading strategy combines different indicators: 1) ADX, Average Directional Movement: to spot the trend 2) BB %B Bollinger Band %B: to spost relative price position to Bollinger Bands 3) AO Awesome Oscillator: to spot momentum 4) ema 5,ema21, ema50, ema200: to decide long or short position You can configure: Take profit % : at which % gains to take profit...

Count:131
Name: VB Strategy
Description: VB Indicator VB Indicator PRO (with Alarm function) With this strategy, you can test VB indicator. This strategy use entry and close price entry price = (high price + low price) / 2 close price = (high price + low price) / 2 이 전략으로 VB 지표에 대해 테스트할 수 있습니다. 이 전략의 진입가와 청산가는 아래와 같이 설정합니다. 진입가 = (고점+저점) / 2 청산가 = (고점+저점) / 2

Count:131
Name: ADX + RSI Strat
Description: // This is a strategy that uses the 7 Period RSI to buy when the indicator is shown as oversold (OS) and sells when // the index marks overbought (OB). It also uses the ADX to determine whether the trend is ranging or trending // and filters out the trending trades. Seems to work better for automated trading when the logic is inversed (buying OB // and selling...

Count:131
Name: Noro's Bollinger Strategy v1.1
Description: Bollinger Bands Pyramiding!!! For: - any crypto - timeframe: 1min, 3min, 5min, 15min, 30min, 1h


Count:130
Name: TASC 2022.08 Trading The Fear Index
Description: █ OVERVIEW TASC's August 2022 edition of Traders' Tips includes an article by Markos Katsanos titled "Trading The Fear Index". This script implements a trading strategy called the “daily long/short trading system for volatility ETFs” presented in this article. █ CONCEPTS This long-term strategy aims to capitalize on stock market volatility by using ...

Count:130
Name: 3 HULLs & ICHIMOKU divided by PRICE
Description: Basically just another form of moving average, for quick swings, built for testing/use with API cryptobots, simple switch from buy to sell. Hull MA(2 candles back) times 3 plus Ichimoku divided by price(1 candle back) = value1 Hull MA(3 candles back) times 3 plus Ichimoku divided by price(1 candle back) = value2 if value1>value2 then buy else sell calculates...

Count:130
Name: Awesome Oscillator.MMouse_Lager_BCE
Description: Awesome Oscillator with added options for turning short trades on and off, as well as a start date for backtesting.

Count:130
Name: inside bar strategy Wıth SL-TP
Description: Based on strat bars to enter trades, you can use it with very low stop loss level and try all coins in daily frequency

Count:130
Name: London Breakout/Session GBP/USD Forex Daytrade
Description: This is a forex strategy suited for day traders, specialized in the london breakout session The key elements for this strategy are the specific london time session, together with an exit time(before asian trade/at the end of new york session). At the same time, as logic elements we only use price action inside like : For long we have 3 ascending candles, and...

Count:130
Name: Variable Moving Average Strategy
Description: Strategy based on Variable Moving Average

Count:130
Name: My five in one strategy for ETHUSD 700x v4 //smooth code
Description: I have developed a script that uses the Aroon indicator, volume, Macd, momentum, and Puel Manuel. Every time you load a script, you have already preset inputs in the comments of the close. Suppose you want to find new ones. You use PM inputs to determine where the bottom and top are, so you do not sell there. You use volatility swaps to determine how volume is...

Count:130
Name: Strategy Template + Performance & Returns table + Extras
Description: A script I've been working on since summer 2022. A template for any strategy so you just have to write or paste the code and go straight into risk management settings Features: >Signal only Longs/only Shorts/Both >Leverage system >Proper fees calculation (even with leverage on) >Different Stop Loss systems: Simple percentage, 4 different "move to Break Even"...

Count:130
Name: CMF - WaveTrend
Description: CMF - WaveTrend - Best performance on a 15-minute timeframe.

Count:130
Name: Market Facilitation Index (MFI) Backtest
Description: The Market Facilitation Index is an indicator that relates price range to volume and measures the efficency of price movement. Use the indicator to determine if the market is trending. If the Market Facilitation Index increased, then the market is facilitating trade and is more efficient, implying that the market is trending. If the Market Facilitation...

Count:130
Name: 4X EMA and volume strategy
Description: This is a strategy made from multiple types of EMA and volume(EOM). This is a long only strategy. EMA 1 = 13 EMA 2 = 21 EMA 3 = 50 EMA 4 = 180 In this case we have 2 options for entry: 1.We check that are candles are in ascending order and EOM is above 0 - > long, descending and eom<0 -> exit long 2.We check if we have a crossover between the first ema with...

Count:130
Name: Altered OBV On MACD
Description: Here is another strategy along with an indicator that is already published for everyone to use wisely in the tradingview platform. The strategy is not very planned to highlight where to enter and when to exit as it is just a system. So, it is always good practice to follow the signal of simple moving averages and that is the reason you could find those color lines...

Count:130
Name: BB%/MFI/RSI
Description: The indicator was made by a bear. I have made strategy which uses this indicator. For any pair.

Count:130
Name: TSI/HullMA/VWMA strategy
Description: change the settings to make it profitable.. default settings not apply to any instrument in-particular.. dont be afraid to try different settings to find profitable combo of settings on your chosen crypto/FX/stock etc.. to avoid repaint wait for next candle before confirm signal..

Count:130
Name: Combo Backtest 123 Reversal & Awesome Oscillator (AC)
Description: This is combo strategies for get a cumulative signal. First strategy This System was created from the Book "How I Tripled My Money In The Futures Market" by Ulf Jensen, Page 183. This is reverse type of strategies. The strategy buys at market, if close price is higher than the previous close during 2 days and the meaning of 9-days Stochastic Slow...

Count:130
Name: CCI + EMA with RSI Cross Strategy
Description: This strategy uses the CCI + 2 RSIs + 2 EMAs to generate trade signals. Trades are only taken during the normal trading session and all open trades are closed 15 min before the close of the current session. A trailing stop loss is used and is customizable. Not trading advice, use at your own risk.

Count:130
Name: eha Moving Averages Strategy
Description: Moving Average based strategies are very popular ones among both long-term investors and short-term traders as they can be tailored to any time frame. One of the main moving average strategies are crossovers. The very simple type is a price crossover , which is when the price crosses above or below a moving average to signal a potential change in...

Count:130
Name: Vortex Indicator Band Strategy
Description: This strategy utilizing the Vortex indicator and its bands is effective when paired with displaced moving averages and a stop loss. Settings can be customized to match the specific ticker.

Count:129
Name: Ichimoku trendfollowing
Description: Ichimoku più che un indicatore potrebbe essere considerato un sistema di trading. Ho quindi voluto implementare una strategia che utilizzasse soltanto i segnali che offre per l'ingresso ed uscita per verificarne l'efficacia nel lungo periodo su i diversi strumenti. I segnali che offre sono i seguenti: 1) il prezzo taglia la tenkan (segnale molto debole per un...

Count:129
Name: MACD MOMENTUM STRATEGY
Description: Hey, First of I'm not so familiar with Pine Editor, yet. But a do need some help with a trick thing I*ve been working on. As you can see I*ve merge the MACD and the MOMENTUM indicators in the same "chart" this have been working pretty well for me as a trading strategy. But now a chat tho create a real strategy with Pine Editor based on the same data. The thing is...

Count:129
Name: Noro's Levels Strategy v1.1
Description: For: - "btc/usd", "eth/usd" - timeframe: 1h, 2h, 3h, 4h - source: close or OHLC4 Strategy From the price of last candle the line is drawn (timeframe are chosen) The same line is drawn from the price of other timeframe If the price is higher than both lines - uptrend If the price is lower than both lines - downtrend

Count:129
Name: Joseph Nemeth Heiken Ashi Renko MTF Strategy
Description: For Educational Purposes. Results can differ on different markets and can fail at any time. Profit is not guaranteed. This only works in a few markets and in certain situations. Changing the settings can give better or worse results for other markets. Nemeth is a forex trader that came up with a multi-time frame heiken ashi based strategy that he showed to an...

Count:129
Name: Simple and efficient 1h strategy
Description: This strategy is made from a crossover of 2 ema : 4 and 8 in this case, together with a RSI of lenght 10 applied to hl2 The strategy is simple : we enter when we have a cross between the 2 ma's and rsi at the same time is in ascending or descending position crossing the middle line of 50. For exit we have : at the end of a session( we trade only between london...

Count:129
Name: MA Simple Strategy with SL & TP & ATR Filters
Description: Hello Guys! Nice to meet you all! This is my second script! This Logic is trend following logic, This detects long & short trends by comparing the value of MAs. This fits to the longer time frame. ### Long Condition 1. Compare 4 MAs (you can chose MA Type) - Shortest MA (MA 1) - Shorter MA (MA 2) - Normal MA (MA 3) - Longer MA (MA 4) 2. If MA 1 > MA 2 > MA 3 > MA...

Count:129
Name: Overbought/Oversold
Description: Simple Overbought/Oversold indicator You can change long to short in the Input Settings WARNING: - For purpose educate only - This script to change bars colors.

Count:128
Name: [STRATEGY][RS]MarxBabu 4 Oscillators V0
Description: EXPERIMENTAL: fixed some mixed signals :p request for MarxBabu.

Count:128
Name: Trailing Buy
Description: This script demonstrates how to do trailing buy. With this approach, given an entry signal, instead of buying directly, you just follow the price downwards (for long positions) and you buy when the price increases by a small percentage. The order will be executed when the next bar is closed. This approach may increase the profits (slightly) in some strategies!...

Count:128
Name: Noro's ColorBar Strategy v1.0
Description: It is calculated what long a candle body Average length of a body of a candle, for the last 30 candles is calculated If the candle red and a body of a candle is more average - to open long (and to close short) If long is open, the candle green and a position is profitable - to close long If the candle green and a body of a candle is more average - to open short...

Count:128
Name: SAR + 3SMMA with SL & TP
Description: This script is a combination of SAR strategy and 3 Smoothed Moving Averages. Strategy: Takes SAR longs when all 3 SMMAs are rising. Take SAR short when all 3 SMMAs are falling. Supports StopLoss and TakeProfit. If you have found a profitable setup for it, please share in the comments or private chat.

Count:128
Name: Super Simple Martingale Buying
Description: A bot that buys below the configured averages and then averages down every few %. The position size is calculated automatically by the maximum open orders you set.

Count:128
Name: 8 Day Run - Momentum Strategy
Description: Inspired by Linda Bradford Raschke. Entry criteria: This strategy is used to capture momentum effects on the daily periodicities. Once prices have had a run of 8 or more consecutive closes above or below the 5-period simple moving average the strategy is primed to trade. It will then enter a short on the first close above the 5sma after a run of 8 or more...

Count:128
Name: Keltner Channel Strategy
Description: Hello Friends, i found here a Keltner Channel Strategy. But this Strategy trades LONG and SHORT. Could some code it to long also. If a sell condtion is true, so no short trades is initiated - only sell se long trade to be flat. is it possible? Thank you so much for your help!

Count:128
Name: Combo Backtest 123 Reversal & DAPD
Description: This is combo strategies for get a cumulative signal. First strategy This System was created from the Book "How I Tripled My Money In The Futures Market" by Ulf Jensen, Page 183. This is reverse type of strategies. The strategy buys at market, if close price is higher than the previous close during 2 days and the meaning of 9-days Stochastic Slow...

Count:128
Name: DiNapoli Detrended Oscillator Strategy Backtest
Description: DiNapoli Detrended Oscillator Strategy You can change long to short in the Input Settings Please, use it only for learning or paper trading. Do not for real trading.

Count:128
Name: Comparative Relative Strength Strategy Backtest
Description: Comparative Relative Strength Strategy for ES You can change long to short in the Input Settings Please, use it only for learning or paper trading. Do not for real trading.

Count:128
Name: EMA Intraday Strategy
Description: Here is a EMA intraday strategy. very profitable on the GBPAUD 1M charts if you are watching very closely, working on coding a indicator for it

Count:128
Name: Fibonacci Zone DCA Strategy - R3c0nTrader
Description: Credits: Thank you "eykpunter" for granting me permission to use "Fibonacci Zones" to create this strategy Thank you "junyou0424" for granting me permission to use "DCA Bot with SuperTrend Emulator" which I used for adding bot inputs, calculations, and strategy Pre-requisites: You can use this script without a 3Commas account and see how 3Commas DCA Bot would...

Count:127
Name: Noro's DD Strategy
Description: If a drawdown is more than 5% - to open long position If a candle is green - to close a long position

Count:127
Name: Wavefinder
Description: I made this script to incorporate Stochastic RSI with EMA crossovers and VMACD, it is only to buy and sell (Users can modify it create shorts) I personally recommend only using this when a downtrend reversal is imminent as it finds the bottom well. Signals generated on a downward moving StochRSI must be ignored. Used best with StochRSI and VMACD...

Count:127
Name: Strategy Moving Average Stop and Reverse alerts
Description: So this is for strategy for the Moving Average Stop and Reverse alerts its seems to be nice , I did not play so much with the TF but one can change settings as he wish my indicator with alerts is I think the results is more due to the condition of the test rather to the model? on the other hand the original model in version 2 (not mine) had similar results ....

Count:127
Name: Noro's Trend SMA Strategy v1.2
Description: Trade strategy which uses only 2 SMA . The slow SMA (blue) is used for definition of a trend The fast SMA (red) is used for an entrance to the transaction Recomended: For H1 For crypto/fiat Fast SMA Period = 5 Slow SMA Period = 30 In the new version 1.2 - profit became more - the risk became less - strategy waits for 2 candles of lonely color

Count:127
Name: Quantitative Trend Strategy- Uptrend long
Description: Trend Strategy #1 Indicators: 1. SMA 2. Pivot high/low functions derived from SMA 3. Step lines to plot support and resistance based on the pivot points 4. If the close is over the resistance line, green arrows plot above, and vice versa for red arrows below support. Strategy: 1. Long Only 2. Mutable 2% TP/1.5% SL 3. 0.01% commission 4. When the close is...

Count:126
Name: PMA Strategy Idea
Description: This strategy idea uses three EMAs on HLC/3 data, know as PMA(Pivot Moving Average). This strategy is very useful in trending instruments on 1W and 1D timeframes. This is the implementation used in QuantCT app. The study version of this idea is published in public library as ACD PMA . You can set operation mode to be Long/Short or long-only. You also can set a...

Count:126
Name: BEAM DCA Strategy Monthly
Description: This strategy is based on BEAM bands for BTC. The space between the original BEAM bands is broken up into 10 bands representing levels of risk for investing fresh capital. The strategy will buy bitcoin when the price is in the bottom 5 bands, increasing the amount investmented as the price approaches the 1400 D SMA. The strategy will limit sell bitcoin when...

Count:126
Name: Dollar cost averaging
Description: This is a testing startergy based on dollar cost averaging and sell on high points.

Count:126
Name: Shadow Trading
Description: This is a very simple script that identify daily candles with big tails and enter the market if the lower or the higher price of the same candle is violated... this is the idea behind I hope you will find it usefull ;)

Count:126
Name: Bollinger bubble | Stock Edition
Description: Bollinger bubble is an edition for market like CAC40, DJ30, .. The market are uptrend with the inflation, this edition only buy (you have less risk then sell) We buy when a candle open & close outside the lower bollingers band and we target the last highest point on the last 10 candles.

Count:126
Name: Combo Strategy 123 Reversal & CCI
Description: This is combo strategies for get a cumulative signal. First strategy This System was created from the Book "How I Tripled My Money In The Futures Market" by Ulf Jensen, Page 183. This is reverse type of strategies. The strategy buys at market, if close price is higher than the previous close during 2 days and the meaning of 9-days Stochastic Slow...

Count:126
Name: EMAC - Exponential Moving Average Cross - Optimized
Description: EMAC - Exponential Moving Average Cross - Optimized This is the full Strategy version with the best currently known optimized inputs with the average best settings across the following 26 tickers: QQQ TQQQ SPY SPXL AAPL AMZN TSLA BYND CRWD DDOG ESTC FSLY MDB NVDA PINS PTON ROKU SHOP SQ TDOC TWLO APPS CHWY DKNG ETSY FVRR For the short Study version of EMAC that...

Count:125
Name: Daily Crypto Strategy
Description: This is a long only strategy. This strategy measures and creates a signal when an asset is moving out of a correlation with CBOE VIX into an inverse correlation. It also has a risk management with TP/SL based on percentages. If you have any questions let me know.

Count:125
Name: Dillon's Double VWAP Strategy
Description: This is based on Dillon's double VWAP strategy. I enters when the ADX is low (aka not a trending market) and it's not close to the VWAP reset. Check it out.

Count:125
Name: Supertrend V1.0 - Buy or Sell Signal
Description: A test of the Supertrend Indicator. If I have made any mischaracterizations and mistakes, please let me know in the comments.

Count:125
Name: [STRATEGY][RS]The Illusion Strategy V0
Description: EXPERIMENTAL: WARNING: this strategy does not work!! one of the fallacy's of backtesting, renko chars signals usually will give signals when price is allready out of range.

Count:125
Name: A.I.Driven TradersAI Model Trades for 20190612
Description: The entry and exit levels here are NOT derived from any specific indicator but are coming from our A.I. driven proprietary models. This is an attempt at exploring the trading community here at TradingView and sharing our daily trading plans published at our site with the community here in the form a Pine Script - just starting and learning this platform. Please...

Count:125
Name: Noro's FRSI Strategy v1.21
Description: Little changed Noro's Fast RSI Strategy v1.2 for using with Noro's FRSI Indicator v1.21 for AutoView

Count:125
Name: The strategy example. Close position by timeout
Description: This is an example how to close open entries by timeout for educational purpose.

Count:125
Name: Open High Low Strategy
Description: This is a very simple, yet effective and to some extend widely followed scalping strategy to capture the underling sentiments of the counter whether it will go up or down. What is it? This is Open-High-Low (OLH) strategy. As you already aware of Candlestick patterns, there is patterns called as Marubozu patterns where the sell wick or buy wick either ceases...

Count:125
Name: Noro's Candles Strategy v1.0
Description: If there were 2 red candles in a row - to open positions If there were 2 green candles in a row - to open a position At emergence of a candle of opposite color - to close a position Bars Q - the required quantity of candles of identical color

Count:125
Name: Price X MA Cross
Description: Indicates long or short positions based on the crossing of price with a moving average. Different moving average types are available. There is a tolerance parameter to filter out false breakouts.

Count:125
Name: Rule Number 1 Signals
Description: This script takes the Rule #1 3 tools and plots them on the graph, to provide an additional level of indication for when to sell and when to buy.

Count:125
Name: scalping with market facilitation
Description: This strategy is for scalping low timeframes for 10 pips. I have yet to see a strategy with this unique combo of indicators. First we have volume indicator market facilitation, where we are looking for volume and mfi to be up, then we want the adx 5 to be above level 30 and above its ema period 3, then if these conditions are good we take shorts when ema 8 is...

Count:125
Name: Fair Value Strategy - ekmll
Description: This is a strategy using SPX's Fair Value derived from Net Liquidity. The main difference between this one and calebsandfort's one is net liquidity values in this one are calculated in TradingView and doesn't need author's daily library updates to function. Net Liquidity function is simply: Fed Balance Sheet - Treasury General Account - Reverse Repo...


Count:124
Name: Buy From All Time High
Description: This strategy buys at a set percentage below the all time high and sells at the previous all time high.

Count:124
Name: Short Swing Bearish MACD Cross (By Coinrule)
Description: This strategy is oriented towards shorting during downside moves, whilst ensuring the asset is trading in a higher timeframe downtrend, and exiting after further downside. This script can work well on coins you are planning to hodl for long-term and works especially well whilst using an automated bot that can execute your trades for you. It allows you to hedge...

Count:124
Name: R3 ETF Strategy
Description: This strategy is a modification of the “R3 Strategy” from the book "High Probability ETF Trading" by Larry Connors and Cesar Alvarez. This RSI strategy is for a 1-day time-frame and has these 3 simple rules: Criteria: The price must be above the 200 day moving average. The 2-period (day) RSI drops 3 days in a row. The 2-period RSI must have been below 60 3...

Count:124
Name: Combo Strategies 123 Reversal and 3-Bar-Reversal-Pattern
Description: This is combo strategies for get a cumulative signal. Result signal will return 1 if two strategies is long, -1 if all strategies is short and 0 if signals of strategies is not equal. First strategy This System was created from the Book "How I Tripled My Money In The Futures Market" by Ulf Jensen, Page 183. This is reverse type of strategies. The...

Count:124
Name: John F. Ehlers Center Of Gravity Balanced by [DM]
Description: Greetings to all colleagues. I share this indicator turned into a strategy, (this is one of my first strategies so some inputs are missing and others are somewhat archaic) this cog is formed by three signals which can be reduced by dividing by phi Available settings: Length setting for signal Trigger parameter setting for strategy stoploss settings ...

Count:124
Name: Aphrodite
Description: // v4 // continuation of prime number checker with strat commands and normal distribution theory put in //pump/dump trend following strategy idea added. //Pseudo Random Number Generator Box Muller Normal Distribution Method - code from Function - Functions to generate Random values by RicardoSantos. Dots are calculated by an adaptation of the ideas //in this...

Count:124
Name: Full Swing Gold Vwap Macd SMO Strategy
Description: This is a full strategy designed for gold market using 12h timeframe chart. Its components are: VWAP monthly SMO oscillator MACD histogram Rules for entry: For long: when enter when close of the candle is above vwap monthly, current histogram is higher than the previous one and SMO oscillator is above 0 For long: when enter when close of the candle is below...

Count:124
Name: Candle checker for long/short for scalping/day trading
Description: Hey. This strategy is still in working. For it I check a x amount of candles in the past if they been for example all red/green in row, and based on that I enter. For example candle 7 < candle 6 .... candle 3 < candle 2 .... candle 1 < candle current for long and viceversa for short. After that,once the trade is initiated, I exit based on 2 possibilities :...

Count:124
Name: Daily Investments Index Scalp
Description: This strategy is based on the DIDI index with our own confirmations and calculated SL/TP . You can change every setting if you want it to use for another pair, but this is fine tuned for NATURALGAS The entries are taken when: Long: - Buy signal from the DIDI indicator - Long EMA is underneath the Short EMA - Price must be Above the Long EMA - TP1 (default) -...

Count:124
Name: Strong Potential Asset Strategy (EMA + EMA)
Description: During experiments with the market, I found out that simple strategy is the best solution. However, I decided to bring some of my ideas on the 2 MA strategy. - Instead of SMA - there will be 2 EMA, so the strategy will be more sensitive to the latest data; - There is an option, which regulates the difference between those 2 EMAs, this should protect us from false...

Count:124
Name: scalping low lag tema etal
Description: Credit for original idea goes to 1 min forex scalping by mikegoryunov Changes include several lower lag filters (See line 3 for a list) and values for profit, loss, and trail_points (See lines 48:53) a, b, & c represent fast, medium, and slow filters. Basic idea is to monitor crossovers of the three filters to determine buy/sells. Exits occur quickly...

Count:124
Name: Bottom catch strategy
Description: This script is a strategy to buy on the basis of a short-term bottom on a prominent volume in a downtrend. The logic is very simple. Volume is above +2σ. RSI indicates oversold conditions. When the above conditions are met, the current location is judged to be a short-term bottom and the price is...

Count:124
Name: Trading Public School ST1
Description: This is a derivative of Trading Public School "TTM Squeeze" volatility indicator, as discussed in his book "Mastering the Trade" (chapter 11). Black crosses on the midline show that the market just entered a squeeze ( Bollinger Bands are with in Keltner Channel). This signifies low volatility , market preparing itself for an explosive move (up or down). Gray...

Count:124
Name: Cuathro EMA Strategy
Description: It's a long term script based on multiples EMA, crossover and crossunder. Based on two good scripts CM Sling and OCC. Always adjust resolution at least twice than chart. Enjoy it! BTCUSD

Count:124
Name: BTC Short/Long Change Indicator Weighted Calls [BY]
Description: BTC Short/Long Change Indicator Weighted Calls

Count:124
Name: strategy.direction.all() bug - work around
Description: the way to work around the bug for this specific strategy, altho its not as efficient as it would if both orders activation was possible.

Count:124
Name: Logarithmic Moving Average Convergence Divergence Strategy
Description: Strategy based on Logarithmic MACD.

Count:123
Name: Combo Backtest 123 Reversal & Chaikin Volatility
Description: This is combo strategies for get a cumulative signal. First strategy This System was created from the Book "How I Tripled My Money In The Futures Market" by Ulf Jensen, Page 183. This is reverse type of strategies. The strategy buys at market, if close price is higher than the previous close during 2 days and the meaning of 9-days Stochastic Slow...

Count:123
Name: RSI based on ROC Backtest
Description: This is the new-age indicator which is version of RSI calculated upon the Rate-of-change indicator. The name "Relative Strength Index" is slightly misleading as the RSI does not compare the relative strength of two securities, but rather the internal strength of a single security. A more appropriate name might be "Internal Strength Index." Relative...

Count:123
Name: Inferential Statistics And Quick Metrics For Strategy Analysis.
Description: Part of this script is used to calculate inferential statistics and metrics not available through the built in variables in the strategy tester. A label will be created on the last bar displaying important strategy results, so you can test and analyze strategies quicker. The built in strategy itself is just an example. You can copy and paste the metrics into...

Count:123
Name: Chande Forecast Oscillator
Description: The Chande Forecast Oscillator developed by Tushar Chande The Forecast Oscillator plots the percentage difference between the closing price and the n-period linear regression forecasted price. The oscillator is above zero when the forecast price is greater than the closing price and less than zero if it is below.


Count:123
Name: Combo 2/20 EMA & Average True Range Reversed
Description: This is combo strategies for get a cumulative signal. First strategy This indicator plots 2/20 exponential moving average. For the Mov Avg X 2/20 Indicator, the EMA bar will be painted when the Alert criteria is met. Second strategy Average True Range Trailing Stops Strategy, by Sylvain Vervoort The related article is copyrighted material from Stocks &...

Count:123
Name: CS Basic Scripts - Stochastic Special (Strategy)
Description: This Stochastic Special Strategy features inputs for: - Custom Backtesting Date Range - Long and Short Strategy Discinctions - Utilize SMI, RSI, Martingale, and Body-Filter Strategy - Adjust the SMI Percent Lengths and Limit - Automate with the Autoview Trading Bot Strategy script may be tested by favoriting and adding to any chart. Study script is...

Count:123
Name: XBT Weekend Trade Strategy - 10x leverage and pyramid
Description: uses 10x leverage Using Friday's XBT close price do the following: - Go short when price rises above 4.5% - Go long when price falls below 4.5% - Add to long position when price falls another 4.5%, same with short position on the rise - Close all orders when profits reach 10% - Allow stacking up to 2 orders at once - Close all orders start of Monday

Count:123
Name: SARSI Reversal Strategy
Description: Simple reversal strategy based on 'Parabolic Stop and Reverse' and 'Relative Stength Index' indicators.

Count:122
Name: Combo Backtest 123 Reversal & Key Reversal Up
Description: This is combo strategies for get a cumulative signal. First strategy This System was created from the Book "How I Tripled My Money In The Futures Market" by Ulf Jensen, Page 183. This is reverse type of strategies. The strategy buys at market, if close price is higher than the previous close during 2 days and the meaning of 9-days Stochastic Slow...

Count:122
Name: Noro's Price Channel Strategy v1.0
Description: The blue line is the middle of the price channel. If there are 2 red candles in a row and a body of the last candle more than a half of an average body of a candle and a candle was closed over the line - to open long-position If there are 2 green candles in a row and a body of the last candle more than a half of an average body of a candle and a candle was...

Count:122
Name: Noro's Volty Strategy v1.0
Description: It is the strategy of Volty Expan Close. I have added a feature to remove short positions and an opportunity to choose a time interval by dates.

Count:122
Name: VWAP+15EMA with RSI
Description: VWAP+EMA+RSI Strategy for the group MelléCasH This strategy will enter a long position when the closing price is above both the VWAP and the 15 EMA, and the RSI is above the specified overbought level. It will exit the position when the price falls by the specified stop loss percentage, rises by the specified take profit percentage, or when the trailing stop loss...

Count:122
Name: Combo Backtest 123 Reversal & Elder Ray (Bear Power)
Description: This is combo strategies for get a cumulative signal. First strategy This System was created from the Book "How I Tripled My Money In The Futures Market" by Ulf Jensen, Page 183. This is reverse type of strategies. The strategy buys at market, if close price is higher than the previous close during 2 days and the meaning of 9-days Stochastic Slow...

Count:122
Name: DPO RMA STRATEGY
Description: This strategy uses tradingview's built-in "Detrended Price Osciilator" ( DPO )indicator script. It takes the average of 6 different fib lookback periods. (55,89,144,233,377,610) This is plotted in the purple line. It then takes the RMA of the DPO and uses the RMA's to determine entry points with crossovers and crossunders. It's an extremely easy indicator to...

Count:122
Name: Combo Backtest 123 Reversal & Smoothed Williams AD
Description: This is combo strategies for get a cumulative signal. First strategy This System was created from the Book "How I Tripled My Money In The Futures Market" by Ulf Jensen, Page 183. This is reverse type of strategies. The strategy buys at market, if close price is higher than the previous close during 2 days and the meaning of 9-days Stochastic Slow...

Count:122
Name: Noro's Color Strategy v1.0
Description: Strategy which doesn't look at the prices. This strategy is guided only by color of candles.

Count:122
Name: Buy and hold calculator
Description: This is a simple buy and hold calculator. You have an initial date and once that dated it passed it will sell the product that was bought initially. This strategy buys and sell 100% of the initial volume.

Count:122
Name: Ehlers Bandpass Filter
Description: This script uses @cheatcountry script to determine Ehlers Bandpass Filter. Backtest offers 3 capital management tools. One that will always calculate order size as initial capital/close, one that uses the same calculation but adds or substracts profit. The last one allows you to enter manually the size you want to trade. The time-based stop will close the...

Count:122
Name: Momentum Strategy
Description: This is a momentum indicator strategy that plots 2 lines on the momentum indicator and if both cross above zero a long entry is generated and if both cross below zero a short entry is generated. It also has code to check and make sure the condition is still true when launching the official alert, which helps back testing and live results line up, however be sure...

Count:122
Name: Noro's Bollinger Strategy v1.3
Description: Bollinger Bands Pyramiding!!! For: - any crypto - timeframe: 1min, 3min, 5min, 15min, 30min, 1h

Count:122
Name: BTC Short/Long Change Strategy [Baydemir]
Description: BTC Short/Long Change Strategy

Count:122
Name: Bandpass Filter Strategy ver 2.0
Description: The related article is copyrighted material from Stocks & Commodities Mar 2010 You can use in the xPrice any series: Open, High, Low, Close, HL2, HLC3, OHLC4 and ect... You can change long to short in the Input Settings WARNING: - For purpose educate only - This script to change bars colors.

Count:122
Name: [Maclen] Money Flow Strategy
Description: This is a strategy based on a smoothed overbought and oversold indicator of money flow. It was design on BTCUSDT Perpetual Futures of Binance with a timeframe of 1D. Feel free to comment and publish any idea to improve this strategy.

Count:121
Name: Price Action Trading Strategy
Description: In this strategy, we define the high and low of the previous candle, and then check whether the current candle's high or low is higher or lower than the previous candle's high or low, respectively. If there's a new high, we enter a long position, and if there's a new low, we enter a short position. We also set exit conditions to close the position if the price...

Count:121
Name: B.Bands | Augmented | Intra-range | Long-Only
Description: Here you have the essential trading engine based on Bollinger Bands . The idea behind is to trade the intra-range of the bands. How is going to work? Define which Bollinger Bands we want to use. Classic Bollinger Bands or Augmented Bollinger Bands . Without selecting, the algorithm doesn't show a strategy. Define the length of the Moving Average and the...

Count:121
Name: Trailing Stop Snippet
Description: This is an example snippet that should allow for adding a trailing stop and trailing stop activation to almost any script. You can use it by setting a trailing stop alone. This will provide you standard trailing stop functionality allowing you to lock in profits and increase your stop-loss as the price moves in your direction. You can also set the trailing stop...

Count:121
Name: MACD 50x Leveraged Short Strategy with Real Equity
Description: Hello there , Short version of the Macd Long strategy. MACD Long strategy: Adding margin: Forbidden or not specified. (Add Margin : No) Position size: (for each trade) 1% Stop-Loss: (2% Above Entry Level) Long: macd crossunder Exit: macd crossover Or ofc touching the stop-Loss value as predicted. These strategies are just examples. The...

Count:121
Name: Combo Backtest 123 Reversal & CMOabs
Description: This is combo strategies for get a cumulative signal. First strategy This System was created from the Book "How I Tripled My Money In The Futures Market" by Ulf Jensen, Page 183. This is reverse type of strategies. The strategy buys at market, if close price is higher than the previous close during 2 days and the meaning of 9-days Stochastic Slow...

Count:121
Name: ELIA MULTI INDICATORS STRATEGY
Description: Experimental multi indicators strategy, to catch right entry and avoid noise. Each indicator included in the strategy, assume a value based on its status and because is a trend-follow strategy, some indicator value are higher then the other Backtested on ETHUSDTPERP BINANCE:ETHUSDTPERP

Count:121
Name: Combo Backtest 123 Reversal & Line Regression Intercept
Description: This is combo strategies for get a cumulative signal. First strategy This System was created from the Book "How I Tripled My Money In The Futures Market" by Ulf Jensen, Page 183. This is reverse type of strategies. The strategy buys at market, if close price is higher than the previous close during 2 days and the meaning of 9-days Stochastic Slow...

Count:121
Name: USDJPY Only Strategy
Description: Once again, I wish that tradingview offered at least a year of data on 15 minute time frames, but too bad. The only issue is that the last 2 and 1/2 months over which this was backtested is not enough and does not provide actual representation of future results. However, if it is, then I can comfortably earn 100%+ every month on average.

Count:121
Name: SPY 4 Hour Swing Trader
Description: The purpose of this script is to spot 4 hour pivots that indicate ~30 trading day swings. As VIX starts to drop options trading will get more boring and as we get back on the bull and can benefit from swing trading strategy. Swing trading doesn't make a whole lot of sense when VIX is above 28. Seems to get best results on 4 hour chart for this one. This indicator...

Count:121
Name: Strategy: Combo Z Score
Description: Strategy version of Combo Z Score Objective: Can we use both VIX and MOVE relationships to indicate movement in the SPY? VIX (forward contract on SPY options) correlations are quite common as forward indicators however MOVE (forward contract on bonds) also provides a slightly different level of insight Using the Z-Score of VIX vs VVIX and MOVE vs inverted VIX...

Count:120
Name: Dynamic Stop Loss Demo
Description: What does this script do ? This script is for pine script programmers and explains how to implement a dynamic stop-loss strategy. It is different from trailing stop-loss. Trailing stop-loss can only set the retracement value, but this script can take profit on part of the position at a fixed price and allows users to decide whether to take profit on all positions...


Count:120
Name: ATR_Trade_strategy
Description: ATR Based Strategy Identify the ATR range on Daily Chart. ATR HIGH= Previous Close +ATR ATR Low =Previous Close - ATR Long when Close is above ATR High Short when Close is below ATR Low Exit when close moves below EMA(10) OR a user-selected max loss

Count:120
Name: Strategy Backtester Template
Description: A template for building a strategy tester: - date range selector - stop loss - take profit - long and short strategy type selector

Count:120
Name: Noro's Locomotive Strategy v1.0
Description: Very simple strategy For: - crypto - timeframes: 1m, 5m, 15m, 30m, 1hour It is recommended: - piramiding - 0% commission - "bitcoin" Strategy If there are 4 red candles in a row - to open long If there is 1 green candle and Long is open - to close long If there are 4 green candles in a row - to open short If there is 1 red candle and is open shorts - to...

Count:120
Name: GBP/JPY Daily time FX Strategy ATR W% Baseline
Description: This is a preety good strategy suited for long term trading. It has been adapted and optimized in this case for GBP/JPY 1D time frame. Its made of Kiojun baseline, together with ATR for stop loss and size calculation and Williams % R For the purpose of this example we simulate that we have a leverage of 100x in order to be able to buy the ammount of lots...

Count:120
Name: Plot Break-even Price
Description: This indicator simply plots your entry price and the break-even point (green line). Area between the entry price and the break-even point will “eat” you profit by exchange fees. You can use the green line to lock your break-even point. I do not recommend using this strategy for trading, because the entry logic is based on SMA crosses. However, this script could be...

Count:120
Name: Combo Backtest 123 Reversal & DiNapoli Detrended Oscillator
Description: This is combo strategies for get a cumulative signal. First strategy This System was created from the Book "How I Tripled My Money In The Futures Market" by Ulf Jensen, Page 183. This is reverse type of strategies. The strategy buys at market, if close price is higher than the previous close during 2 days and the meaning of 9-days Stochastic Slow...

Count:120
Name: Moving Average Trap Strategy by D. Brigaglia
Description: This is a strategy that follows the 200 periods moving average and fades the cross of ma3, ma5 and ma8. It is designed for profiting by mean reversion while at the same time respecting long term trend. It is designed for long term trending markets such as stocks and stock indices. In this backtest, the strategy shows the ability to beat the S&P500 index with an...

Count:120
Name: Bill Williams Averages. 3Lines Backtest
Description: This indicator calculates 3 Moving Averages for default values of 13, 8 and 5 days, with displacement 8, 5 and 3 days: Median Price (High+Low/2). The most popular method of interpreting a moving average is to compare the relationship between a moving average of the security's price with the security's price itself (or between several moving averages).

Count:120
Name: PB Trend Scalper
Description: A moving average strategy using a long period RMA and a short period EMA. It has a trailing stop loss based on the previous higher high or lower low. It also has a no trade band surrounding the RMA whose thickness can be changed. Check out the settings to see what elements values can be changed. The strategy is set to use the whole balance on each trade...

Count:120
Name: Phoenix085-Strategies==>MTF - Average True Range + MovAvg
Description: FIRSTLY, Here are a few who have influenced my pinescripting immensely recently: @JustUncleL @BigBitsIO @TheArtofTrading @QuantNomad @SquigglesNiggles and many many many more. Overview: > This indicator is a simple crossover of Moving Averages. > In addition I am using ATR rising as an indication for Trending Price. > The entry is made once the smaller moving...

Count:120
Name: Volatility Capture RSI-Bollinger - Strategy [presentTrading]
Description: - Introduction and how it is different The 'Volatility Capture RSI-Bollinger - Strategy ' is a trading strategy that combines the concepts of Bollinger Bands (BB), Relative Strength Index (RSI), and Simple Moving Average (SMA) to generate trading signals. The uniqueness of this strategy is it calculates which is a dynamic level between the upper and lower...

Count:120
Name: Free Strategy #01 (ES / SPY)
Description: The strategy was designed to be traded based on daily data on the ES and SPY--the strategy was originally developed on NinjaTrader using approximately 50% out of sample data with a slippage of 1 tick on the ES. This is our first strategy that we converted from NinjaTrader to TradingView, so if you see any issues with our conversion, please let us know as we are...

Count:120
Name: Key Reversal Down Backtest
Description: A key reversal is a one-day trading pattern that may signal the reversal of a trend. Other frequently-used names for key reversal include "one-day reversal" and "reversal day." How Does a Key Reversal Work? Depending on which way the stock is trending, a key reversal day occurs when: In an uptrend -- prices hit a new high and then close near the previous...

Count:120
Name: EMR Strategy [H1 Backtesting]
Description: EMR Strategy base on EMA, MACD and RSI to supply signal on time frame H1. Details of Rule as below: === 1.EMA + Time frame: H1 + Periods: 25, 100 (~ EMA 25 H4), 600 (~ EMA 25 D1) === 2.MACD + Time frame: H1 + Periods: 12,26,9 === 3.RSI + Time frame: H1 + Periods: 14 === 4.Trading Rule 4.1.Long Position + MACD>0 and RSI>50 and close price moving above...

Count:120
Name: Odin's Kraken (TK Cross Strategy)
Description: A simple, yet profitable, trend following system based on 1 hour TK Crosses and ADX. Works best on ETH/BTC, but is also profitable on other large-cap altcoin BTC pairs (ADA/BTC, EOS/BTC, and TRX/BTC ). I'm still just getting started in the algo trading world, but if you have any questions I am more than happy to answer them in the comment section here or on...

Count:120
Name: Manual Buy & Sell Alerts
Description: This strategy is not an automation strategy. It is a tool that generates an 'alerts' so that you can buy and sell it at a predetermined price. The user can set the contents below. 1. Period 2. Entry price and entry type. 1) buy STOP 2) buy LIMIT 3. Target price. 4. stop loss price. You can easily test by changing the period value and the set value. I...


Count:119
Name: JC_MacD_RSI_Candle_Strat_public
Description: // // Author : Jacques CRETINON // Last Version : V1.0 11-22-2016 // // Risk disclaimer : Do not use this script in production environment. We assume no liability or responsibility for any damage to you, your computer, or your other property, due to the use of this script. // // Purpose of this script : // 1- use same pine code for strategy or study script (with...

Count:119
Name: Strategy #3 HalfTrend (Originally By everget)
Description: This Strategy Based on HalfTrend Indicator(everget) Entry Condition : Half Trend Signal Multi Take Profit Targets Feature with Stop Lose : Fixed Target Percentage or using ATR Multipliers Can Modify Trading Window For Backtesting

Count:119
Name: Moving Average - Intraday
Description: Moving Average Intraday Strategy Basic moving average strategy purpose built for intraday trading. It uses two simple moving averages & takes a positions on crossover. Position is reversed when signal changes by using double quantity. Once the intraday session is over & if the position is open; it is squared off. Users can define intraday session during which...

Count:119
Name: T!M - Wave Trend Strategy with Dates
Description: Using Lazy Bear's original Wave Trend script but I added dates to it to make it easier to backtest.

Count:119
Name: T3 Averages Backtest
Description: This indicator plots the moving average described in the January, 1998 issue of S&C, p.57, "Smoothing Techniques for More Accurate Signals", by Tim Tillson. This indicator plots T3 moving average presented in Figure 4 in the article. T3 indicator is a moving average which is calculated according to formula: T3(n) = GD(GD(GD(n))), where GD - generalized...

Count:119
Name: Double Stochastic
Description: Uses two sets of stochastic's to find bull/bear conditions tested on BTC daily and Gold etf weekly charts

Count:119
Name: ETH Climber Snake [ETHUSDT 60MIN]
Description: BEST PERFORMANCE: FTX:ETHUSDT 6H timeframe The concept of Climber Snake is to detect the uptrend first and then take the advantage of each correction while the price is rising, while it hold during the bearish trend. I'm using SAR indicator to detect the trend and Smooth HA Candles MTF v1 indicator made by @RafaelZioni to detect the correction waves

Count:119
Name: Gidra's Vchain Strategy v0.1
Description: Tested on "BTC/USD", this is a reversible strategy If the RSI is lower than "RSI Limit" (for last "RSI Signals" candles) and there were "Open Color, Bars" green Heiken Ashi candles - close short, open long If the RSI is higher than 100-"RSI Limit" (for last "RSI Signals" candles) and there were "Open Color, Bars" red Heiken Ashi candles - close long, open...


Count:118
Name: Ichimoku Breakout Kumo SWING TRADER (By Insert Cheese)
Description: A simple strategy for long spot or long futures (swing traders) based on a basic method of Ichimoku Kinko Hyo strategies. The strategy is simple: - Buy when the price breaks the cloud - Close the trade when the price closes again inside the cloud. The parameters that work best on this strategy are 10,30,60,30 and 1 for Senkou-Span A but you can try classic...

Count:118
Name: [CS] AMA Strategy - Channel Break-Out
Description: "There are various ways to detect trends with moving averages. The moving average is a rolling filter and uptrends are detected when either the price is above the moving average or when the moving average’s slope is positive. Given that an SMA can be well approximated by a constant-α AMA, it makes a lot of sense to adopt the AMA as the principal representative of...

Count:118
Name: Combo Backtest 123 Reversal & MACD Crossover with Trail and Stop
Description: This is a modification of @HPotter "Combo Backtest 123 Reversal & MACD Crossover" script. I've added a trail stop, basic leverage simulation and stop loss. Below is HPotter's explanation of the script principals. First strategy This System was created from the Book "How I Tripled My Money In The Futures Market" by Ulf Jensen, Page 183. This is reverse type of...

Count:118
Name: Baseline Cross Qualifier Volatility Strategy with HMA Trend Bias
Description: For trading ES on 30min Chart Trading Rules Post Baseline Cross Qualifier (PBCQ): If price crosses the baseline but the trade is invalid due to additional qualifiers, then the strategy doesn't enter a trade on that candle. This setting allows you override this disqualification in the following manner: If price crosses XX bars ago and is now qualified by other...

Count:118
Name: Buy and hold strategy
Description: A simple buy and hold strategy. A short or a long position can be chosen. The start date will determine the date where your position will start and end date is the date it will end. This works well as a baseline to your other existing strategies since buy and hold is just the simplest strategy available.

Count:118
Name: Candle Patterns Strategy - 2
Description: New risk management system: order entry, moving stop loss to breakeven + moving average filter (SMA)

Count:118
Name: Linear RSI
Description: This is an attempt to create a strategy based on the previous post. The strategy, as before, is based on the RSI, which is calculated using linear regression, but with the addition of EMA. The crossing of EMA and RSI is a buy and sell signal. There are also two functions to buy (because I haven't decided which is really better), so please use checkbox to order...

Count:117
Name: P-Signal Strategy RVS.
Description: For Christmas and New Year, for P-Signal users - the PINE code of a reverse (trigger) strategy! Strategy parameters. ================== 1. Cardinality – the number of points (from 4 to 200) that make up a set of elementary events (bar). This is the main parameter that determines success. 2. |ΔErf| - a size of the Δ region (from 0 to 1) of the error integral near...


Count:117
Name: Long Term Heat/Volatility - Accumulation/Distribution v1
Description: This is a strategy specifically made for 1D BTC/USD with the aim of capturing cycle tops and bottoms. It's mainly based on two indicators: 21d average of ATR (volatility) and (BTC.price - 180d sma)/BTC.price (heat). The strategy only signals buys or sells after occurrences of high volatility, followed by extremely high or low heat values. It's optimized for...

Count:117
Name: STRATEGY TESTER ENGINE - ON CHART DISPLAY - PLUG & PLAY
Description: So i had this idea while ago when @alexgrover published a script and dropped a nugget in between which replicates the result of strategy tester on chart as an indicator. So it seemed fair to use one of his strategy to display the results. This strategy tester can now be used in replay mode like an indicator and you can see what happen at a particular section...

Count:117
Name: Percentage Bands
Description: A different version of bollinger bands, I use percentage difference instead of standard deviation.

Count:117
Name: [VJ] Mega Supertrend for Intraday
Description: This is a simple intraday strategy for working on Stocks or commodities based out on Super Trend and intraday's best friend - VWAP . You can modify the start time and end time based on your timezones. Session value should be from market start to the time you want to square-off Important: The end time should be at least 2 minutes before the intraday square-off...

Count:117
Name: Dynamic Momentum Index (DMI) Backtest
Description: This indicator plots Dynamic Momentum Index indicator. The Dynamic Momentum Index (DMI) was developed by Tushar Chande and Stanley Kroll. The indicator is covered in detail in their book The New Technical Trader. The DMI is identical to Welles Wilder`s Relative Strength Index except the number of periods is variable rather than fixed. The variability of...

Count:117
Name: BTC Cap Dominance RSI Strategy
Description: This strategy is based on the BTC Cap Dominance RSI indicator, which is a combination of the RSI of Bitcoin Market Cap and the RSI of Bitcoin Dominance. The concept of this strategy is to get a good grasp of the bitcoin market flow by combining bitcoin dominance as well as bitcoin market cap. BTC Cap Dominance (BCD) RSI is defined as: BCD RSI = (BTC Cap RSI +...

Count:117
Name: Trend Trader Bands Backtest
Description: This is plots the indicator developed by Andrew Abraham in the Trading the Trend article of TASC September 1998 It was modified, result values wass averages. And draw two bands above and below TT line.

Count:117
Name: 9/21 MovingAvg Cross Signal EGAV.35
Description: Simple buy/sell signal with 9 & 21 ema cross over/under, works better in Daily Charts

Count:117
Name: Trendless MACD Strategy (Trendless Strategy Series -1 )
Description: I Try to eliminate the trend of the stock to see a clear version of the indicators. If you have any idea about that topic, you can send a message to me and we can improve this idea together.

Count:117
Name: SMA_Cross + RSI
Description: 1. long a. RSI does not open an order when it is overbought, until the RSI falls below a certain threshold, and then open a position b. There are already many positions. If the RSI is overbought, it will be profitable. When the RSI falls below a certain threshold, open a long position again until the moving average crossover signal turns short. 2. Short a. RSI...


Count:117
Name: Buy/Sell Strat
Description: This strategy will produce a buy or sell signal when the following criteria are met: 9 EMA crosses 21 EMA Recently closed candlestick has 15% higher average volume than previous 5 candles A candlestick reversal pattern Price crosses 9 EMA Feel free to use and modify as you see fit. Happy trading!

Count:117
Name: Loft Strategy V1
Description: This strategy consists of a kalman filter (by alexgrover ) and a "stop and reverse" line which is following the kalman filter. If the price goes in the same direction as the position side, the "stop and reverse" line approaches the kalman filter as set on the "Approach Decrease Step" parameter.

Count:116
Name: CDC Action Zone V.2 Strategy Backtest
Description: Published for backtest purpose All credit to : CDC Action Zone V.2 by piriya33 จัดทำขึ้นเพื่อการดูผล Backtest เขียวซื้อแดงขาย ตัวสคริปท์มีการเพิ่ม - Strategy Long/Short/Both // ปรับได้ใน Setting - Back test range // ปรับได้ใน Setting

Count:116
Name: I11L - Reversal Trading Ideas by Larry Connors
Description: This is my own Twist on Larry Connors Simple Tradingideas. It Combines the RSI, Averaging In and the Lowest Bars in a Single System. The current Configuration is designed for the Daily Timeframe. Feel free to play with the Parameters and keep in mind that Larry Intended to buy fear and sell the greed! The Rules are the following: ---Buy--- Buy, if the lowest...

Count:116
Name: 3RSI 3CCI BB 5orders DCA strategy+
Description: This strategy is just an attempt to find the indicator values for the trading bot service that I use (link in profile). Due to the use of the “request.security” function in the code, the indicators can be redrawn, but this is not important in history. The strategy used only 5 orders for the "DCA" - bot, located at the same distance in the price overlap range. I...

Count:116
Name: EMA Cross Strategy - Angara123
Description: Based on Anvamsi's script. Added a filter to only enter trades when the RSI is greater than (or less than if shorting) the 26 period EMA of the RSI. Turned off stop losses for better gains. will add other features as we collaborate in chat

Count:116
Name: Indicator Integrator Strat
Description: This strategy is based on my Indicator Integrator. The code sums the distances from the close of the price to an SMA (200 in example) with a summation period of the last 29 bars. I tuned this to NZDUSD 15min chart using 200SMA and 29 period sum. If I am reading strat tester correctly this hits a 39% gain since Mar-13 or 104 days. It has the ability to set stops...

Count:116
Name: Extreme Reversal Setup
Description: The extreme reversal strategy covered in the PivotBoss text.

Count:116
Name: RSI Strategy & MA Cross
Description: Combination of two strategy. MA Cross strategy is using 2 sma at 9 & 21. It can be configured through the source code. RSI strategy to decide whether the stock/crypto is currently overbought/oversold. Useful for quick entry and exit trade.

Count:116
Name: Super Breakout day trading
Description: This is an intraday indicator which uses Bollinger band and volume flow and MA to alert buy and sell signal. A user can use this indicator to help make entry and exits. This indicator wont show entry and exist of larger time frames like Day week month. This indicator uses Bollinger bands but try to minimize it shortcoming where it will buy and keep holding and...

Count:116
Name: Multiple Moving Averages+TransientZones+Volumes
Description: /////////////////////////////////////////////////////////////////////////////////////////// //// MULTIPLE_MA+TRANSIENT_ZONES+VOLUMES //// ///////////////////////////////////////////////////////////////////////////////////////// // @author GianlucaBezziccheri // A simple script including: // 1) 4x Simple Moving Averages // 2) 4x Exponential Moving Averages // 3)...

Count:116
Name: 3ngine Global Boilerplate
Description: ABOUT THE BOILERPLATE This strategy is designed to bring consistency to your strategies. It includes a macro EMA filter for filtering out countertrend trades, an ADX filter to help filter out chop, a session filter to filter out trades outside of desired timeframe, alert messages setup for automation, laddering in/out of trades (up to 6 rungs), ...

Count:116
Name: Simple Buy/Sell Strategy
Description: This is the strategy version of the original 'Simple Buy/Sell Indicator' by @Shizaru . The original indicator description explains the logic behind the strategy: "The original script was posted on ProRealCode by user Doctrading. This little and simple code allows you to draw an indicator, which show you when buy or sell conditions are met. For "buy" conditions,...

Count:116
Name: XBTUSD for BitMEX [ BB Long term strategy ]
Description: XBTUSD for BitMEX 『おすすめストラテジーSS1』(BitMEXビットコイン用Pineスクリプト)自動売買のアイデアに!

Count:115
Name: Combo 2/20 EMA & (H-L)/C Histogram
Description: This is combo strategies for get a cumulative signal. First strategy This indicator plots 2/20 exponential moving average. For the Mov Avg X 2/20 Indicator, the EMA bar will be painted when the Alert criteria is met. Second strategy This histogram displays (high-low)/close Can be applied to any time frame. WARNING: - For purpose educate only -...

Count:115
Name: RSI TrueLevel Strategy
Description: This strategy is a momentum-based strategy that uses the Relative Strength Index (RSI) indicator and a TrueLevel envelope to generate trade signals. The strategy uses user-defined input parameters to calculate TrueLevel envelopes for 14 different lengths. The TrueLevel envelope is a volatility-based technical indicator that consists of upper and lower bands. The...

Count:115
Name: STARC Bands Backtest
Description: A type of technical indicator that is created by plotting two bands around a short-term simple moving average (SMA) of an underlying asset's price. The upper band is created by adding a value of the average true range (ATR) - a popular indicator used by technical traders - to the moving average. The lower band is created by subtracting a value of the ATR...

Count:115
Name: swing trade
Description: THIS strategy is based on the franklin ochao swing trade book confirmed bullish - when ever stock closed above R2 (more bullish) when ever stock closed between R1 AND R2 (moderatly bullish or consolidation phase with respect to previous trend) entry1 for more bullish trend is buy at every dips means when ever price low below pivot when it open above the pivot...

Count:115
Name: MFI Simple Strategy
Description: Here I've made a simple strategy based off a simple moving average of an MFI length. Back tested on a BYBIT:BTCUSDT 30m chart. Conditions: ---When the price is above the golden SMA of 200 bars--- - Buy: when MFI is moving up - Sell: when MFI is moving down - Stop: golden SMA of 200 bars If you would like alerts: 1.) Add the strategy to your chart, 2.) Go...

Count:115
Name: Hi-Lo Channel Strategy
Description: Haven't seen a strategy quite like it. Buy when Heikin Ashi candle closes above a moving average that is sourced on highs - Sell when Heikin Ashi candle closes above a moving average that is sourced on lows. Moving average length should be between 5 and 20 ideally. NOTE: the Heikin Ashi close values are calculated when the box is checkmarked. You do not need to...

Count:115
Name: Equal-Length EMA/SMA Crossover Momentum Strategy
Description: Overview: This momentum and trend-following strategy captures the majority of any trending move, and works well on high timeframes. It uses an equal-period EMA and SMA crossover to detect trend acceleration/deceleration, since an EMA places a greater weight and significance on the most recent data. This version is optimized for longs, and designed to cut...

Count:114
Name: Bollinger and Tendencies (Bollinger e Tendências )
Description: The strategy consists of buying when the price breaks up (crossover) the bottom line of the Bollinger and selling when the price breaks down (crossunder) to your top line. The chart still shows trends clearly, with the fill between the exponential average and the closing value of the canlestick, green at high, red at low (this part of the script is based on the...

Count:114
Name: Kama and HMA trend follower
Description: This strategy is meant to be used to follow trending markets. Use of other methodologies to define or anticipatetrends will greatly enhance profits. Enjoy!

Count:114
Name: ALGO 3h, 1h, 2h
Description: This script tracks the crossing of the 10EMA on the 3h timeframe and the 200EMA on the 1h timeframe to open LONGS and SHORTS. Whether those LONGS or SHORTS actually trigger is based on the first 2 EMA's position in relation to a 3rd "controller" EMA.

Count:114
Name: Ta Strategy
Description: Hello guys This script follows traditional technical indicators MACD, ADX, RSI and pivot points If the price is above the resistance and the MACD has crossover ,and the RSI 14 is above 50 ADX is higher than 20, and DI+ is higher than DI-. This is a buy signal and vice versa for a sell signal The script moves the stop loss to the entry price after the first target...

Count:114
Name: BTC Sentiment analysis RSI 2xEMA
Description: This is a CRYPTO correlation strategy, which is using BTC sentiment with BITFINEX long and short ratios. WIth them we are making from one side 2 RSI, one for long and another for short. And from another side, we are going to make multiple EMA's, using the ratios for long and short. Rules for entry For this scenario I created a long only strategy. The long entry...

Count:114
Name: MA Crossover Strategy with MA Turning Point Exits
Description: User definable lengths of SMA, EMA, HMA, with entries on Crossover and exits on Turning Points. You can backtest different combos easily to see profitability.

Count:114
Name: Tale Indicators Strategy
Description: This script provides strategy from @JackBauer007 of the slowMA and fastMA crossovers to determine entry and exit conditions. The default is set to 3EMA and 15EMA crossovers. With entry and exit for Long positions set to high and for Short positions set to low. You can enable to run the strategy for a selected time-period to analyse the strategy on your instrument....

Count:114
Name: Same high/low + DCA (only long)
Description: This is an update of the previous "same high/low" strategy. This strategy can be helpful for those who look for entrance price points after level retest based on the dollar cost averaging approach. The retest of the level is defined by two candles with the same low. 4 entrance points were calculated based on volatility (not based on ATR though) and the weights...

Count:113
Name: Noro's Hundred Strategy v1.0
Description: Strategy uses: 1) Fast RSI (period = 7 bars) 2) Color of bars Strategy If RSI less than 30 is also 4 red candles in a row - to open long-position If RSI more than 70 is also 4 green candles in a row - to open short-position If long-position is open and there is 1 green candle - to close a position If short-position is open and there is 1 red candle - to close...

Count:113
Name: Range Breaker
Description: Strategy Description: Range Breaker The Range Breaker strategy is a breakout trading strategy that aims to capture profits when the price of a financial instrument moves out of a defined range. The strategy identifies swing highs and swing lows over a specified lookback period and enters long or short positions when the price breaks above the swing high or below...

Count:113
Name: Rudy's BB with Martingale
Description: My first strategy script that uses Bollinger Bands and Martingale to increase contract size after negative profit.

Count:113
Name: MACD+EMA crossovers Strategy custom
Description: It is a Strategy to use EMA crossover and MACD to decide when "buy" and when "sell", the key is spend some time "tuning" the parameters and using the simulation tool to find the best parameters for EMA and MACD there are 6 parameters, but with Excel and patience you could find the best configuration for the past and apply it to the future and see.

Count:113
Name: Bollinger Bands Strategy (MA type)
Description: The types of moving averages that Mr. Kıvanç Özbilgiç uses in his indicators and especially the "MACD Reloaded" and "SuperTrended Moving Averages" indicators gave me an idea. Better results can be obtained in different time frames by increasing the range of Moving averages used in Bollinger Bands. It is a trial and educational work only.

Count:112
Name: Daytrader strategies for major currencies
Description: Hello, This technique is for those who want the most simple method that is almost fool-proof. It must be done only during the busiest trading hours, 3 am to 11 am EST. This method doesn't work in sideways markets, only in volatile trending markets. Indicators: Ema 3 MA 20 Awesome Oscillator. Enter Long: when the red 3 EMA has crossed up through the...


Count:112
Name: Default Strategy Inputs (Forex / Crypto)
Description: The code in this post contains a set of default strategy inputs I use in new projects / backtests in Tradingview. Full code commentary is available on the Backtest-Rookies website. To comply with house rules, I cannot post the direct link here. Features Trade Direction: So that you can limit the strategy for long only, short only or trade in both...

Count:112
Name: Combo Backtest 123 Reversal & Average True Range Trailing Stops
Description: This is combo strategies for get a cumulative signal. Result signal will return 1 if two strategies is long, -1 if all strategies is short and 0 if signals of strategies is not equal. First strategy This System was created from the Book "How I Tripled My Money In The Futures Market" by Ulf Jensen, Page 183. This is reverse type of strategies. The...


Count:112
Name: Ichimoku Cloud Strategy v2.0
Description: Trend following trading strategy “Ichimoku Crossover” is a popular Ichimoku trading strategy that uses the cloud and crossover of two base lines to define the market reverse point. Ichimoku crossover trading strategy has appeared to be a profitable trading strategy. The indicator has 5 base lines and to read Ichimoku indicator it is required to understand the...

Count:112
Name: Crypto Long only Strategy 3h+ timeframe
Description: Today I bring another crypto strategy that works greatly with pairs like BTCEUR, ETHEUR, for 3h+ time frames. Its a risky strategy because we have a hard stop loss of 25% of our capital which can be modified. The idea behind its simple, we have a candle which is made from open+high+low+close / 4 , and we make the decision based on this one. We only go long with...

Count:112
Name: Linear EDCA v1.2
Description: Strategy Description: Linear EDCA (Linear Enhanced Dollar Cost Averaging) is an enhanced version of the DCA fixed investment strategy. It has the following features: 1. Take the 1100-day SMA as a reference indicator, enter the buy range below the moving average, and enter the sell range above the moving average 2. The order to buy and sell is carried out at...

Count:111
Name: Optimized Moving Average Strategy
Description: A very simple moving average strategy

Count:111
Name: WAMI Strategy Backtest
Description: The WAMI-based trading lies in the application and iteration of the optimization process until the indicated trades on past market data give consistent, profitable results. It is rather difficult process based on Fourier analysis. You can to change Trigger parameter for to get best values of strategy. You can change long to short in the Input Settings ...

Count:111
Name: Volty Expan Close Strategy
Description: Volty Expan Close Strategy, didnt really do anything except for change the parameters, would like to use a genetic algo to find the best params but i will leave it like this.

Count:111
Name: CCI 0Trend Strategy (by Marcoweb) v1.0
Description: Hi guys, I am trying to create a strategy that consists in the crossover/under of the 0 line of the Commodity Channel Index . Every time the price crosses over the 0 line in the CCI the strategy has to long getting short on the cross under and viceversa. I have published here another script strategy (consists in a crossover/under of the Overbought/Oversold...

Count:111
Name: Schaff Trend Cycle Strategy for ETHUSD 15m Backtest
Description: Schaff Trend Cycle Strategy for ETHUSD 15m

Count:111
Name: Straight Trend V1
Description: Hello everyone, We are proud to present you our "Straight Trend" Strategy. Strategy is use a specified timeline's opening price as reference and draw a line between the current price and trend line. Trend line is smoothed with last X times of highest and lowest values ( Donchian Methodology) in order to create less noise and fake alerts , therefore creates a...

Count:111
Name: Moving average system which waits for a better entry
Description: Wait for a better entry: A simple way to improve the relevant conditions is to wait for a better price than the system signal. One obvious problem is that when prices give a new signal and move on, you don't have a chance to enter the market at a better price. Statistically, a lot of small improvements may offset the chance that the deal was completely missed. In...

Count:111
Name: BB%B Strat
Description: Simple strategy to go long when price is below a bollinger band %B threshold, or go short when above a threshold. Trades are closed when BB%B moves back to an opposite threshold. Intended to be a relatively short time frame trade, usually only a few candles, and probably better on high time frames.

Count:111
Name: MACD Strategy by Sedkur
Description: This gives to you buy-sell signal with MACD histogram value. Use "Fast and Slow length" and "Buy or Sell Histogram Value" inputs to take less or more signal.

Count:111
Name: Combo Backtest 123 Reversal & FSK (Fast and Slow Kurtosis)
Description: This is combo strategies for get a cumulative signal. First strategy This System was created from the Book "How I Tripled My Money In The Futures Market" by Ulf Jensen, Page 183. This is reverse type of strategies. The strategy buys at market, if close price is higher than the previous close during 2 days and the meaning of 9-days Stochastic Slow...

Count:111
Name: RSI-candlestick Strategy
Description: The script follows a modified rsi strategy and orders are placed if a candlestick pattern is identified in the current or previous candle. (For optimized results you can add or remove the strategy entry and exits based on the chart you wish to apply the script to).

Count:111
Name: UVTrader Strateji
Description: If you see "AL", you can buy. If you see "SAT", you can sell. You can use all charts, but 4H and 1D charts are very well.

Count:110
Name: J2S Backtest: 123-Stormer Strategy
Description: This backtest presents the 123-Stormer strategy created by trader Alexandre Wolwacz "Stormer". The strategy is advocates and shared by the trader through his YouTube channel without restrictions. Note : This is not an investment recommendation. The purpose of this study is only to share knowledge with the community on tradingview. What is the purpose of the...

Count:110
Name: Know Sure Thing and EMA Strategy by JLX
Description: This is a simple strategy based in Know Sure Thing indicator and an Exponential moving average, Rules are as follow: - You can go long when the KST cross signal bellow 0 and price closes above the target EMA - You can go short when the KST cross signal above 0 and price closes bellow the target EMA I include a trailing stop loss, default its 0.5% Hope you enjoy it

Count:110
Name: Rebalancing
Description: This script gives you an approximation of the APR you can get when using the technique of Rebalancing. Further discription are embeded in the script. HOW TO USE: - Start date: Choose start date - Settings: Change settings to your own needs - Base currency: Select Base currency - Portfolio: Select the coins (MAX 9 pcs.) you want to use in your portfolio for the...

Count:110
Name: Random Strategy with 3 TP levels and SL - Kenfus
Description: I wanted to see how important risk-managment is.

Count:110
Name: STOP-LOSS-RSI with Edge-Preserving Filter Strategy V2
Description: Modified RSI strategy with entry and exit points. I have allowed for High and Low risk for anyone interested in using it (NO GUARANTEES. DO YOUR OWN RESEARCH). I will later consider incorporating the standard RSI for exit points. I am sure returns will increase based on current test runs :) Returns look good based on the strategy result.

Count:110
Name: PPSignal V4 (Auto Adaptive Times)
Description: We have ppsignal system for the next period. // D: 1min to 15 min // W: 60-120 - 180 - 240 - D

Count:110
Name: Strategy Crypto -- double your capital
Description: BTCUSD -- 5 min BUY POSITION 1 : The price is above the hull suite indicator 2 : The hull suite indicator is green 3 : The volume oscillator indicator is above 0 4 : A new blue candle should appear on the QQE MOD indicator SELL POSITION 1 : The price is bellow the hull suite indicator 2 : The hull suite indicator is red 3 : The volume oscillator...

Count:110
Name: ema strategy
Description: EMA STRATEGY Scalping with staggered buy and profit Booking try and like if you get profitable

Count:110
Name: Noro's Stochastic Strategy v1.2
Description: in 1.2: - profit became more Uses: 1) Stochastic Momentum Index ("Use SMI-Strategy") 2) Fast RSI , period 7 ("Use RSI-Strategy") 3) SMA Body filter ("Use Body-filter")

Count:110
Name: Combo Backtest 123 Reversal & Chande Momentum Oscillator
Description: This is combo strategies for get a cumulative signal. First strategy This System was created from the Book "How I Tripled My Money In The Futures Market" by Ulf Jensen, Page 183. This is reverse type of strategies. The strategy buys at market, if close price is higher than the previous close during 2 days and the meaning of 9-days Stochastic Slow...

Count:110
Name: 8ma34 EURUSD 1h 480tp 950sl
Description: Crossing 8 sma and 34 sma on the 1h chart (close) of EURUSD. If sma (8) crossing up sma (34) then open a long on closed bar with +480 pips for the take profit and -950 pips for the stop loss. If sma (8) crossing down sma (34) then open a short on closed bar with -480 pips for the take profit and +950 pips for the stop loss.

Count:110
Name: Price Action - Support & Resistance + MACD LONG Strategy
Description: Using "Price Action - Support & Resistance by DGT" and the MACD (Moving Average Convergence Divergence) indicator in TradingView can help develop a trade strategy. Here's a step-by-step approach you can follow: 1. Identifying Support and Resistance Levels: Apply the "Price Action - Support & Resistance by DGT" indicator to your chart. This indicator helps you...

Count:109
Name: Pullback Strategy
Description: BTCUSD -- 5 min BUY POSITION 1 : Fast ema is above medium ema and medium ema is above slow ema 2 : The price drops below the fast ema but not the slow ema 3 : The price rises above the fast ema SELL POSITION 1 : Fast ema is below medium ema and medium ema is below slow ema 2 : the Price rises above fast ema but not slow ema 3 : The price drops back...

Count:109
Name: Velocity To Inverse Correlation to VIX/Bonds Strategy (2020)
Description: This strategy measures and creates a signal when an asset is moving out of a correlation with high yield bonds or the CBOE VIX into an inverse correlation, as well as when an asset is losing correlation with a top corporate bonds ETF. When this signal is triggered, the simulation has the portfolio asset go long. Additionally, exits are based on a 2% stop loss...

Count:109
Name: AZ V.3 Test ++Position Size Fix+Float
Description: Core Concept This Strategy is Base on EMA Cross But thing what make this strategy be different from original CDC Action Zone V.3 is "Position Size" Compound Profit & Not Compound Profit Strategy Position Sizing Concept Be real.Everyone know the key of survive in the Market is "Risk & Money Management" So, How can we manage our Risk and Money? Yes, The...

Count:109
Name: Trend trader Strategy
Description: First I would like to thank to @JustUncleL since this strategy started from one of his scalper strategies This strategy can be adapted to all time charts . First it has the session where we want to trade, for this example I choosed the EURUSD so I only take in consideration london/neywork session. Its made from 3 EMA : normal slow ultra slow It has has the...

Count:109
Name: Profitable Contrarian scalping
Description: Uses the 5 period and 10 period VMWAs that have been smoothed with a 5 period SMA of the close price. Normally, a short crossover long formation signals a buy signal, but as scalpers know, the 1 minute chart moves so fast and with so much volatility that lagging indicators get wrecked by the market. According, this strategy operates under the assumption that by...

Count:109
Name: MACD Strategy- Script Example how to use % SL in your script
Description: ** Tired of Script showing a trade that you stopped out on but is still long on your script? Not any more** I used Pine script to create realistic trading scenarios for SL users. Now your scripts will reflect what you see on the order book. a=0.0 a := (*Insert buy condition*)? close: nz(a ) plot(0.98*a, color= green) //2%SL for BUY b=0.0 b:= (*Insert Short...

Count:109
Name: BB21_MA200_Strategy
Description: This strategy follows the trend and keeps you in the trend until it breaks SMA 200 SMA setting is 200 BB setting is 21 BUY ==== when BB is (lower band and upper band) above SMA 200 and price crossing above BB middle line Partial Exit ========== When Lower BB crossing down SMA200 , exit 30% Total Exit ========= When BB middle band crosses down...

Count:109
Name: EMA 34, 89, 200 e cruzamento das EMA
Description: Médias exponenciais 34, 89 e 200 e estrategia de compra e venda com cruzamento das medias.

Count:109
Name: Estamina Trend Strategy By KrisWaters
Description: Trend following strategy based on moving avarage crossovers. Strategy provides only long signals. Use only for BTCUSDT pair on 4H timeframe.

Count:109
Name: Fast v Slow Moving Averages Strategy (Variable) [divonn1994]
Description: This is a simple moving average based strategy that takes 2 moving averages, a Fast and a Slow one, plots them both, and then decides to enter a 'long' position or exit it based on whether the two lines have crossed each other. It goes 'long when the Fast Moving Average crosses above the Slow Moving Average. This could indicate upwards momentum in prices in the...

Count:109
Name: longWickStrategy
Description: price action strategy for intraday trading based on candle vs wick length ratio

Count:108
Name: [KL] Mean Reversion (ATR) Strategy
Description: This strategy will enter into a position when price volatility is relative high, betting that price will subsequently trend in a favourable direction. Hypothesis : During periods of high price volatility, ATR will divert from its moving average by at least +/- one standard deviation. Eventually, ATR will revert back to the mean. However, just knowing the...

Count:108
Name: MESA + cRSI + MA + ALMA + MACD Strategy
Description: The WHAT =============> Basically a combination of multiple indicators into a strategy. As the title says - it's a combo of MESA Pivot Points, Cyclic RSI, MESA Adjusted Moving Average, ALMA and MACD. Feel free to play around with them and turn then on/off as desired to get the best results for your coin. Enjoy :)

Count:108
Name: [Strategy] - EMA 10,20 59 with Profit Displayed
Description: This EA is still under construction !! So for this EA is only based on the trend of the 3 EMA's Buytrend = (ema1 and ema2 > ema3) and (ema1 and ema2 > ema3 ) We also change the Background depending on the trend. bgcolor(Buytrend ? color.green : color.red,transp=70) At this point I was wondering how much "profit" we would have made if this strategy was...

Count:108
Name: Monthly MA Close
Description: Generates buy or sell signal if monthly candle closes above or below the signal MA. Long positions only. Inputs: -Change timeframe MA -Change period MA -Use SMA or EMA -Display MA -Use another ticker as signal -Select time period for backtesting This script is not necessarily written to maximize profits, but to minimize losses. Although it can outperform 'Buy &...

Count:108
Name: Bollinger Bands BAT/USDT 30min
Description: This is ready to use Bollinger Band strategy that was backtested on the data from the previous year 2019. The main purpose of this strategy is to determine trades with the highest probability of success, to keep a consistent portfolio growth throughout the year. This strategy cherry-picks the most reliable points of entry on a particular timeframe (30m) for the...

Count:108
Name: Fisher Transform Multi-Timeframe Backtest (No Trailing)
Description: This is the Backtester without Trailing Stops Credits to mortdiggiddy

Count:107
Name: Triple EMA Strategy
Description: This is my first ever script so any suggestions, recommendations or improvement ideas welcome! This strategy is an implementation of a standard three exponential moving averages strategy (defaults: EMA1=5, EMA2=20 and EMA3=50 candles). Trades are executed if EMA1 crosses above/below EMA2 and they are both above/below EMA3. In addition, the close of the current...

Count:107
Name: Double Inside Bar & Trend Strategy - Kaspricci
Description: Double Inside Bar & Trend Strategy - Kaspricci This strategy combines the Double Inside Bar candlestick pattern with a trend filter. Once the second inside bar closes and price is above trend moving average, a buy stop order is placed at high of the candle. If price is below trend moving average, a sell stop order is placed at the low of the candle. This...

Count:107
Name: Dieyson daytrade EMA 9+20+200+VWAP and bar & line color
Description: Dieyson daytrade EMA 9 + EMA20 + EMA 200 + VWAP

Count:107
Name: Hull cross and ATR
Description: open = Hull crossover and ATR line with price crossover close = Hull crossover

Count:107
Name: Combo 2/20 EMA & Bear Power
Description: This is combo strategies for get a cumulative signal. First strategy This indicator plots 2/20 exponential moving average. For the Mov Avg X 2/20 Indicator, the EMA bar will be painted when the Alert criteria is met. Second strategy Bear Power Indicator To get more information please see "Bull And Bear Balance Indicator" by Vadim Gimelfarb. ...

Count:107
Name: Higher High / Lower Low Strategy
Description: This is a very simple trend following strategy for Day Trading. The premise is to follow the Moving Average for the trend direction and buy/sell the dips and blips in the trend. 1. In an uptrend, when the candle action offers a "dip", or a lower high, the strategy will then buy on the close of the candle that breaks the high of the previous candle. 2. In a...

Count:107
Name: 2HL
Description: A very simple, almost naive strategy, in which you buy on the lowest of the two previous candles and sell at the highest of the two previous candles. You can configure these highest and lowest lenght, in some assets two is too small of a number to make profit. You can also configure to exit the position after X, and I found that 7 (which is a week of working days)...

Count:107
Name: Chande Kroll Stop + ADX filter strategy
Description: Dear TV''ers, Hereby a script where i created a simple strategy using the underappreciated chande kroll stop indicator. Short signal is when the close crosses under the orange line and a long signal is generated upon a crossover of a close candle of the blue line. Additionally you have the option to filter using ADX the minimize getting rekt in a choppy...

Count:107
Name: Strategy Myth-Busting #23 - 2xEMA+DPO- [MYN]
Description: #23 on the Myth-Busting bench, we are automating the "Best Funded Account Trading Strategy (Pass EVERY Challenge!)" strategy from "Trade with Pat" who claims this strategy will pass every trading challenge out there. This strategy uses 3 open source indicators. 2 EMA's. The first one (Slow) is set to a length of 40 and a fast EMA which is set to 12. This strategy...


Count:106
Name: Momentum Trading By Mahfuz Azim
Description: A following indicator is Momentum Trading that uses fast QQE crosses with Moving Averages Use for trend direction filtering. QQE or Qualitative Quantitative Estimation is based Relative strength index (RSI), but uses a smoothing technique as an additional transformation. Three crosses can be selected (all selected by default)

Count:106
Name: Noro's ShiftEx Strategy v2.0
Description: Lime line - level for opening a long position. Blue line - level to close a long position. Short positions are not used. Lime line = source of previous candle -% (or 0) Blue line = source of previous candle +% (or 0) For - (any altcoin)/BTC, (any altcoin)/ETH, (any altcoin)/BNB - timeframes: 1h, 4h or 1d Preferably - if 1h TF: buy-5% and sell+0% -...

Count:106
Name: Combo Backtest 123 Reversal & Perfomance index
Description: This is combo strategies for get a cumulative signal. First strategy This System was created from the Book "How I Tripled My Money In The Futures Market" by Ulf Jensen, Page 183. This is reverse type of strategies. The strategy buys at market, if close price is higher than the previous close during 2 days and the meaning of 9-days Stochastic Slow...

Count:106
Name: Confirmed Divergence Strategy
Description: This simple strategy demonstrates the value of confirmed divergence. An entry is selected based off of divergence in the RSI where the first extreme is overbought or oversold. This must then be confirmed by divergence on the Awesome oscillator . The result is an alert that is more reliable than single divergence on either indicator, and an entry is only keyed on...

Count:106
Name: PROSTRATS Pine Script for Swing Trading
Description: This is a simple script for swing trading. It uses my 2 favorite indicators; the Choppiness Index as well as Fibonacci Retracement. This script is meant to run on the 4 hour time frame, in my case I use BTCUSD. It will buy when 2 conditions are met. The first is that the Choppiness Index is above 54.5 on the Daily Time frame, which means the price has potential to...

Count:106
Name: Trend #4 - ATR+EMA channel
Description: Overview: This strategy use ATR to take-profit, Red-EMA to stop-loss, Blue-EMA channel to judgment breakout. This strategy use commission setting is 0.05%, slippage setting is 2 ticks, you can set the appropriate value size in the properties page. What it does: This strategy detects when a trend is emerging and buy or sell. How it does it: When the price breaks...


Count:106
Name: Hobbiecode - SP500 IBS + Higher
Description: This is a simple strategy that is working well on SPY but also well performing on Mini Futures SP500. The strategy is composed by the followin rules: 1. Today is Monday. 2. The close must be lower than the close on Friday. 3. The IBS must be below 0.5. 4. If 1-3 are true, then enter at the close. 5. Sell 5 trading days later (at the close). If you backtest it on...

Count:106
Name: Absolute Price Oscillator (APO) Backtest 2.0
Description: The Absolute Price Oscillator displays the difference between two exponential moving averages of a security's price and is expressed as an absolute value. How this indicator works APO crossing above zero is considered bullish, while crossing below zero is bearish. A positive indicator value indicates an upward movement, while negative readings ...

Count:106
Name: Bollinger Bands %B - Belt Holds & Inner Candles
Description: This is a simple strategy that uses Bollinger Bands %B represented as a histogram combined with Candle Beltholds and Inside candles for entry signals, and combines this with "buy" and "sell" zones of the %B indicator, to buy and sell based on the zones you set. How to use: Long when in the green zone and an inside candle (which is highlighted in white) or a...

Count:105
Name: EMA pullback strategy
Description: A solid EMA pullback strategy for cryptos 15 min chart that uses EMA crossing as signal and pullback as stop loss. EMA1: shortest period for finding crossing (I find period = 33 profitable for BTCUSD, you can adjust it for other cryptos) EMA2: 5x period of EMA1, for filtering out some trend reversals EMA3: 11x period of EMA1, for determining trend...

Count:105
Name: JBravo Swing with GoGo Juice
Description: This follows Johnny Bravo Dominate Stocks strategy. When a full price bar closes above SMA 9, this indicates a buy. When the price bar closes below EMA20, this indicates a sell. If the MAs are all sloping up and aligned in order 9,20,180, then this indicates a Strong Buy. If the MAs are all sloping down and aligned in order 180,20,9, then this indicates a Strong...

Count:105
Name: CMARSI result on BTCUSD when allin every moove
Description: yep, this is pretty good


Count:105
Name: Dumb Strategy 2 - Golden Cross
Description: The Golden Cross is one of the simplest market indicator who helps long term investors to entry a position. With that in mind, I made a very easy to understand backtest showing how much we could earn if we entered in a Golden Cross and exit when Death Cross happening. Take this code and try in your favorite market. Of course, never use only this indicator to trade.

Count:105
Name: Random entry points
Description: It is profitable strategy with random entry points. A simple strategy involving random opening of trades. But such a strategy on large samples will demonstrate profit. Because the strategy adheres to the golden rule of trading: "Let profits rise and quickly stop losses." Remember, exit points are very important. Many traders make the mistake of focusing all...

Count:105
Name: Volume Ratio_30min
Description: refer to for FXBTCJPY This strategy monitors volume and, when the threshold is exceeded, buys and sells in that direction.

Count:105
Name: Range Filter - B&S Signals - 001 - edited
Description: I have not description. Publishing so a freind can use it.

Count:105
Name: T3MA_KC_7ye Strategy
Description: This script uses KC and a T3 moving average A red background is a bear market A bull market is when the background is green The main idea is the average of the bend and KC channel breakthrough 这个脚本使用了KC以及T3均线 背景为红色时是熊市 背景为绿色时是牛市 主要思路是均线的拐头以及KC通道的突破

Count:105
Name: Strategy Myth-Busting #8 - TrendSurfers+TrendOsc - [MYN]
Description: This is part of a new series we are calling "Strategy Myth-Busting" where we take open public manual trading strategies and automate them. The goal is to not only validate the authenticity of the claims but to provide an automated version for traders who wish to trade autonomously. Our 8th one is an automated version of the " 653% Gain Magical 1 Minute Scalping...

Count:105
Name: DMI Strategy
Description: This strategy is based on DMI indicator. It helps me to identify base or top of the script. I mostly use this script to trade in Nifty bank options, even when the signal comes in nifty . It can be used to trade in other scripts as well. Pivot points can also be used to take entry. Long entry is taken when DI+(11) goes below 10 and DI-(11) goes above 40 , whereas...

Count:105
Name: LONG TERM INVESTMENT TECHNICAL STRATEGY SCRIPT
Description: 200 - WEEKLY MOVING AVERAGE GREEN LINE IS 200 WEEKS MOVING AVERAGE OF CLOSE BLUE LINE IS 200 WEEKS MOVING AVERAGE OF LOW MULTIPLIED BY 0.90 RED LINE IS 100 WEEKS MOVING AVERAGE OF CLOSE CONDITION: GREEN LINE SHOULD BE ABOVE RED LINE AND PRICE SHOULD BE ABOVE GREEN LINE BUY ONCE THE PRICE IS ABOVE GREEN LINE AND FULFILLS THE CONDITION. TARGET 1 FOR TIME FRAME...

Count:105
Name: BTC Hashrate ribbons
Description: BTC Hash Rate ribbons / Hash Rate cross This strategy goes long when BTCs Hash Rate 30 day moving average crosses above the 60 day moving average, signifying that miner capitulation is over and recovery has started. When the opposite signal is given, which signifies the beginning of miner capitulation, the strategy goes short (or flat, depending on...

Count:105
Name: Low Volatility Strategy v2.0
Description: Low Volatility Strategy v2.0. For Bitmex BTC/USD Timeframe 4H.

Count:105
Name: Momentuminator 1.0
Description: Here we have a general purpose momentum based long and short flip flop with optional profit target and maximum loss. Program development: Boffin Hollow Lab Author: Tarzan at tradingview.com Release: Version 1.0 May 2016 Please Note: Past Performance is not necessarily indicative of future results

Count:104
Name: Complete turtles strategy based on the donchian channels
Description: Dear Traders and investor, I want to demonstrate scrypt of the iconic "trend following strategy" coded by my The main idea was borrowed from the book "Way of the Turtle: The Secret Methods that Turned Ordinary People into Legendary". The strategy is based on the donchian channels and is one of the oldest and easiest strategy in the using. Also strategy include...

Count:104
Name: [STRATEGY][RS]MarxBabu 4 Oscillators V0
Description: EXPERIMENTAL: Request for MarxBabu.

Count:104
Name: Floor Pivot Points Backtest
Description: The name ‘Floor-Trader Pivot,’ came from the fact that Pivot points can be calculated quickly, on the fly using price data from the previous day as an input. Although time-frames of less than a day can be used, Pivots are commonly plotted on the Daily Chart; using price data from the previous day’s trading activity. You can change long to short in the...

Count:104
Name: BTC_ISHIMOKU
Description: Investment trading strategy on the daily timeframe of the BTC-USD pair based on the Ichimoku cloud indicator

Count:104
Name: Laguerre RSI Strategy
Description: The WHAT =============> A strategy based off the Editor's Pick "Laguerre RSI indicator" from @KivancOzbilgic Laguerre RSI is based on John EHLERS' Laguerre Filter to avoid the noise of RSI. As such, it is possible to use it to plot trend changes more precisely - and thus open and close positions at these points. The HOW =============> This is a very easy to set...


Count:104
Name: SB_CM_RSI_2_Strategy_Version 2.0
Description: (New: Profit booking present which is not present in the previous indicator) The strategy is based on the indicator posted by @ChrisMoody "CM RSI-2 Strategy Lower Indicator" which is based on "Larry Connors RSI-2 Strategy - Lower RSI" In this strategy, the longs are placed when a green color is encountered in the rsi in the previous candle and short when the...

Count:104
Name: volume low standard deviation stystem
Description: On the basis of moving average, add moving average and standard deviation line of volume to filter the entry and exit time. Filter entries and/or exits based on low volume options = 1, no not enter on low volume options = 2, exit on low volume options = 3, both 1 and 2 For others, please refer to the code and notes。

Count:104
Name: Noro's Levels+RSI Strategy v1.0
Description: - Fast RSI Strategy - Levels Strategy - 2 in 1 For: - "crypto/fiat" - D1 timeframe

Count:104
Name: Martingale
Description: Because market has random wlak but also a martingale property: after a good day, there is a higher probability that another good day will follow than a bad one. System goes long only: it does not operate when the variation close-to-close in percentage (%) in under a certain buffer (i.e. very little movements are not considered). There are also rules of money...

Count:104
Name: Noro's Fast RSI Strategy v1.0
Description: For: - crypto/fiat - crypto/crypto - timeframes: 1hour, 30min, 15min, 5min Strategy uses 2 indicators: 1) RSI indicator, period = 3 2) EMA Body, period = 30 EMA Body Step 1. The candle body size pays off = abs(close-open) Step 2. The average size of a body of a candle pays off. Only 30 last candles. EMA. Step 3. If the body of the current candle is less...

Count:104
Name: Trend Following with Donchian Channels and MACD
Description: This is a trend following system based on the Donchian Channels. Instead of using a simple moving average crossover, this system uses the MACD as the trendfilter: Long positions: * Price makes a new 50 day high, * The MACD-line crosses above or is above the Signal-line. * Both the MACD and the Signal-lines are above the zero-line. Short positions: * Price makes...

Count:104
Name: EMA + Ichimoku Kinko Hyo Strategy
Description: This trading strategy uses combination of the Ichimoku Kinko Hyo system with Fibonacci numbers based exponential moving average(EMA) and RSI 12/24 crossover, giving excellent results in trending stocks !

Count:104
Name: X48 - Strategy | ADAPTIVE CONSECUTIVE + TP/SL | V.1
Description: Thanks For Tradingview Built-in Script :: << Original From Consecutive Strategy Built-in Script >> ================== Read This First Before Use This Strategy ============== Please be aware that this strategy is not a guarantee of success and may lead to losses. Trading involves risk and you should always do your own research before making any...

Count:104
Name: Galileo Galilei
Description: Galileo Galilei Is the simplest of them all and easy to understand: It has an Exponential Moving Average that you can modify to suit your pair on the chart with it's timeframe, looking at the strategy tester to compare results; The prices for the EMA are taken from the OPEN of every candle (depending on your timeframe); If the current candle's price closes...

Count:103
Name: SB_Volume_oscillator_Prev_high_low
Description: The strategy is a take on traditional volume oscillator. In Layman terms: The script places an order when the oscillator crosses the zero mark in the volume oscillator. If the previous high is greater than the absolute value of previous low then a long order is placed And if the absolute previous low is greater than the previous high then a shrt order is...


Count:103
Name: Combo Backtest 123 Reversal & DMI & Moving Average
Description: This is combo strategies for get a cumulative signal. First strategy This System was created from the Book "How I Tripled My Money In The Futures Market" by Ulf Jensen, Page 183. This is reverse type of strategies. The strategy buys at market, if close price is higher than the previous close during 2 days and the meaning of 9-days Stochastic Slow...

Count:103
Name: Candle Patterns Strategy V1
Description: //Modify DanyChe script to work in latest version of pinescript //The script allows you to test popular candlestick patterns on various instruments and timeframes. In addition, you can configure risk management (if the value is zero, it means the function is disabled), and you can also specify the time of the trading session (for example, so that the positions are...

Count:103
Name: Combo Backtest 123 Reversal & Ease of Movement (EOM)
Description: This is combo strategies for get a cumulative signal. First strategy This System was created from the Book "How I Tripled My Money In The Futures Market" by Ulf Jensen, Page 183. This is reverse type of strategies. The strategy buys at market, if close price is higher than the previous close during 2 days and the meaning of 9-days Stochastic Slow...

Count:103
Name: Ok signal
Description: Plz add this is very true signal is liye ni no Kuni to ni no Kuni to ni no Kuni to ni no Kuni to ni no Kuni to ni no Kuni to ni no Kuni is love you ❤️🥀 Congratulations to e iqball WEs e eW to

Count:103
Name: ComiCo - Joel on Crypto - MACD Scalping
Description: This is a modified (hopefully improved) version of the "Joel on Crypto - MACD Scalping" indicator. It got turned into a strategy, and added some extra filters, like number of trades after EMA cross, minimal EMA distance (EMA 50's distance from the EMA 200). It is just an experiment to see how good this scalping strategy can get. Play around with it and let me...

Count:102
Name: 4H CCI Strategy 1.4
Description: Here's the last version...quick hack job. I'm sure it can be improved, but this is a rough sketch, code wise. The strategy works in range bound enviroments, so cointegrated pairs like AUDCAD will shine with it. Cheers, Ivan Labrie Time at Mode FX

Count:102
Name: Understanding contract sizes in a strategy
Description: This simple strat fires up on green bars, down on red bars. cannot get any simpler. So, it's a good example to check how returns are calculated. First, the internal firing mechanism for the strategy.entry function is something hardcore. As result, the entry points can be confusing, and seem to appear in a wrong bar (as the 2nd and 3rd signals are good examples),...

Count:102
Name: Noro's Wizard Strategy v1.0
Description: The bottom indicator. Uses BB (source = low of candle). For: - D1 timeframe - Crypto/Fiat ("btc/usd", "eth/eur", etc)
Count:102
Name: [DuDu95] SSL 4C MACD Laugerre RSI Strategy
Description: Hello Guys! Nice to meet you all! Before I start, my nickname has changed to 'DuDu95'!! This is the Strategy introduced by youtube channel. I made this based on the open source indicator by kevinmck100, vkno422, KivancOzbilgic. Thank you All! ### Entry Logic 1. Long Entry Logic - close > SSL Hybrid baseline upper k (keltner channel) - macd signal > 0 and current...

Count:102
Name: SeongMo_MA_V3(Elliot_helper)
Description: Made to make it easier to count Elliott waves. If you renew your new high price, you'll continue your new high price When the new low is renewed, the new low is continued. If you are within the range of the previous candle, use the ratio of the difference between the median value of the previous candle and the closing price of the current candle to determine...

Count:102
Name: ADX_TSI_Bol Band Trend Chaser
Description: The idea of this script is to be a low risk strategy on trending stocks (or any other trending market), aiming to achieve minimal draw down (e.g. at time of writing AAPL only had ~1.36% draw down, FB ~1.93% draw down and the SPY was 0.80% draw down and all remained profitable). Testing proved it shouldn't be used in choppy stocks and best period was on daily...

Count:102
Name: XBT Weekend Trade Strategy (10x leverage)
Description: Using 10x leverage Using Friday's GXBT close price do the following: - Go short when price rises above 4.5% - Go long when price falls below 4.5% - Close all orders when profits reach 10%) - Close all orders start of Monday

Count:102
Name: Unemployment Momentum Model
Description: This model uses a Smoothed RSI to measure the momentum of the Civilian Unemployment Rate as published by FRED. The behavior of the unemployment rate makes it ideal for applying momentum-based timing techniques because it tends to rise sharply in a short time period and then declines gradually over a longer period. Using other basic momentum-based timing techniques...

Count:102
Name: Trend Identifier Strategy
Description: Trend Identifier Strategy for 1D BTC.USD The indicator smoothens a closely following moving average into a polynomial like plot and assumes 4 staged cycles based on the first and the second derivatives. This is an optimized strategy for long term buying and selling with a Sortino Ratio above 3. It is designed to be a more profitable alternative to HODLing. It can...

Count:102
Name: strategy modelius volume model
Description: So this is the strategy for the modelius volume indicator make money indicator is based on it with correct stop loss and exit you can make nice results with it the model is here with some addition of SAR alerts and others with stop loss and tp

Count:102
Name: BB Keltner Squeeze Strategy
Description: Shows all bollinger bands (solid lines) and keltner channels (dotted line) and will go long/short when a squeeze happens between bollinger bands and keltner channel and exit the positions once there is no more momentum

Count:102
Name: Trend-Reverse Strategy
Description: Trend-Reverse Strategy is a combination of these 2 scripts to use 5 min candle.

Count:102
Name: Ultimate Balance Strategy
Description: The Ultimate Balance Oscillator Strategy harnesses the power of the Ultimate Balance Oscillator to deliver a comprehensive and disciplined approach to trading. By combining the insights of the Rate of Change (ROC), Relative Strength Index (RSI), Commodity Channel Index (CCI), Williams Percent Range, and Average Directional Index (ADX) from TradingView, this...

Count:102
Name: Ergotic MACD Strategy Backtest
Description: This is one of the techniques described by William Blau in his book "Momentum, Direction and Divergence" (1995). If you like to learn more, we advise you to read this book. His book focuses on three key aspects of trading: momentum, direction and divergence. Blau, who was an electrical engineer before becoming a trader, thoroughly examines the relationship ...

Count:102
Name: SSL Strategy + EMA 200 AND Stop Loss
Description: If you want to see the funcionality of this strategy on detail, please go to: "Estrategia De Scalping Para Criptomonedas Con SSL y Média Móvil Probada 100 Veces" on Youtube Note: This strategy can be perfectly improved To see the Stop loss levels, increase the thickness of plot number one

Count:102
Name: The Puria Method
Description: Traders who work on this system argue that the Forex Strategy “The Puria Method” can make a 50 points profit a day :) FX:EURUSD )

Count:102
Name: Ichimoku Cloud and ADX with Trailing Stop Loss (by Coinrule)
Description: The Ichimoku Cloud is a collection of technical indicators that show support and resistance levels, as well as momentum and trend direction. It does this by taking multiple averages and plotting them on a chart. It also uses these figures to compute a “cloud” that attempts to forecast where the price may find support or resistance in the future. The Ichimoku...

Count:102
Name: Rate of Change Strategy
Description: This strategy calculates the rate of change over time to determine buy/sell points. This strategy is best run with 1 hour candles . Configurable values: SMA Fast (days) SMA Slow (days) SMA Reference (days) ROC Low (%) ROC High (%) Order Stake (%) Look back Candles

Count:101
Name: Position management strategy framework [LM]
Description: Hi Traders, This is backtest framework for position management of indicators based on systems that are used for position management of gambling systems. All examples describes situation that position unit is 100$ of given asset. For tracking there are used pinescript arrays. In all strategies I have built some max extremes for given strategy(not originaly part of...

Count:101
Name: Supertrend + Stoch Strategy Multi-pair Signal Alarm
Description: BITSTAMP:BTCUSD An entry alarm on Supertrend Stoch Strategy . It can monitor 10 trading pairs in one alarm. Use this script on any trading pair and deploy the alarm. The alert comment shows the pair name, direction, entry point, sl/tp, and percentage of your position you should cost. I currently use it as a signal for my grid trading.

Count:101
Name: Ultra Moving Average Rating Trend Strategy
Description: This is a technical analysis strategy based initially on the rating strategy, but fully adapted and converted to moving average rating. In this case we are using: Ichimoku, SMA, EMA, ALMA, SMMA, LSMA, VWMA, DEMA, HMA, KAMA FRAMA, VIDYA, JMA, TEMA, ZLEMA, TRIMA and T3 moving averages. With all of them together I am making an index. Rules for entry and exit: If %...

Count:101
Name: Noro's PCMA Strategy v1.0
Description: Strategy The blue line is PCMA - middle of a price channel. The lime line = PCMA - the shift parameter (%). Red line = PCMA + the shift parameter (%). Strategy uses limit orders. For opening of positions and for closing of positions. If the price is lower than the lime line - opens a long position. If the price is higher than the red line - opens a short...

Count:101
Name: Amazing strategy for silver -XAGUSD, XAGEUR etc
Description: Today I bring an amazing strategy that works for 1h time frames for silver. Its made of price actions movement combined together with MACD and simple moving average It does not use neither stop loss/take profit levels. Instead it will always exit at the next candle after it opens a trade. The rules are the next one : For short condition : we have a bull candle,...


Count:101
Name: Bollinger bubble | Forex edition
Description: Bollinger bubble is an edition for forex market. Work better en JPY pairs. We buy when a candle open & close outside the lower bollingers band and we target the last highest point on the last 10 candles. And we sell when a candle open & close outside the higher bollingers band we the target the last lowest point on the last 10 candles.

Count:101
Name: Forex MA Racer - SMA Performance /w ZeroLag EMA Trigger
Description: This strategy uses 5 Simple Moving Averages and 2 ZeroLag Exponential Moving Averages, to determine possible entries and exits. - Pretuned for Forex on 15m period - Uses SMA(10/20/50/100/200) and EMA(9/21) by default - Be cautios in sideward markets!

Count:101
Name: Tick Strategy
Description: Tick Strategy: Questions many pine coders/traders have is, How to enter/exit trade as soon as trade condition is met i.e. do not wait till candle completion to enter/exit the trade. This strategy will help you to understand one of the way to achieve it. This is an educational strategy to demonstrate, how one can trade based on tick data. This being a strategy...

Count:101
Name: Pair Trade crypto
Description: Pair trade for crypto with inputs: * length of correlation and moving average * trade pair * spread threshold to enter long / short * spread threshold to exit long / short


Count:101
Name: [M10] Quad MA Trend Scalper
Description: Four adjustable moving averages set in order to produce buy and sell signals, works best on smaller timeframes from my backtesting, 10M - 30M seems optimal for scalping. The idea behind this script is to only enter positions that are following the trend in order to minimise drawdown and decrease risk when using leverage. The script will only enter long...

Count:101
Name: Starbux
Description: I made this in starbucks . Bullish hammer trading signal algorithm using MACD for trend determination and holding period.

Count:101
Name: Stochastic Rsi+Ema - Auto Buy Scalper Scirpt v.0.3
Description: Simple concept for a scalping script, written for 5 minute candles, optimized for BTC. 1st script I've created from scratch, somewhat from scratch. Also part of the goal of this one is to hold coin as often as possible, whenever it's sideways or not dropping significantly. Designed to buy on the stochastic bottoms (K>D and rising, and <17) Then and sell...

Count:101
Name: Day of Week Custom Buy/Sell Strategy
Description: This strategy was made for bitcoin and allows you to back test longing or shorting for various days of the week. The price may tend to go in one direction or another for each week day, and this strategy allows you to test days across a range of dates to capitalize on this. Make sure you are on the daily time frame while viewing the performance and trade history...

Count:100
Name: Combo Backtest 123 Detrended Price Oscillator
Description: This is combo strategies for get a cumulative signal. First strategy This System was created from the Book "How I Tripled My Money In The Futures Market" by Ulf Jensen, Page 183. This is reverse type of strategies. The strategy buys at market, if close price is higher than the previous close during 2 days and the meaning of 9-days Stochastic Slow...

Count:100
Name: RSI Strategy
Description: Nothing special in this strategy its just purely and application of RSI in 1hour chart of XAUUSD.

Count:100
Name: F2.2 Martingale Magic Scalping
Description: 71% success rate on GBPUSD - 15min Chart. No other charts have been tested. This Martingale exits on trades if they are not performing so as to keep the draw down low.

Count:100
Name: Vortex Ocillator - backtesting
Description: backtesting strategy for the vortex oscilator indicator, slightly modified on this version so that the buy and sell signals work with the backtesting and are consistant original idea i posted by accident the script with alerts not intended to be financial advice, strategy is for made for testing Biffy

Count:100
Name: Volatility Finite Volume Elements Backtest
Description: This version has an important enhancement to the previous one that`s especially useful with intraday minute charts. Due to the volatility had not been taken into account to avoid the extra complication in the formula, the previous formula has some drawbacks: The main drawback is that the constant cutoff coefficient will overestimate price changes in...

Count:100
Name: Simple BTC trading strategy based on yesterday's trading range
Description: Once market opens, the strategy calculates the price to send a stop buy order The order is calculated as the sum of yesterday's range multiplied by a special number and today's open price System has no stops yet System closes the position on session close The performance is quite good Feel free to use it and trade it Good luck and good trading

Count:100
Name: Psychological line Backtest
Description: Psychological line (PSY), as an indicator, is the ratio of the number of rising periods over the total number of periods. It reflects the buying power in relation to the selling power. If PSY is above 50%, it indicates that buyers are in control. Likewise, if it is below 50%, it indicates the sellers are in control. If the PSY moves along the 50% area,...

Count:99
Name: Double MA Cross
Description: Strategy to open long/short positions based on the crossing of 2 different moving averages. Both moving averages are highly configurable: length, source, and moving average type can be changed.

Count:99
Name: Volatility Bands Reversal Strategy [Long Only]
Description: This strategy based on existng indicator available on TV If finds the reversals for LONG entries ... I have modified the settings to back test it ... BUY ==== When the price touches lower band , and tries to close above lower band some signals are mixed up, you can research and look for a confirmation ... if the middle band is above EMA50 , you can...

Count:99
Name: Strategy RSI | Fadior
Description: Simple strategy that buy and sell when RSI is under/above a given thresholds. Take profit is set to $3. Beware this strategy doesn't work with other assets.


Count:99
Name: SMI Ergodic Oscillator Strategy ver.2
Description: The SMI Ergodic Indicator is the same as the True Strength Index (TSI) developed by William Blau, except the SMI includes a signal line. The SMI uses double moving averages of price minus previous price over 2 time frames. The signal line, which is an EMA of the SMI, is plotted to help trigger trading signals. Adjustable guides are also given to fine tune...

Count:99
Name: D_DSP (Detrended Synthetic Price) Strategy 2 Backtest
Description: Detrended Synthetic Price is a function that is in phase with the dominant cycle of real price data. This DSP is computed by subtracting a half-cycle exponential moving average (EMA) from the quarter cycle exponential moving average. See "MESA and Trading Market Cycles" by John Ehlers pages 64 - 70. You can change long to short in the Input Settings ...

Count:99
Name: Forex Daytrade T3 MA session
Description: This is a simple yet very efficient daytrading strategy for most crosses pairs, like EUR/NZD, EUR/AUD , GBP/NZD, GBP/AUD and so on. It tends to works best with 1h and 15 min time frame charts. Its components are : Entry time = session that we want to trade, where we can combine for example half of London and all of NY using an hour system. T3 Moving...

Count:99
Name: A Strategy for Leledec
Description: This strategy used Leldec Script from Then tests what would have happened if one longed or shorted on the major exhaustion. I used 10% of the initial capital 10,000USD as an example This is only for educational and entertainment purpose. I do not suggest anyone to use this strategy.

Count:99
Name: Uptrend and Oversold Index Swing Trading System 8H
Description: --- Foreword --- The Overbought and Oversold Index Swing Trading System or short: I11L Hypertrend primarily uses money management Strategies, EMA and SMA and my momentum Ideas for trying to produce satisfactory Alpha over a timespan of multiple years. --- How does it Work? --- It uses 20 different EMA's and SMA's to produce a score for each Bar. It will credit...

Count:99
Name: Noro's Stochastic Strategy v1.1
Description: Uses: 1) Stochastic Momentum Index ("Use SMI-Strategy") 2) Fast RSI, period 7 ("Use RSI-Strategy") 3) SMA Body filter ("Use Body-filter")

Count:99
Name: PFE (Polarized Fractal Efficiency) Backtest
Description: The Polarized Fractal Efficiency (PFE) indicator measures the efficiency of price movements by drawing on concepts from fractal geometry and chaos theory. The more linear and efficient the price movement, the shorter the distance the prices must travel between two points and thus the more efficient the price movement. You can change long to short in the...

Count:99
Name: BT-SAR Ema, Squeeze, Volatility
Description: Esse script foi criado para estudo de Backtest. Ele usa o SAR PARABÓLICO como indicador de sinal de entrada, você também pode combinar 3 indicadores para filtrar as entradas: Média Móvel, Squeeze Momentum e Volatility Oscilator . Existe duas entradas, quando o SAR Parabólico vira ou pelo Breakout (usando o último preço) do SAR Parabólico antes dele...

Count:99
Name: HYE Trend Hunter [Strategy]
Description: *** Stratejinin Türkçe ve İngilizce açıklaması aşağıya eklenmiştir. HYE Trend Hunter In this strategy, two of the most basic data (price and volume) necessary for detecting trends as early as possible and entering the trade on time are used. In this context, the approaches of some classical and new generation indicators using price and volume have been taken...

Count:99
Name: Simple scalping strategy for SOL
Description: This is a simple scalping strategy for trading SOL made on top of the Rebalance Oscillator and the Rebalance Bear/Bull market indicators. It is intended mostly as proof that these two indicators have their benefits even in simpler strategies. This strategy in particular works well for the Bear months (check Nov. in the data window) but considerably...

Count:98
Name: Combo Backtest 123 Reversal & Bull And Bear Balance
Description: This is combo strategies for get a cumulative signal. First strategy This System was created from the Book "How I Tripled My Money In The Futures Market" by Ulf Jensen, Page 183. This is reverse type of strategies. The strategy buys at market, if close price is higher than the previous close during 2 days and the meaning of 9-days Stochastic Slow...

Count:98
Name: MACD Strategy
Description: BTCUSD -- 5 min BUY POSITION 1 : The price is above the EMA 2 : The macd line crosses above the line signal below 0 SELL POSITION 1 : The price is bellow the EMA 2 : The macd line crosses below the signal line above 0

Count:98
Name: MACD BTC Long/Short Strategy v1.0
Description: This strategy will use only default MACD with Simple MA(Signal Line) mode 'ON' to determine when it's time to long/short using its histogram value. Current version has 2 more entries added to increase more trades and profits along the way while maintaining low 'max drawdown' and high returns. Entry will be opened when macd line(blue) crossed with signal...

Count:98
Name: Combo Backtest 123 Reversal & Reverse Engineering RSI
Description: This is combo strategies for get a cumulative signal. First strategy This System was created from the Book "How I Tripled My Money In The Futures Market" by Ulf Jensen, Page 183. This is reverse type of strategies. The strategy buys at market, if close price is higher than the previous close during 2 days and the meaning of 9-days Stochastic Slow...

Count:98
Name: Rate Of Change Trend Strategy (ROC)
Description: This is very simple trend following or momentum strategy. If the price change over the past number of bars is positive, we buy. If the price change over the past number of bars is negative, we sell. This is surprisingly robust, simple, and effective especially on trendy markets such as cryptos. Works for many markets such as: INDEX:BTCUSD INDEX:ETHUSD ...

Count:98
Name: dP magnet
Description: //Strategy based on the idea that stop loss and take profit are often placed at full price levels or round numbers, whcih acts as resistance and supports levels //Buy Rules: //Actual price (close) is above round number. //Round number level was not touched in previous ten bars (arbitrary value). //Place a buy and follow the order with a trail step because price...

Count:98
Name: Noro's Color Strategy v1.1
Description: Strategy which doesn't look at the prices. This strategy is guided only by color of candles. In 1.1: + Min/Max


Count:97
Name: SMA Strategy
Description: SMA Strategy for going long or short when a short sma crosses a long sma. This script was published by CaptJava. I added to it the ability to select a back testing date range and choose to go long, short or swap orders. You can enter automated trading buy and sell messages in the properties and then put {{strategy.order.alert_message}} in your webhook alert...

Count:97
Name: Noro's Trend MAs Strategy 1.5
Description: Trade strategy which uses only 2 MA . The slow MA (blue) is used for definition of a trend The fast MA (red) is used for an entrance to the transaction For: - For H1 - For crypto/fiat Recomended: Long = true (if it is profitable as a result of backtests) Short = true (if it is profitable as a result of backtests) Type of slow MA = 7 (only for...

Count:97
Name: Bollinger Bands and RSI mix with DCA
Description: This strategy uses a mix of Bollinger Bands and RSI to enter long positions. It impliments DCA.

Count:97
Name: RSI scalping
Description: Look for trending market on higher timeframe with ADX and SMA Scalping with rsi shorter time frame

Count:97
Name: Smeared VCI Backtest
Description: This is the strategy with backtest date range and trailing-stop / stop-loss for vitelot's Smeared VCI indicator:

Count:97
Name: Athena Momentum Squeeze - Short, Lean, and Mean
Description: This is a very profitable strategy focusing on 15 minute intervals on the Micro Nasdaq Futures contracts. CME_MINI:MNQH2023 As this contract only keeps positions for on average about an hour risk is managed. At a profit factor of 3.382 with a max drawdown of $123 from January 1st to February 15. Looking back to Dec 2019 still maintains a profit factor of...

Count:97
Name: Combining Trailing Stop and Stop loss (% of instrument price)
Description: Both a trailing stop and a stop loss are necessary tools for every trader, for locking in as much profit in any given trade, while on the other hand minimizing the risks involved in trading. I started to write this scipt to give an answer to many traders who wanted these two tools combined, but didn't find any way to program this. TV has some shortcomings in the...

Count:97
Name: Bitfinex Shorts Strat
Description: Overview This strat applies the data from BITFINEX:USDSHORTS to the RSI indicator in order to provide SHORT/LONG entries as the number of contracts goes up and down. Although Bitfinex has lost relevance over the years its generally considered an exchange dominated by smart money rather than retail. I'd like to see if any insights can be gained by following...

Count:96
Name: Je Buurmans Simple Manual Entries
Description: If ever in need for a quick way to swiftly check some random trades or brag to your 'friends'/buddies/pals/haters/followers/the_crowd with fabricated winnings .. This Script is for you. Either set the entry and exit dates for a maximum of up to 10 trades (either Long or Short) via Menu or simply drag the 'handler' to the desired time/date. Next fill in how many...

Count:96
Name: RSI Long Term
Description: This strategy work good with long term ? but only can check this in 9 month's i am still working to see if it really works on 10 year data ( actually i still do not know how to do that in this site any idea ?) and increase the trade number

Count:96
Name: RSI Buy & Sell Trading Script
Description: This is my first attempt at a trading script using the RSI indicator for Buy & Sell signals (so please be nice but would appreciate any constructive comments). Starting with $100 initial capital and using 10% per trade You can select which month the backtesting starts There is also a monthly table (sorry can’t remember who I got this from) that shows the total...

Count:96
Name: Oath
Description: Oath consists of 21 and 55 EMA , Commodity Channel Index and Supertrend indicator. It confirms a trend and gives you a signal on a pullback. Original creation worked on 1h EURUSD chart. Oath is merely a rebrand of my previous Patient Trendfollower strategy. Unlike Patient Trendfollower, Oath has actually a good name and it does not fill your screen with...

Count:96
Name: Adaptive Zero Lag EMA v2 (Strategy w/ Backtest Date Range)
Description: This is a modified strategy including Date Range Selection for dasanc's incredible "Adaptive Zero Lag EMA v2": The Original:

Count:96
Name: Noro's Multima v1.0
Description: If the price of closing is more than SMA and more than EMA = to open a long-position If the price of closing is less than SMA and less than EMA = to open a short-position If the price of closing is between the SMA and EMA lines = to close any position

Count:96
Name: SMA EMA HMA VWMA Crossover Strategy
Description: This latest version allows you to backtest crossovers of any SMA EMA HMA or VWMA. Due to the number of orders limit, it will only work on higher timeframes, sometimes using it on a newer exchange with less history can overcome this.

Count:96
Name: AM_ZLWMA Crossover_x
Description: Dear All, Please find updated version of Zero lag WMA crossover. In addition to this added 20/50 EMA to get better results. Settings: ZLWMA = 8 identified by Blue line Fast WMA = 21 identified by Red line EMA Period 20/50 How to Trade: Buy: Wait for positive crossover (Blue cross above Red) to happen trade can be taken there but to get better results post...

Count:96
Name: ATR Long Only Strategy lower band buy
Description: ATR with ATR bands. Buy low band sell high band. Tested on weekly charts.

Count:96
Name: Crossing Ema 20:9 by Sedkur
Description: Ema9 : Ema 20 crossing signals! On daily chart...

Count:96
Name: Ichimoku Clouds - Basic Strategy
Description: Estratégia básica com Ichimoku Clouds. Mais para fins de estudos. Foi um dos primeiros Pine Scripts que escrevi, então a há muito o que melhorar no código. Basic Strategy using Ichimoku Clouds, developed for studying purpose. It was one one my first Pine Scripts codes, so yet there is a lot to improve on it.

Count:96
Name: Delayed RSI Strategy
Description: This strategy uses a 21 period RSI with an overbought (RSI indicator is greater than) level of 60 (user defined) to determines long entries and an oversold (RSI indicator is less than) level of 40 (user defined) for shorts. It introduces a bar delay that starts counting when the RSI < Oversold or RSI > Overbought conditions are true, delaying the entry with the...

Count:96
Name: Same high/low update
Description: Here I made a strategy out of my indicator. So, the trigger is double low/high on 1 week candle chart. Entrance: close of the next candle if it's low/high higher/lower than previous one. (in most cases it's precise for backtesting) Stop loss: long:low-one tick, short:high+one tick Take profit: ATR*Multiplier (you can tune it in properties)


Count:96
Name: Hausky Simple MA Strategy EURUSD 1H
Description: Here is my simple Moving Average crossover strategy for EURUSD 1H

Count:96
Name: Pure Mark Minervini 10%TP 5%CL
Description: Backtesting Mark Miniverni Template By Donnie Lee Overall, a good basic guideline from Mark Miniverni to choose which stock to buy. His selection are said to be stocks in stage 2 uptrend phase which could see price surge soon. This script enable backtesting of Mark template (Investor's Business Ranking Excluded) on equity like stocks Further fine tuning with...

Count:96
Name: Combo Backtest 123 Reversal & MovROC (KST indicator)
Description: This is combo strategies for get a cumulative signal. First strategy This System was created from the Book "How I Tripled My Money In The Futures Market" by Ulf Jensen, Page 183. This is reverse type of strategies. The strategy buys at market, if close price is higher than the previous close during 2 days and the meaning of 9-days Stochastic Slow...

Count:96
Name: Ehlers Cycle Strategy
Description: This uses Ehlers methods to create a cycle trading strategy. It finds the dominant cycle in the market, then creates filters out noise to create an oscillator. It then creates a trigger line using momentum to predict a reversal in price. Finally, Ehlers Empirical Mode Discriminator is used to evaluate trends and eliminate trading against the trend. Shout out...


Count:95
Name: Williams Accumulation/Distribution (Williams AD) Backtest
Description: Accumulation is a term used to describe a market controlled by buyers; whereas distribution is defined by a market controlled by sellers. Williams recommends trading this indicator based on divergences: Distribution of the security is indicated when the security is making a new high and the A/D indicator is failing to make a new high. Sell. ...

Count:95
Name: adx efi 50 ema channel, trend pullback
Description: Hi so this strategy is based off 50 ema channel and the 15 ma crossing it to generate signals. But with my adjusted strategy it's a 10 rma crossing 50 ema channels and a 5 and 9 wma to help see pullbacks. 50 period bollinger bands to gage volatility a0nd help during range markets. The strategy signals are generated when longer period efi is above 0 and shorter...


Count:95
Name: PtahX EMA/ATR Strategy
Description: PtahX EMA/ATR Strategy Public Release written October 2019 EMA Strategy with ATR & "Fear Factor" built in * modifications welcome * please let me know if you improve it so I can continue to learn :) * use at your own risk - I'm a new programmer and still learning * Best of luck on your trades!! // Take Profit (TP) option based on ATR or MA Crossover

Count:95
Name: Combo Backtest 123 Reversal & EMA & Volume Weighting
Description: This is combo strategies for get a cumulative signal. First strategy This System was created from the Book "How I Tripled My Money In The Futures Market" by Ulf Jensen, Page 183. This is reverse type of strategies. The strategy buys at market, if close price is higher than the previous close during 2 days and the meaning of 9-days Stochastic Slow...

Count:95
Name: Simple MACD strategy
Description: Simple macd strategy Rules: if MACD bullish crosses below 0 and above 200 EMA a buy signal is created if MACD bearish crosses above 0 and below 200 EMA a sell signal is created best settings for winrate and profit : 1. is taking 1:1 trades so with a tp of 2% and sl of 2% winrate is around 62%

Count:95
Name: [VJ]Phoenix Force of PSAR +MACD +RSI
Description: This is a simple intraday strategy for working on Stocks or commodities based out on PSAR, MACD , RSI and chop index . You can modify the start time and end time based on your timezones. Session value should be from market start to the time you want to square-off Important: The end time should be at least 2 minutes before the intraday square-off time set by your...

Count:95
Name: Strategy Myth-Busting #4 - LSMA+HULL Crossover - [MYN]
Description: This is part of a new series we are calling "Strategy Myth-Busting" where we take open public manual trading strategies and automate them. The goal is to not only validate the authenticity of the claims but to provide an automated version for traders who wish to trade autonomously. Our fourth one we are automating is one of the strategies from "I Found The Best 1...

Count:95
Name: Bull Power Strategy Backtest
Description: Bull Power Indicator To get more information please see "Bull And Bear Balance Indicator" by Vadim Gimelfarb.

Count:95
Name: Ehlers Stochastic Cyber Cycle Strategy
Description: By John Ehlers from his book "Cybernetic Analysis for Stocks and Futures".

Count:95
Name: Long/Short Volatility Algo
Description: A modification of my leveraged ETF algorithm. Giving out for free because it's a sloppy algorithm, and I personally use a much more refined algorithm developed by someone much smarter than me.

Count:94
Name: TFs Golden Cross - Status Box
Description: This simple strategy demonstrates the use of Pine Script version 4 "label" feature to show status box. This box can display anything, in this case it shows current market position, current profit and close price. It renders the box in green if profit is positive, red if negative and blue if neutral.

Count:94
Name: Help needed with strategy - Entry is off by 2 candles
Description: Hi, I'm new to TradingView, and would greatly appreciate some help with figuring out where I'm going wrong with this script. This is a overly simplified version of what I'm actually trying to do, but hopefully it's easier to see the problem. Here I'd like to create a Buy signal when the fast moving average crosses over the slow moving average, and Sell when the...

Count:94
Name: Combo Backtest 123 Reversal & Comparative Relative Strength
Description: This is combo strategies for get a cumulative signal. First strategy This System was created from the Book "How I Tripled My Money In The Futures Market" by Ulf Jensen, Page 183. This is reverse type of strategies. The strategy buys at market, if close price is higher than the previous close during 2 days and the meaning of 9-days Stochastic Slow...

Count:94
Name: EHMA Range Strategy
Description: This script is a modified version of @borserman's script for the Exponential Hull Moving Average All credit for the EHMA goes to him :) In addition to the EHMA, this script works with a range around the EHMA (which can be modified), in an attempt to be robust against fake signals. Many times a bar will close below a moving average, only to reverse again the...

Count:94
Name: Swing Stock designed for Monthly/Yearly Trading
Description: This is a strategy tester designed around the most important data from FRED - Federal Reserve Economic Data As input data, we have: // Personal Consumption Expenditures // Real Retail and Food Services Sales // Leading Index for the United States // All Employees: Total Nonfarm Payrolls // Real Gross Domestic Product // Gross Domestic Product I adapted the long...

Count:94
Name: Flex Renko Emulator Strategy by Zack_The_Lego
Description: The author of the study is Zack_The_Lego but i made it into a strategy because its an awesome study by him.

Count:94
Name: Binance Estimaed Liquidations indicator/strategy
Description: 1) Provides ESTIMATED liquidation amount based od difference on volume between binance futures and coinbase spot(by default, you can change this) 2) Provides some strategies based on this numbers
Count:94
Name: BankNifty_Bearish_Intraday
Description: The script uses following mechanism to give a signal of SELL if multiple parameters evaluated are all passed. ENTRY- 1. 5 min MACD should be less than its previous tick 2. 15 min MACD should be less than its previous tick 3. 60 min MACD should be less than its previous tick 4. ADX should be more than 12 5. RSI should be less than 40 6. Stochastic %k should...

Count:94
Name: Try to go long at a moving average
Description: A simple experimental strategy that tries to go long at a moving average bounce / support level, and looks for upside.

Count:94
Name: TEMA/HMA/VWMACD - Short Strategy 4H
Description: As we can discover by studying the history of BTCUSD, the fall is always swift. Confirmation of this - today's collapse. In this strategy, an attempt is made to catch such drop by using quick entry and quick exit. Let's describe what this strategy consists of: • TEMA (you can find this strategy separately on this page or on platform) • VWMACD • HMA •...

Count:94
Name: BarUpDn time limited
Description: trying to understand strategies, it appears that there is a lot of black magic in how a strat works behind the scenes. anyway, it's hard to analyse what's all the data with one gazillion entries, and i wanted to know how we can manipulate/do stuff with a chart. so, i needed to know how to "give" the script my values to work on. bundled two wants/needs into one,...

Count:94
Name: BV's MACD SIGNAL TESTER
Description: Hello ladies and gentlemen, Today, as you may have seen in the title, I have coded a strategy to determine once and for all if MACD could make you money in 2020. So, at the end of this video, you will know which MACD strategy will bring you the most money. Spoiler alert: we've hit the 90% WinRAte mark on the Euro New Zealand Dollar chart. I've seen a lot...

Count:94
Name: Confluence Strategy Backtest
Description: This is modified version of Dale Legan's "Confluence" indicator written by Gary Fritz. ================================================================ Here is Gary`s commentary: Since the Confluence indicator returned several "states" (bull, bear, grey, and zero), he modified the return value a bit: -9 to -1 = Bearish -0.9 to 0.9 = "grey" (and zero) 1 to...

Count:94
Name: Hull Moving Average based strategy
Description: This is a simple Hull Moving Average based strategy using a short term HMA for signal generation and a long term HMA for filtering purposes. A long entry is generated if the short term HMA changes direction from decreasing to increasing values and if the long term HMA indicates an uptrend (i.e. previous value < current value) A short entry is generated if the...

Count:94
Name: CCI with EMA Strategy
Description: I designed it as buy and sell when the cci 0 point cut, but you can optimize it by changing the buy sell points I used moving average to smooth out cci's movements

Count:93
Name: Bollinger Bands JMA with power arg
Description: Bollinger Bands and MA crossovers, all based on Jurik MA

Count:93
Name: Stock Gaps SPY Correlation Strategy
Description: This is daytrade stock strategy, designed to take the best out of the daily gaps that are forming between the close of previous day and opening of present day. At the same time its logic has been adapted for SPY chart, in order to use correlation with the other stocks/assets/ etf which are linked with SP500 movement. Lastly it has been added 2 new confirmation...

Count:93
Name: Previous Day High Low Strategy only for Long
Description: Welcome to the "Previous Day High Low Strategy only for Long"!. This strategy aims to identify potential long trading opportunities based on the previous day's high and low prices, along with certain market strength conditions. Key Features: Entry Conditions: The strategy triggers a long position when the current day's closing price crosses above the...

Count:93
Name: TFS: MBO Backtest
Description: MBO indicator is the third component of TFS trading system. This indicator was developed by Bryan Strain and Mark Whitley. The idea of MBO is similar to moving average convergence/divergence (MACD) indicator. It is calculated by subtracting the 200-day moving average from the 25-day moving average. You can change long to short in the Input Settings ...


Count:93
Name: Smooth Moving Average Ribbon [STRATEGY] @PuppyTherapy
Description: The Smooth moving average ribbon script is an enhancement of the script I posted yesterday. But will help you also create a very simple trend-following strategy or a simple trend-following filter. You are able to select from a large variety of moving averages add Heikin Ashi Candles as a source and also add additional smoothing to every single of the moving...

Count:93
Name: Wilder’s Moving Average Strategy
Description: The Wilder’s Moving Average indicator (Wilder’s Smoothed Moving Average ) was developed by Welles Wilder and introduced in his 1978 book, “New Concepts in Technical Trading Systems.” Mr. Wilder did not use the standard EMA formula; instead, the following formula is used: EMA = Input * K + EMA * (1-K), where K = 2 / (N+1). Then to find the Wilder’s Moving Average,...

Count:93
Name: London breakout GBPUSD daytrade
Description: Hello, First I want to WARN THAT YOU NEED A MINIMUM OF 30X LEVERAGE FOR THIS STRATEGY IN ORDER TO WORK. THE REASON IS THAT THE SIZE IS CALCULATED BASED ON A VERY SHORT STOP LOSS LEVEL IN PIPS UTILIZE IT AT YOUR OWN RISK This is a daytrading strategy, that's suited for GBPUSD 1H timechart. It a very simple strategy that utilizes 2 moving averages : a very fast...

Count:92
Name: BO - RSI - M5 Backtesting
Description: BO - RSI - M5 Backtesting -Rule of Strategy A. Data 1. Chart M5 IDC 2. Symbol: EURJPY B. Indicator 1. RSI 2. Length: 12 (adjustable) 3. Extreme Top: 75 (adjustable) 4. Extreme Bottom: 25 (adjustable) C. Rule of Signal 1. Put Signal * Rsi create a temporary peak over Extreme Top row61: peak_rsi= rsi >rsi and rsi >rsi and rsi rsi_top 2. Call Signal * Rsi...

Count:92
Name: Combo Backtest 123 Reversal & CMOaDisparity Index
Description: This is combo strategies for get a cumulative signal. First strategy This System was created from the Book "How I Tripled My Money In The Futures Market" by Ulf Jensen, Page 183. This is reverse type of strategies. The strategy buys at market, if close price is higher than the previous close during 2 days and the meaning of 9-days Stochastic Slow...

Count:92
Name: Cross impro test by Canundo Crossover Crossunder Tick values
Description: This is a script where I tried to check the following things: Even thought the tick of an asset is, for example 0.5, there are calculated prices, like SMA's that have even more decimals. Leading to crosses happening that for example happen at the same price. Consequently triggering totally useless in side markets. What happens if SMA values are restricted to...

Count:92
Name: Trailing Sell
Description: This script demonstrates how to do trailing sell. With this approach, given an exit signal, instead of selling directly, you just follow the price upwards (for long positions) and you sell when the price decreases by a small percentage. The order will be executed when the next bar is closed. This approach may increase the profits (slightly) in some strategies!...

Count:92
Name: ETH/BTC MMAs Daytrade strategy 15min UT 0.05% fees
Description: Played around with Moving Averages, with the goal to bounce on trendlines and trend reversals. Time Unit : 15 min Candle Type : Heikin Ashi Commission : 0.05% on trades (Binance fees) Initial capital : 1k € Do you think this could work?

Count:92
Name: Mean Reversion and Trendfollowing
Description: Title: Mean Reversion and Trendfollowing Introduction: This script presents a hybrid trading strategy that combines mean reversion and trend following techniques. The strategy aims to capitalize on short-term price corrections during a downtrend (mean reversion) as well as ride the momentum of a trending market (trend following). It uses a 200-period Simple...

Count:92
Name: [MACLEN] TRUE RANGE
Description: This is a true range (TR) based strategy with weighted moving average (WMA) smoothing to remove noise. In addition, it includes a risk management strategy using 4 "safes" in the same operation to always seek to make a profit. This is for evaluation only, and it is not recommended to use with real money. It is a work in progress. I read your comments.

Count:92
Name: Sto2 Stochastic RSI for Bitcoin
Description: Stochastic RSI based oscillator with a Rate of Change function added to avoid sideways movements. Designed around BTC/USD but may be useful elsewhere. INSTRUCTIONS Green = go long Red = go short White = No trade zone (sideways with not much volatility)

Count:91
Name: Logistic strategy
Description: This strategy is loosely based on the logistic function. This function is often used to model population growth. I used it here to model price change using the z-score of net volume as the parameter to the exponential function.

Count:91
Name: MACD DEMA STRATEGY
Description: A strategy based on ToFFF MACD DEMA indicator Even so , ı dont recommended using MACD DEMA alone. Combine its code with your favorite indicators. You can visit ToFFF's indicator :

Count:91
Name: Stupid strategy
Description: Strategy with simple stop-loss and take-profit in percentage. If last trade was a successful one then repeat it. If not successful - do a reversal trade.

Count:91
Name: Golden Cross Optimised For Reversal (by Coinrule)
Description: A moving average crossing is a common and widely adopted trading strategy. A short-term MA crossing above a long-term one provides the buy-signal. The opposite generates a sell-signal for the strategy. Although very popular, this strategy has some limitations that lead to frequent "false signals" and only a few very profitable trades. If the strategy provides two...

Count:91
Name: Bitlinc MARSI Study AST w/ Take Profit & Stop loss - beta 0.1
Description: This script is beta 0.1 - will update as soon as the script is tradable This script is based on AST on a 10 minute timeframe. You can change the asset and the timeframe for any asset you want to trade, but for it to work correct ALL settings have to be testes in the Strategy section of the TradingView. Each assets and timeframe require a different mixture of...


Count:91
Name: Oversold RSI with tight SL Strategy (by Coinrule)
Description: This is one of the best strategies that can be used to get familiar with technical indicators and start to include them in your trading bot rules. ENTRY 1. This trading system uses the RSI ( Relative Strength Index ) to anticipate good points to enter positions. RSI is a technical indicator frequently used in trading. It works by measuring the speed and change...

Count:91
Name: SMA EMA HMA VWMA Turning Point Strategy
Description: This strategy allows you to backtest entering and exiting a trade based on one definable SMA, EMA, HMA or VWMA changing direction.

Count:91
Name: smplondonclinic Strategy
Description: Hello my friend! I'm uploading the code for your strategy. I have included a feature in the settings menu called "Entry Direction" that you can use to isolate only longs, only shorts or have both directions at the same time for the backtesting. I have set the strategy to only open 1 position at a time, it will not open a new position unless the previous position...

Count:91
Name: Advanced Bollinger Bands Strategy
Description: Advanced Bollinger Bands Strategy Why is it an advanced Bollinger Bands Strategy? The purpose of Bollinger Bands is to provide a relative definition of high and low prices of a market. By definition, prices are high at the upper band and low at the lower band. This definition can aid in rigorous pattern recognition and is useful in comparing price action to...

Count:91
Name: Noro's Levels Strategy v1.0
Description: For: - "btc/usd", "eth/usd" - timeframe: 1h, 2h, 3h, 4h

Count:91
Name: Trend Breakout high/low #1
Description: What is the Trend Breakout high/low #1? This script uses the high/low of each fixed time period as a conditional judgment, and when the high/low is broken as a buy/sell signal, trying to capture a trend. How to use this script? Start date and Stop date: You can choose the date of the test. Trading cycle: Selected time period is used as the basis for determining...

Count:91
Name: RSI, EMA, SMA Trendtrading - Oil Daytrading 1H
Description: The Unitrend trading System produces trading recommendations on a pure Trend basis. It is a Score based system. --- How to use the System -- Simply adjust your capital you want to risk per trade and your TP Factor. The TP Factor is the multiple of your risked Capital, also known as Risk/Reward ratio. Furthermore you can toggle between a always Buy mode, to see...


Count:91
Name: MACD Strategy by Forbes
Description: Strategy นี้เขียนขึ้นมาจากบทความของนิตยสารธุรกิจ ชื่อดัง Forbes สำหรับผู้ที่อยากอ่านสามารถค้นหาได้โดยใช้คำค้นว่า Bitcoin Trading Strategy For Passive Investors สำหรับผู้ทีจะทอสอบ backtest ให้ตั้งค่า commission (หรือค่าธรรมเนียมการเทรดด้วย) เพื่อให้ผลลัพท์ใกล้เคียงกับความเป็นจริงมากที่สุด อย่างไรก็ตามจากการ backtest นั้น พบว่า Strategy นี้เหมาะกับ Timeframe Day...

Count:91
Name: Noro's Candles test
Description: Regularity of 62% for cryptocurrencies. Demo. "BTC/USD", Bitstamp, 2 bars - trades 1645 - long 66% - short 56% - all 61% "BTC/USD", Bitfinex, 2 bars - trades 1619 - long 68% - short 57% - all 62% "ETH/USD", Bitfinex, 2 bars - trades 1576 - long 65% - short 58% - all 61% "ETH/BTC", Bitfinex, 2 bars - trades 1598 - long 61% - short 62% - all 61% "XRP/BTC",...

Count:91
Name: Bollinger Pair Trade
Description: NYSE:MA-1.6*NYSE:V Revision: 1 Author: @ozdemirtrading Revision 2 Considerations : - Simplify and clean up plotting Disclaimer: This strategy is currently working on the 5M chart. Change the length input to accommodate your needs. For the backtesting of more than 3 months, you may need to upgrade your membership. Description: The general idea of the...

Count:91
Name: Trend Reversal / Potential pressure
Description: This strategy looks for potential trend reversals by looking at hammer candles (defined in the is_hammer and is_stick functions). After getting confirmation a trade is open with determined SL/TP. ATR is used to justify the volatility. Fine-tune the parameters for your specific use case.

Count:90
Name: Trendelicious Strategy
Description: A simple strategy based on Trendelicious indicator We go long when an uptrend started 2 candles ago. We close the position when an uptrend ended 2 candles ago. Parameters are just the required parameters for the indicator + backtest timeframe To avoid the noise and catch big uptrends, run on higher timeframes (4h, 1D ...) The script also contains a code to...

Count:90
Name: Wilder's Volatility Trailing Stop Strategy with various MA's
Description: For Educational Purposes. Results can differ on different markets and can fail at any time. Profit is not guaranteed. This only works in a few markets and in certain situations. Changing the settings can give better or worse results for other markets. This strategy is based on Wilder's Volatility System. It is an ATR trailing stop that is used for long term...

Count:90
Name: [BoTo] Pump&Dump Strategy
Description: This strategy uses only long positions. It isn't used short positions, it doesn't use marginal trade, it doesn't use a pyramiding. It is strategy uses only one indicator. Ourselves have constructed the indicator for cryptocurrencies. We called it 'Pump&Dump Ocsilator'. You can read as this indicator works here: Not usual stop Strategy uses 2 ways for...

Count:90
Name: Trend'n Stuff_(MA's and Trix)
Description: It's a simple trend following system. Play with the setups. Works best on 30min and up timeframes. Look at the code for better understanding.

Count:90
Name: Noro's RevBar Strategy
Description: Only long. RevBar = reversal bar Example (Wikipedia.org): upload.wikimedia.org Article: en.wikipedia.org Strategy RevBar = to open a long position Green candle (if close > open) = to close a position

Count:90
Name: Combined EMA & MA crossovers [CDI]
Description: Implementation of the strategy of moving averages crossings combining two fast and two slow that are used to confirm the entry. The purpose is to be able to quickly see a backtesting of the strategy by easily configuring the profit / loss percentage. In this script the profit percentage is used for the loss percentage as well. Additionally you can see the...

Count:90
Name: Moving Average Ribbon strategy [2H timeframe]
Description: Moving average based strategy. This strategy basically buys when close price of n previous + current candle is above ribbon and sells when below. You can change the type of MA directly in the parameters. Best use on 2H TF.

Count:90
Name: Chande Momentum Strat (Crossover)
Description: This is a Chande Momentum strategy that buys and sells when the line crosses the buy and sell lines. Different signal then the other Chande Momentum strategy. In my opinion they both work better at different time frames and possibly commodities.

Count:90
Name: Crypto MF S/R Strategy - cespanol
Description: This strategy uses the Crypto_MF SR indicator to autogenerate horizontal support/resistance lines. The strategy involves alerts for buying when price tests support lines and selling when price tests resistance lines. The time filter was added to backtest specific dates and fine tune the inputs for best results. Credit to Crypto_MF for original source code and...

Count:90
Name: ARCHENS SHARES
Description: This script marks the high and low of 9.45 to 10.15 price. When the price breaks high, then gives Buy signal. When the price breaks low, then it gives Sell Signal. These buy and sell signals are given with labels "ARCHENS BUY" or "ARCHENS SELL". With my observation in stock market, I have made this strategy. This strategy works in normal candle pattern but i...

Count:90
Name: SMI Ergodic Oscillator Backtest ver.2
Description: The SMI Ergodic Indicator is the same as the True Strength Index (TSI) developed by William Blau, except the SMI includes a signal line. The SMI uses double moving averages of price minus previous price over 2 time frames. The signal line, which is an EMA of the SMI, is plotted to help trigger trading signals. Adjustable guides are also given to fine tune...

Count:90
Name: Daily Close repainting results
Description: it's a repainting script cheating on tester, on backtesting %100 correct but on forward testing it will only work % 15 correct and %85 wrong. I did another script showing real forward testing results of this script.

Count:90
Name: Percent change bar chart Strategy Backtest
Description: This histogram displays price or % change from previous bar. Can be applied to any time frame. This strategy buy if value above 0 and sell if value below 0. You can change long to short in the Input Settings Please, use it only for learning or paper trading. Do not for real trading.

Count:90
Name: Rainbow Oscillator Backtest
Description: Ever since the people concluded that stock market price movements are not random or chaotic, but follow specific trends that can be forecasted, they tried to develop different tools or procedures that could help them identify those trends. And one of those financial indicators is the Rainbow Oscillator Indicator. The Rainbow Oscillator Indicator is...

Count:90
Name: Highest/Lowest Center Lookback Strategy
Description: Basicaly long when price above middle of highest and lowest price in lookback period.

Count:89
Name: Noro's Bands Day Strategy v1.0
Description: For: - Crypto/Fiat - D1 timeframe - Only long

Count:89
Name: Sb_Rate_Of_Change_BB_Band_strategy Version 1.0
Description: The strategy couples the concept of rate of change along with the Bollinger bands. Along with it LazyBear's RSI/MFI with Volatility Indicator is also taken to reduce the number of trades and improve efficiency. Strategy (in Layman terms): If in the past 10 candles RSI/MFI with Volatility Indicator has printed a red/green colour and the roc has gone...

Count:89
Name: RSI Etoro Strategy
Description: Tmp (WIP) just for my bro Manu ;) BTW "Used" on COPPER Not Good because only one indicator: miss several phenomenon so go to SL stupidly... And fine tuning of parameters is too sensible: it should be adjusted following feedback from other indicators... Good thing is it takes into account the etoro context (SL at 50%, spread of 3 ticks) and you can back test with...

Count:89
Name: Momentum Strategy, rev.2
Description: This is a revised version of the Momentum strategy listed in the built-ins. For more information check out this resource: www.forexstrategiesresources.com

Count:89
Name: EMA50 3 min
Description: simple strategy with 3 min candles and 76% profitable orders major pairs recommended


Count:89
Name: RSI+PA+PrTP
Description: Hi everybody, This strategy is a RSI, Price Averaging, Pyramiding Strategy based on the earlier RSI+PA+DCA strategy. See below. For this slightly different strategy I left the DCA option out and instead focused on the Take Profit calculation. In the previous strategy the Take Profit was directly connected to the Average Price level with a specified take...

Count:89
Name: Trend #2 - BB+EMA
Description: What is the Trend #2 - BB+EMA? This strategy uses a combination of Bollinger Bands and Exponential Moving Averages, and adds the position management skills. When a position is established, if the price moves in the wrong direction, EMA will move the stop price closer to the opening price, which will reduce losses during the shocks. If the price moves in the right...

Count:89
Name: Linear trend
Description: Simple way how to use Linear Regression for trading. What we use: • Linear Regression • EMA 200 as a trend filter Logic: Firstly we make two different linear regression movings as oscillator. For this we need to subtract slow moving from fast moving, so we get the single moving around zero. This is the green/red line which appears on the chart. The trade open...

Count:89
Name: Double EMA & ALMA Strategy
Description: The ALMA (50 period) acts as the main trend filter, meaning that long positions are taken above the ALMA and short positions are taken below the ALMA. For instance, the 5 and 10 period exponential moving averages are added on the chart to give early signals to the trend. Therefore, when the 5/10 EMA triggers a bullish crossover, long signals are taken when price...

Count:89
Name: Momentum - Strategy Script
Description: Based on the bult-in momentum script, I took the liberty of updating it, adding two features. First, I would like to see the momentum oscillator showing percentage values, rather than absolute values. Visually facilitating analysis in long-term graphs. Second, just for fun*. I don't know how to explain the reason exactly, but for the strategy bult-in script, I...

Count:89
Name: LSX: Mystery BTC strategy with 100% hit rate
Description: I said in the main crypto chat, that it was easy to create a BS strategy with a 100% profit rate, so here's the proof. Looks awesome right? I can promise you, if you trade with this, it will sooner or later blow your account. Keeping the inner workings of it a secret, just like the scammers do. Why am I publishing this? To show why investing in these 'mystery...

Count:88
Name: MovingAvg Cross
Description: A moving average script for scalp trading on cryptocurrencies.

Count:88
Name: The Z-score
Description: The Z-score, also known as the standard score, is a statistical measurement that describes a value's relationship to the mean of a group of values. It's measured in terms of standard deviations from the mean. If a Z-score is 0, it indicates that the data point's score is identical to the mean score. Z-scores may be positive or negative, with a positive value...

Count:88
Name: Open Price Strategy
Description: This strategy is based on the idea of buying off the open price and then holding until the end of the trading day. It will however swap if price crosses over the open price line. It will plot a line based on the open price at the time you select for it to search for the open price. You can also select the open price source and time frame. Next select your entry...

Count:88
Name: Rainbow Oscillator [Strategy]
Description: Strategy based on Rainbow Oscillator .:: Features ::. Takes and Stops in percent Configurable indicator iside .:: Long condition ::. Indicator line is green (mean uptrend) and crossing averages generated from oscillograph signal fast is go up and crossing slow .:: Short condition ::. Indicator line is red (mean downtrend) and crossing averages...

Count:88
Name: GoldenCross by Puffy
Description: This is a simple trading strategy that seeks the Golden Cross and Death Cross on the 4HR chart. The fast moving indicator in this strategy is the EMA 50 and the slow moving indicator is the EMA 200. When the EMA 50 crosses over the EMA 200 the strategy indicates a buy. When the EMA 50 crosses below the EMA 200 the strategy indicates a sell. This strategy...

Count:88
Name: Ichimoku 4H crypto strategy -- LONG ONLY
Description: This is a LONG ONLY strategy for 4h timeframe of any Cryptocurrency/USD pairs. The strategy opens only 1 position at a time with the following conditions. Open Long Position when: 1. Closed price above cloud AND 2. Green cloud ahead AND 3. Conversion line above Baseline AND 4. Lagging span above cloud and price action AND Close trade when: 1. Lagging span gets...

Count:88
Name: [New series!] [Consistent Losing Strategies] 34 EMA Scalping
Description: //---------------------------INTRO------------------------------ Hi All! Let me introduce myself as a semi-successful forex trader & lover of automation. I've taken to algo trading and have been hunting down strategies (that usually use indicators) to automate, backtest, and hopefully implement in MT4. Unfortunately, most strategies are complete bulls*** and the...

Count:88
Name: emasma
Description: EMA13 and SMA30 crossovers. Good when the market is very volatile.

Count:88
Name: HYE Combo Market [Strategy] (Vwap Mean Reversion + Trend Hunter)
Description: In this strategy, I used a combination of trend hunter and vwap mean reversion strategies that I published before. Trend Hunter Strategy: Mean Reversion Vwap Strategy: The results are quite impressive, especially for bitcoin. While the hodl return for bitcoin was 13419%, the strategy's return in the same period was about 5 times (65000%) of this. ...

Count:88
Name: 50/100/200 Moving Average Strategy
Description: Buy on 50SMA crossover 100 sell when 100 case under 200

Count:88
Name: WMA + MACD strategy with trailing stop
Description: Hi! That's my first strategy. I already learn pine, so i will work on it more. Now i search how to make trailing stop working. "WMA + MACD strategy with traiing stop" is very simple strategy which is designated for stocks market. It is created only to take long positions. Buy signal is when WMA(120) is below price and macd(10,20,10) histogram is higher than...

Count:88
Name: Smoothed Waddah ATR
Description: ~~~All Credit to LAZY BEAR for posting the original Script which is an old MT4 indicator.~~~~ No this system does not repaint... if it does let me know. Either the code is wrong or you are using a repainting chart such as renko candles. *PURPOSE* This Is an "Enhanced or Smoothed" version of the script that captures the heiken-ashi closing price as its main...

Count:88
Name: Adaptive Price Channel Strategy
Description: This strategy is an adaptive price channel strategy based on the Average True Range (ATR) indicator and the Average Directional Index (ADX). It aims to identify sideways markets and trends in the price movements and make trades accordingly. The strategy uses a length parameter for the ATR and ADX indicators, which determines the length of the calculation for...

Count:87
Name: ddosok10 1min start
Description: (1볼추 매매법) 1분봉 볼밴 +3% 매매 체크 (유튜버 리또속10) +거미줄 200틱마다 걸어놓기(익절+3 지정) 상단 볼밴 찍고 중앙선 터치 후 캔들 종가가 중앙선 아래에 있을때 숏 진입 후 하단 볼밴 터치할때쯤 익절(+3% 지정) (허리에 들어가 무릎에 팔기) 하단 볼밴 찍고 중앙선 터치 후 캔들 종가가 중앙선 위에 있을때 롱 진입 후 상단 볼밴 터치할때쯤 익절(+3% 지정) (허리에 들어가 가슴에 팔기) * 포지션 동시 2개들어가서 하나 익절 하나 들고가기도 가능

Count:87
Name: Commodity Selection Index Backtest
Description: The Commodity Selection Index ("CSI") is a momentum indicator. It was developed by Welles Wilder and is presented in his book New Concepts in Technical Trading Systems. The name of the index reflects its primary purpose. That is, to help select commodities suitable for short-term trading. A high CSI rating indicates that the commodity has strong trending...

Count:87
Name: Chimichangas
Description: TradingView has released fractional contracts for cryptocurrencies. Very cool, very swag. This script is to see how it works, and to test the efficiency of position sizing. (I would like to see % based stops or take profits instead of ticks added too)


Count:87
Name: Range Action Verification Index (RAVI) Backtest
Description: The indicator represents the relative convergence/divergence of the moving averages of the financial asset, increased a hundred times. It is based on a different principle than the ADX. Chande suggests a 13-week SMA as the basis for the indicator. It represents the quarterly (3 months = 65 working days) sentiments of the market participants concerning...

Count:87
Name: Dazzling Bolts
Description: This is three moving average based strategy focused on trend-following. Targets and stops are set based on ATR. Following image pictures the strategy with all mas plotted: Buying conditions are: ►A smoothened moving average (red) is above the exponential moving average (yellow) ►An exponential moving average is above simple moving average (black) ►Low...

Count:87
Name: Fractal Chaos Oscillator Backtest
Description: The value of Fractal Chaos Oscillator is calculated as the difference between the most subtle movements of the market. In general, its value moves between -1.000 and 1.000. The higher the value of the Fractal Chaos Oscillator, the more one can say that it follows a certain trend – an increase in prices trend, or a decrease in prices trend. Being an...

Count:87
Name: PC with ATR Strategy (by Zhipengcfel)
Description: This strategy came out with the request of @SumitJain and helpful discussion with @Bonavest. The strategy link is here. prnt.sc I changed a bit. DH and DL use the previous day's high and low to avoid repainting. The results are not too bad. But I still suggest not to be used for real auto trading.

Count:87
Name: Free Friday #19 from Build Alpha
Description: www.buildalpha.com Was poking around this website that had a lot of interesting ideas and strategies to look at, decided to build this one here since it's pretty quick and easy scalping strategy, was built for IWM but I had SPY open and so why not haha. I remove the day of month filter as I felt like that may have been curve fitting the strategy since I can't...

Count:87
Name: Simple_Pyramiding
Description: A simple Pyramiding / DCA Strategy. Everyday at a specified time a position is opened. The individual position is closed when a take profit is triggered. Optionally a stop loss can be activated, or the option to close the position at the and of the time frame. You can specify the max amount of open positions. The equity will be divided through the max amount of...

Count:87
Name: Combo Backtest 123 Reversal & Detrended Synthetic Price V 2
Description: This is combo strategies for get a cumulative signal. First strategy This System was created from the Book "How I Tripled My Money In The Futures Market" by Ulf Jensen, Page 183. This is reverse type of strategies. The strategy buys at market, if close price is higher than the previous close during 2 days and the meaning of 9-days Stochastic Slow...

Count:87
Name: Donchian Trend V1
Description: The Donchian Trend strategy is a trend-following approach that uses the Donchian Channels indicator to identify potential entry and exit points in a security. The Donchian Channels are formed by taking the highest high and the lowest low prices over a specified period and plotting them as upper and lower channels around the current price. The width of the channels...

Count:87
Name: Combo Backtest 123 Reversal & Kase Dev Stops
Description: This is combo strategies for get a cumulative signal. First strategy This System was created from the Book "How I Tripled My Money In The Futures Market" by Ulf Jensen, Page 183. This is reverse type of strategies. The strategy buys at market, if close price is higher than the previous close during 2 days and the meaning of 9-days Stochastic Slow...

Count:86
Name: EMA STRATEGY
Description: Modified by KIVANCfr3762's A2MK plot script to strategy script

Count:86
Name: Demand Index Strategy
Description: Demand Index Strategy Goes Long if Indicator is > 1 Goes Short if Indicator is < 1 I have no clue how and when to use it. Please message me if you found something.


Count:86
Name: Triple SMA Strategy with entries based on sma price closes
Description: Hi! :) This strategy is made for intraday trades, especially on 5 sec - 5 min charts to follow the trend. I have not tested on higher timeframes, but feel free to play with the values. I have set a basic value for the 3 SMA at -200 -400 -600 We will use an oscillator for entries which is not mine. Link -> The oscillator mentioned above is just for...

Count:86
Name: 8 Day Extended Runs
Description: Inspired by Linda Bradford Raschke. Strategy suited to the US T-note (ZN1!) with a t-test of 4.06. The 5 day SMA is vital to Linda’s trend identification system. She’s done extensive testing and research using this indicator and has built models based on it. Linda used the 5 day SMA to determine that large outlier price moves happen in the direction of the trend...

Count:86
Name: Momentum Long Strategy
Description: This is a momentum indicator strategy that plots 2 lines on the momentum indicator and if both cross above zero a long entry is generated and if both cross below zero a long exit is generated. It also has code to check and make sure the condition is still true when launching the official alert, which helps back testing and live results line up, however be sure to...

Count:86
Name: Slow Stochastic Multi K&D Average Crossover Strategy
Description: Uses average of multiple fib lookback periods in stochastic format.

Count:85
Name: RSI2 BTCUSD Sell Strategy (Erroneously Profitable)
Description: I put this strategy here to attract the attention of someone and see if he finds the error in the code that leads to error in the calculation.
Count:85
Name: Cycles Strategy
Description: This is back-testable strategy is a modified version of the Stochastic strategy. It is meant to accompany the modified Stochastic indicator: "Cycles". Modifications to the Stochastic strategy include; 1. Programmable settings for the Stochastic Periods (%K, %D and Smooth %K). 2. Programmable settings for the MACD Periods (Fast, Slow, Smoothing) 3. Programmable...

Count:85
Name: EMA/ADX/VOL-CRYPTO KILLER [15M]
Description: A tester indicators for BTC and all alt coin. This is a start. If anyone can make an alert for this sript, i'll be happy though..

Count:85
Name: Noro's Week Strategy v1.0
Description: The line - the price of opening of a week candle If low of a candle is higher than the line - open long-position If high of a candle is lower than the line - open short-position

Count:85
Name: Trading range display with Box
Description: This script is just for reference to see the trading range. Do not use this strategy logic, it is just Test strategy. The trading range is colored depending on whether it is profitable or not. You can change the color if you want. When you declare the strategy, put (process_orders_on_close=true,calc_on_every_tick=true, max_boxes_count=500) in your script. Then it...

Count:85
Name: P-Signal Strategy & Alert
Description: Thanks to your advices I removed in this version something that was not necessary for the strategy but added alert and the chart of the current state of the strategy (white 1 - in trade, 0 - out of trade).

Count:85
Name: GoldFinger .007
Description: Goldfinger. He's the man, the man with the midas touch. A spider's touch. Such a cold finger. Beckons you to enter his web of sin But don't go in.

Count:85
Name: Prime Number Bands Backtest
Description: Determining market trends has become a science even though a high number or people still believe it’s a gambling game. Mathematicians, technicians, brokers and investors have worked together in developing quite several indicators to help them better understand and forecast market movements. The Prime Number Bands indicator was developed by Modulus...

Count:85
Name: © Investoz trendwarning
Description: The indicator is built as an educational purpose and is therefore not a recommendation for buying/selling shares. The idea is to create a visual form in a graph that shows if there is any trend, both positive and negative. A dialog box with a warning tells you what trend prevails. In the code, there is an opportunity to take a position or go out of position if...

Count:85
Name: KISS Strategy: SMA + EMA
Description: //Hello my fellow investors //I am creating a simple non-cluttered strategy that uses 3(+1) simple means to determine: viability, entry, and exit //1) Has a consistent trend been maintained for several days/weeks //2) SH SMA crossover LG SMA = Bullish entry/LG SMA crossover SH SMA = Bearish entry //3) Use the Slope factor & Weeks in Trend (WiT) to dertermine how...

Count:85
Name: Altcoin correlation Meter
Description: Dear TV'ers, Hereby a script where the relative strength of an (in this case) altcoin is measured. The script produces a correlation between the altcoin and total altcoin market (Total2 index, see script). Using this script you can see when there is a strong correlation between the two and when there isn't. Moreover, it also produces long/short signals using hull...

Count:85
Name: Mean reversion
Description: Simple mean reversion strategy. Strategy aims to find three bullish or bearish candle pattern which ends with strong move. Position will be open until we get close above previous highs. Strategy uses also simple moving average to filter short positions. This strategy works well with QQQ and daily time frame but it seems to do fairly well intraday also. User...

Count:85
Name: Positive Bars % Strategy
Description: Based on the calculations by ZenAndTheArtOfTrading. I added stop loss, take profit and reverse code lines. The Positive Bars % calculates the number of green (positive) bars, relative to a look back period, defined by the user. If the percentage is low, it means that there was a bigger number of red candles in the lookback period. The strategy goes long when the...


Count:85
Name: Ehlers MESA Adaptive Moving Average [LB + ekoronin fix] Alert
Description: Ehlers MESA Adaptive Moving Average Alert

Count:84
Name: Chanu Delta RSI Strategy
Description: This strategy is built on the Chanu Delta RSI , which indicates the strength of the Bitcoin market. The problem with the previous Chanu Delta Strategy was that it was simply based on the price difference between the two Bitcoin markets, so there was no universality. However, this new Chanu Delta RSI strategy solves the problem by introducing an RSI that compares...

Count:84
Name: Investing - Weekly EMA's mapped to Daily Chart
Description: When there isn't enough time in your day to day-trade, yet you want to utilise all the technical analysis skills you have... why not make a long term investing or swing trading indicator set to help you along the way! So I did.... When it comes to long term investing and swing trading, I often find the weekly 12/26/52 EMA's do a great job in capturing the main...

Count:84
Name: TASC 2023.09 The Weekly Factor
Description: █ OVERVIEW TASC's September 2023 edition of Traders' Tips features an article written by Andrea Unger titled “The Weekly Factor", discussing the application of price patterns as filters for trade entries. This script implements a sample trading strategy presented in the article for demonstration purposes only. It explores how the strategy's equity curve might...

Count:84
Name: Combo Backtest 123 Reversal & Pivot Detector Oscillator
Description: Copyright by HPotter v1.0 20/04/2021 This is combo strategies for get a cumulative signal. First strategy This System was created from the Book "How I Tripled My Money In The Futures Market" by Ulf Jensen, Page 183. This is reverse type of strategies. The strategy buys at market, if close price is higher than the previous close during 2 days and the...


Count:84
Name: Noro's Anti RSI Strategy v1.0
Description: For: - Crypto/Fiat - 1h, 2h, 3h, 4h timeframes

Count:84
Name: Bull And Bear Balance Strategy Backtest
Description: This new indicator analyzes the balance between bullish and bearish sentiment. One can cay that it is an improved analogue of Elder Ray indicator. To get more information please see "Bull And Bear Balance Indicator" by Vadim Gimelfarb. This modified strategy backtest from HPotter

Count:84
Name: Bat MACD
Description: Works on Bullish divergence indicators and is identical to MACD during an uptrend, works best on 2H or higher timeframes. Incorporates a SL which can be changed at will. SL is also used as a buy signal on lower timeframe crossovers. Uses 6H MACD to differentiate between up and downtrends. Recommend to take profits at pivots, trendlines instead of strategy's...

Count:83
Name: PowerX Strategy Backtest
Description: This script implements the Power X trading strategy by Markus Heitkoetter and Rockwell Trading. The strategy is described in detail in "The PowerX Strategy: How to Trade Stocks and Options in Only 15 Minutes a Day" written by Markus Heitkoetter. The Power X trading strategy uses RSI, Slow Stochastic and MACD indicators. When RSI and Slow Stochastic are both...

Count:83
Name: RSI_Boll-TP/SL
Description: This strategy is originally "Bollinger + RSI , Double Strategy (by ChartArt)" I added just TP/SL exit point, position direction selection(long, short or both) and time window into that strategy.

Count:83
Name: TEMA/MAMA Cross
Description: This is a strategy based on the TEMA and Ehler's MAMA moving averages. Crosses of the fast and slow TEMA are commonly used for entry and exit strategies. The Ehler's Mesa Adaptive Moving Average is a trend-following price indicator that uses a Hilbert Transform. Having plotted both TEMA and eMAMA side-by-side for some time, I noticed a pattern where the...

Count:83
Name: WEEKLY BTC TRADING SCRYPT
Description: Weekly BTC Trading Scrypt(WBTS) This script is only suggested for cryptocurrencies and weekly buying strategy which is long term.Using it in another markets(e.g forex,stock,e.t.c) is not suggested. The thing makes it different than other strategies we try to understand bull and bear seasons and buying selected crypto currency as using formula if weekly closing...

Count:83
Name: High & Low Pivot Strategy v1.0
Description: A system that determines what direction the market is trending by analysing previous high and low pivot points to set up an entry trade.

Count:83
Name: CCI Level Zone
Description: This strategy uses CCI 1000 as zones Buy sell if greater than level 100. will be seen as an uptrend If it's lower, it's a downtrend. So we will use RSI. To trade in its zones, using the RSI crosses the level line, and when the RSI crosses the level line, it waits to buy with Stochastic.

Count:83
Name: Smoothed RSI Backtest ver.2
Description: This is new version of RSI oscillator indicator, developed by John Ehlers. The main advantage of his way of enhancing the RSI indicator is smoothing with minimum of lag penalty. You can change long to short in the Input Settings WARNING: - For purpose educate only - This script to change bars colors.

Count:83
Name: %-[Guz] Vortex Indicator Custom
Description: // Custom Vortex Strategy (backtester) // Custom version of the Vortex indicators that adds many features: // -Triggers trades after a threshold is reached instead of the normal vortex lines cross (once the difference between the 2 lines is important enough) // -Smooths the Vortex lines with an EMA // -Adds Take Profit and Stop Loss selection // -Adds the...

Count:83
Name: Fake Strategy
Description: THIS IS A FAKE STRATEGY. PLEASE DO NOT USE THIS FOR TRADING. Just publishing this to display how easily you can fake backtest results in the strategies. However, there are ways to identify the scams. Let's discuss about major red herrings in a strategy. How to identify them and stay away from them. Any strategy which proclaims significantly high win rate (such...

Count:83
Name: Open Close Cross Strategy // Real Back Test // Not good
Description: I changed close series because, close series doing repaint. I changed the near series with the previous open series . but can use for sup and resistance

Count:83
Name: Daily PercentR Strategy
Description: The PercentR strategy from Larry Williams is highly profitable on the daily nasdaq chart Buy at the open if PercentR Indicator is above –87 and below –20 Exit at the end of the day.

Count:83
Name: [tradinghook] - Renko Trend Reversal Strategy V2
Description: Title: Renko Trend Reversal Strategy Short Title: - Renko TRS > Special thanks to for manually calculating `renkoClose` and `renkoOpen` values in order to remove the infamous repaint issue Description: The Renko Trend Reversal Strategy ( - Renko TRS) is a powerful and original trading approach designed to identify trend reversals in financial markets using...

Count:83
Name: 255 EMA Strategy
Description: //--- From 15 Trading Examples by Trader Alyx --- // Seems like this strategy works better if we reverse the EMA filter logic. // "Description: This basic scalping strategy allows you to enter the market based upon sentiment // provided by the EMA, set at 255 periods. When price is trading below the 255 EMA, you would // look to enter a LONG BUY positions, and...


Count:82
Name: Stochastic & MACD Strategy Ver 1.0
Description: This strategy is inspired by ChartArt and jasonluk28. The following input changes from the initial ChartArt version to achieve higher stability and profit: Fast MA Len:11 Slow MA len: 24 Stoch Len: 20 No difference is found in minor changes (+-10) lv. of overbought/oversold It works above 40% winning rate in Heng Heng Index, Shanghai Composite, Dow Jones...

Count:82
Name: Noro's Trend SMA Strategy
Description: Trade strategy which uses only 2 SMA. The slow SMA (blue) is used for definition of a trend The fast SMA (red) is used for an entrance to the transaction For H1

Count:82
Name: CCI-RSI MR
Description: Indicators: Bollinger Bands (20 period, 2σ) RSI (14 period) and Simple moving average of RSI (5 period) CCI (20 period) SMA (5 period) Entry Conditions: Buy when: Swing low (5) should be lower than the highest of lower BB (3 periods) Both RSI crossover RSI_5 and CCI crossover -100 should have happened within last 3 candles (including the current candle) Once...

Count:82
Name: EMA Crossover Strategy Example
Description: This is a script written as an example of how to build a simple strategy with user-defined inputs based on a simple Moving Average crossover. -- This indicator is used for backtesting Moving Average crossover strategies (only for long trades). A "short" and "long" moving average period and calculation method (the "smoothing type") are user-adjustable. The...

Count:82
Name: Trend Trader AVR Backtest
Description: This is plots the indicator developed by Andrew Abraham in the Trading the Trend article of TASC September 1998 It was modified, result values wass averages.

Count:82
Name: Combo 2/20 EMA & Bandpass Filter
Description: This is combo strategies for get a cumulative signal. First strategy This indicator plots 2/20 exponential moving average. For the Mov Avg X 2/20 Indicator, the EMA bar will be painted when the Alert criteria is met. Second strategy The related article is copyrighted material from Stocks & Commodities Mar 2010 WARNING: - For purpose educate only -...

Count:81
Name: SMI Ergodic Oscillator Backtest
Description: The SMI Ergodic Indicator is the same as the True Strength Index (TSI) developed by William Blau, except the SMI includes a signal line. The SMI uses double moving averages of price minus previous price over 2 time frames. The signal line, which is an EMA of the SMI, is plotted to help trigger trading signals. Adjustable guides are also given to fine tune...

Count:81
Name: Chande Forecast Oscillator Backtest
Description: The Chande Forecast Oscillator developed by Tushar Chande The Forecast Oscillator plots the percentage difference between the closing price and the n-period linear regression forecasted price. The oscillator is above zero when the forecast price is greater than the closing price and less than zero if it is below. You can change long to short in the...

Count:81
Name: Cipher_B (Finandy support)
Description: In this version of the script you can force to cancel your position after some amount of time indepedently on price action. For example, your bot open a short position with SL=1% and TP=2.4% but price did not reach any of this level over the course of to say 8 hours. In this case, position will be closed regardless of the price. Other interesting features are...


Count:81
Name: Donchian Backtest
Description: Executes backtest using donchian channels breakout strategy (buy on upper breakout / sell on lower breakout) Donchian period can be customized differenly for upper and lower channels

Count:81
Name: Decision BF
Description: For XBT/USD pairs. Based on Decision Point oscillator by LazyBear. I added a Rate of Change component based on code by kiasaki - this stops trading in a sideways market. You can adjust stop loss and take profit values in the settings. INSTRUCTIONS Go Long when the background turns from red to green Go Short when the background turns from green to red Do...

Count:81
Name: Stochastic & MA
Description: This trading system comes from the experience of having a "fast" signal for entry at low prices (such as the stoscastic) and then "following" the stock with a "slower" indicator such as the exponential moving average. Both the input and output signals are filtered. The use of the trading system only carries out long operations and has been tested on shares and...

Count:81
Name: M.H Pee indicators
Description: Here is a collection of Trend Indicators as defined by M.H Pee and presented in various articles of the "STOCKS & COMMODITIES Magazine" The actual implementation of the indicators here are made by: everget I thought they were rather cool, so I have gather them here so that they easily can be tested. My own test was made using 15 companies from the OMXS30...

Count:81
Name: Combo Backtest 123 Reversal & Bill Williams Averages. 3Lines
Description: This is combo strategies for get a cumulative signal. Result signal will return 1 if two strategies is long, -1 if all strategies is short and 0 if signals of strategies is not equal. First strategy This System was created from the Book "How I Tripled My Money In The Futures Market" by Ulf Jensen, Page 183. This is reverse type of strategies. The...

Count:81
Name: EURUSD MACD 1 min Long Only
Description: This MACD indicator uses two lines for long and sell long. It also uses a MACD indicator line with a historian. When the MACD historian crosses over the buy line, a long signal is executed. When the MACD historian crosses over the sell line, a close entry is signal is executed. There is a also a built in stop loss and you can adjust the buy and sell lines...

Count:81
Name: Squeeze Momentum Strategy
Description: Just turned LazyBears' Squeeze Momentum Indicator into a strategy. You can understand how it works and pay credit to LazyBear here: uk (dot) tradingview (dot) com/v/nqQ1DT5a/ Best results seem to be on the 4h chart. Added LazyBear's Volume Weighted Moving Average indicator, which can be used (select in strategy properties) to more selectively long or short if...

Count:81
Name: Hobbiecode - Five Day Low RSI Strategy
Description: This is a simple strategy that is working well on SPY but also well performing on Mini Futures SP500. The strategy is composed by the followin rules: 1. If today’s close is below yesterday’s five-day low, go long at the close. 2. Sell at the close when the two-day RSI closes above 50. 3. There is a time stop of five days if the sell criterium is not...

Count:81
Name: Combo Backtest 123 Reversal & High - EMA Strategy
Description: This is combo strategies for get a cumulative signal. First strategy This System was created from the Book "How I Tripled My Money In The Futures Market" by Ulf Jensen, Page 183. This is reverse type of strategies. The strategy buys at market, if close price is higher than the previous close during 2 days and the meaning of 9-days Stochastic Slow...

Count:81
Name: [RS]Function Account Margin Call Functions V0
Description: some simple functions to handle account margin call / trailling stop for account.

Count:81
Name: Moving Average, T3 and Bollinger Strategy
Description: This strategy uses a SMA much like an the faster EMA in many oscillators and the T3 average of the same period as the intermediate trend. Exits are defined by encounters with the Bollinger Band. The long term trend is defined by T3 moving averages of an even longer period.


Count:81
Name: Thesis_EMLYON_Daily_Crypto_Moriceau_indicator
Description: Thesis_EMLYON_Daily_Crypto_Moriceau_indicator

Count:81
Name: dEMA w/ VWAP filter
Description: Buy when EMA is below VWAP and starts sloping up Sell when EMA is above VWAP and starts sloping down

Count:80
Name: Flow Trend Indicator Strategy
Description: Implemented the trend indication part of the CHOP_LRSI indicator as a strategy.


Count:80
Name: Combo Backtest 123 Reversal & Finite Volume Elements (FVE)
Description: This is combo strategies for get a cumulative signal. First strategy This System was created from the Book "How I Tripled My Money In The Futures Market" by Ulf Jensen, Page 183. This is reverse type of strategies. The strategy buys at market, if close price is higher than the previous close during 2 days and the meaning of 9-days Stochastic Slow...

Count:80
Name: Gap Stats v2
Description: This helpful analysis tool displays a table of days a stock has gapped, how much it gapped by and what percentage of the gap was covered. It is meant to be used on the daily timeframe and can help you distinguish if gaps are going to be filled or not. I like to use it mainly on medium + cap stocks that have gapped overnight or pre-market and see what the tendency...

Count:80
Name: TFS: Volume Oscillator Backtest
Description: This is the second part of TFS trading strategy. The concept of this indicator is similar to that of On-Balance Volume indicator (OBV). It is calculated according to these rules: If Close > Open, Volume is positive If Close < Open, Volume is negative If Close = Open, Volume is neutral Then you take the 7-day MA of the results. You can change long to...

Count:80
Name: Upper Timeframe - Repaint Fix
Description: This script is a proof of concept and one possible solution for how to deal with upper timeframe repainting issues. It works for Strategies only . Strategies that utilize data from upper timeframes can still be subject to repainting issues when forward testing. Users can copy the code and use a similar solution in your own scripts. For full code commentary,...

Count:80
Name: Shorting when Bollinger Band Above Price with RSI (by Coinrule)
Description: The Bollinger Bands are among the most famous and widely used indicators. A Bollinger Band is a technical analysis tool defined by a set of trendlines plotted two standard deviations (positively and negatively) away from a simple moving average ( SMA ) of a security's price, but which can be adjusted to user preferences. They can suggest when an asset is oversold...

Count:80
Name: Saturday Strategy BTC By Kzi
Description: I take the hypothèse that saturday is the most stable day of the week because, no SP500, no fed announcement and no weekly closure. My Strategy is very simple: Take the friday color (Red = Short // Green = Long) Then open at the friday close price Take a small pourcentage (1 or 2 %) then close. What ever close on midnight. Work Well on the 1h chart. The Yellow...

Count:80
Name: [ZL]Thermostat Strategy v.beta
Description: This strategy can identify the trending market and the choppy market. It tries to catch swings in the choppy market and catch the big move in the trending market.

Count:80
Name: Matt's MACD Algo v1
Description: This script is meant to be viewed with the Heiken Ashi candlestick chart. I use it for pretty much everything. It has a lot of extra stuff just for visual reference, but the trades are based on the MACD (3,5,9) indicator. I found that speeding up the intervals of the MACD makes for a much more reactive chart. In this heavily volatile market, it has been performing...

Count:80
Name: ATR Strategy FOREX for long only with market filter
Description: I did a modification and added a market filter and changed to buy only. It showed a remarkable good result by doing so. It make sense, since upptrends and downtrends behave different and a strategy that includes both buying and selling will do poorly in general.


Count:80
Name: MA Crossover Strategy with MA Turning Point Exits
Description: Strategy based on MA crossover entries and MA turning point (pivots) exits. You can select any SMA or EMA length, with the first faster one being used as the exit trigger. You can backtest different combinations on different timeframes.

Count:80
Name: Negative Volume Index Backtest
Description: The theory behind the indexes is as follows: On days of increasing volume, you can expect prices to increase, and on days of decreasing volume, you can expect prices to decrease. This goes with the idea of the market being in-gear and out-of-gear. Both PVI and NVI work in similar fashions: Both are a running cumulative of values, which means you either ...

Count:80
Name: MA Strength Strategy
Description: This is based on Aligned Moving Average Index published earlier: But, instead of scoring trend based on how many moving averages are aligned, we are considering upside score. Higher scores are assigned for slower moving averages and lower scores for faster moving averages to give more stress to long term trend. Buy/Sell conditions are based on moving average...

Count:79
Name: The Impeccable by zyberal
Description: This strategy works differently than others, it uses the IchimokuTenkan, Kijun, and Senkou periods to compute a general sense of market trend. Then I used the MACD fast, slow, and smooth with custom inputs to compute a optimum cross for finding macro bottoms and tops for any asset. This strategy doesn't trade on weekends and does not have a set TP (take profit)...

Count:79
Name: CCI strategy on OIL1H
Description: This indicator is based on Commodity Channel Index. It buys when CCI on period 200 is under -130 and it´s rising last 12 bars. It closes the position by hitting Take Profit, Stop Loss or opening short position. It sells when CCI on period 200 is over 130 and it´s falling last 12 bars. It closes the position by hitting Take Profit, Stop Loss or opening short...

Count:79
Name: BT-Bollinger Bands - Trend Following
Description: Esse script foi criado para estudo de Backtest. O script usa as Bandas de Bollinger para indicar o início de uma tendência, a entrada é configurada quando o preço abre abaixo e fecha acima da banda superior ou para venda quando o preço abre acima e fecha abaixo da banda inferior. Não há um stop fixo e nem alvo fixo a saída se dá quando o preço toca a média da...

Count:79
Name: Bollinger Bands and RSI Short Selling (by Coinrule)
Description: The Bollinger Bands are among the most famous and widely used indicators. A Bollinger Band is a technical analysis tool defined by a set of trendlines plotted two standard deviations (positively and negatively) away from a simple moving average ( SMA ) of a security's price, but which can be adjusted to user preferences. They can suggest when an asset is oversold...

Count:79
Name: ICHI + STOCH V1
Description: symbol : gold timeframe : h1 take profit : 1800 point stop loss : 1200 point enjoy

Count:79
Name: Reinforced RSI - The Quant Science
Description: This strategy was designed and written with the goal of showing and motivating the community how to integrate our 'Probabilities' module with their own script. We have recreated one of the simplest strategies used by many traders. The strategy only trades long and uses the overbought and oversold levels on the RSI indicator. We added stop losses and take...

Count:79
Name: KVFX Pivot Reversal Strategy
Description: Works best going in direction of trend , extra eyes to identify market turns


Count:79
Name: Combo Backtest 123 Negative Volume Index
Description: This is combo strategies for get a cumulative signal. First strategy This System was created from the Book "How I Tripled My Money In The Futures Market" by Ulf Jensen, Page 183. This is reverse type of strategies. The strategy buys at market, if close price is higher than the previous close during 2 days and the meaning of 9-days Stochastic Slow...

Count:79
Name: LargestMarketCaps
Description: This trading system uses a MA to check if the LARGEST CAP stocks are above or below the MA. You can see from the indicator below how well it manages to capture big moves. It aggregates the data of all the tickers to create the histogram indicator at the bottom of the chart called MarketLeaders. If a ticker is above its moving average, then the output...

Count:79
Name: Combining DMI And Moving Average For A EUR/USD Backtest
Description: The related article is copyrighted material from Stocks & Commodities Aug 2009 You can change long to short in the Input Settings Please, use it only for learning or paper trading. Do not for real trading.

Count:79
Name: Swing High Low Price Channel V.1
Description: You should buy/sell small order at small plot zone or after small plot. And, Buy/sell big order at big plot zone or after big plot. Recommended, You should use this with Fibonacci Retracement, Price Action or Graph Pattern.

Count:79
Name: Pyramiding Strategy To Study [mcristianrios]
Description: This script simulates what goes behind scenes in a Strategy and it serves to know in Study mode how many positions are running at the same time.

Count:79
Name: GBPNZD ROC RF count strategy
Description: Code takes six pairs that are highly correlated to GBPNZD and determines if their ROC's are increasing or decreasing. If a pair has an increasing ROC it is given a 1, if decreasing a -1. The numbers are all added up (this is similar to a count for counting cards in blackjack). If the count goes positive the strategy enters a long position, if negative a short...

Count:78
Name: 150MA Cross BuyAndSell Strategy [d3nv3r]
Description: This is a Buy And Sell Strategy I haven't seen anywhere so i share mine. Used on Bitcoin - daily chart - the strategy generate sell and buy indicator on crossover and crossunder the 150 simple moving average.

Count:78
Name: STRATEGY R18-F-BTC
Description: Hi, I'm @SenatorVonShaft Just finished the strategy "STRATEGY R18-F-BTC" for trading on #bitcoin and other cryptocurrencies. As any strategy on TradingView, R18 opens Long/Short positions (with no leverage) on certain price points for assets in the chart. But I intentionally make this strategy for Bitcoin . Strategy is effective with 1h chart and it has %36...


Count:78
Name: GAVAD - Selling after a Strong Moviment
Description: This strategy search for a moment whe the market make two candles are consistently strong, and open a Sell, searching the imediactly correction, on the new candle. It`s easy to see the bars on the histogram graph. Purple Bars represent the candle variation. when on candle cross ove the Signal line the graph plot an Yellow ci, if the second bar crossover the signal...

Count:78
Name: Breakeven Line Demo
Description: Plug the breakeven line code into the bottom of your strategy to get visualization of your breakeven price. Line is green when net position is long, red when net short and invisible when strategy is risk neutral. Most useful for strategies which use pyramiding (successive entries in same direction stacked upon each other) as it can be difficult to track where...

Count:78
Name: Noro's Bollinger Strategy v1.0
Description: Bollinger Bands only Piramiding!!! For: - any crypto - timeframe: 1min, 3min, 5min, 15min, 30min, 1h, 2h

Count:78
Name: VIX Futures Spread Strategy
Description: This script was an exercise in learning Pinescript and exploring the futures curve of the VIX in relation to SPY. Was deleted by TV, trying to republish it now with updated parameters for slippage and commission and a more detailed description. "VIX Futures Spread Strategy" is a trading strategy that capitalizes on the spread between the 3-month VIX futures...


Count:78
Name: Reverse Engineering RSI, by Giorgos Siligardos Backtest
Description: The related article is copyrighted material from Stocks & Commodities. You can change long to short in the Input Settings WARNING: - For purpose educate only - This script to change bars colors.

Count:77
Name: EMAC - Exponential Moving Average Cross
Description: EMAC - Exponential Moving Average Cross This strategy is based in part on original 10ema Basic Swing Trade Strategy by Matt Delong: www.tradingview.com Link to original 10ema Basic Swing Trade Strategy: This is the Original EMAC - Exponential Moving Average Cross strategy built as a class for reallifetrading dot com and so has all the default settings and has...

Count:77
Name: Aroon Strategy long only
Description: This is a simple long only strategy made of Aroon and Least Square moving average. The rules are simple: Long entry = crossover of upper part with the lower part from aroon and close of the candle is above the moving average Long exit = crossunder of upper part with the lower part from aroon and close of the candle is below the moving average IF you have any...

Count:77
Name: 8ma55 GBPUSD 1h Strategy
Description: Strategy + Indicator Script (with the same name)


Count:77
Name: MA Crossover Strategy with MA Turning Point Exits + ADX filter
Description: This strategy is based upon @rthomson's MA Crossover Strategy with MA Turning Point Exits. I just added an ability to filter out entries when ADX < 20. In fact you have a choice to set this ADX threshold value. In a sideways market, the MA crossovers end up in yielding entry trades with losses. ADX value around 20 to 25 indicates a sideway market. By...

Count:77
Name: Momentum Line Strategy
Description: I got the idea of an algorithm using a gap, which would behave a bit like RSI, therefore I called it momentum. Don't know if it's very useful or how to improve it, it can keeps you in trends, however it suffers from whipsawing. My first attempt in programming a strategy.

Count:77
Name: Combo Backtest 123 Reversal & Confluence
Description: This is combo strategies for get a cumulative signal. First strategy This System was created from the Book "How I Tripled My Money In The Futures Market" by Ulf Jensen, Page 183. This is reverse type of strategies. The strategy buys at market, if close price is higher than the previous close during 2 days and the meaning of 9-days Stochastic Slow...

Count:77
Name: Aggressive Bandpass Trigger Strategy
Description: This uses the Aggressive Bandpass Trigger Ver 3 to place a trade on an overbought/oversold inflection point of the Lead line and the Phase line above/below the midline

Count:77
Name: USD Liquidity Conditions Index Swing Stock Strategy
Description: Original credits goes to @ElDoggo22 www.tradingview.com I looked in the post created by him, of USD liquidity and I have noticed that if you are going to apply a percentile top and bottom to it, can become an interesting swing strategy for US Stocks. So in this case I decided to create a 99th percentile for top and 4th percentile for bot with a big length,...

Count:77
Name: BCE Version of EMA, SMA Mean Reversion
Description: Slight modifications on the EMA, SMA Mean Reversion.

Count:77
Name: RSI MA Back test
Description: This is a trading back test with the RSI MA. It seems to be way more profitable than combined with the QEMA Indicator It was most Profitable on the 3h chart, while it lost on the 2h chart and below The optimal RSI setting seemed to be 90/10 for optimal over bought/sold trading

Count:77
Name: Silent Trader
Description: Silent Trader strategy by Covax v.1 Strategy based on crossing of two moving averages. Includes all necessary options for risk management. Applicable only for 1H timeframe and for any pairs. Huge net profit to drawdown ratio. No repaint 100%. Current backtest results include taker fees on BitMEX.

Count:76
Name: Correlation Strategy
Description: This is strategy determines a level (expressed in a scale from 1 to 100) of correlation between security A (user defined) and security B (used on the chart) closing prices. If the correlation is less than the user defined threshold, a buy signal will be possible. To determine the direction of the trade we can choose between a Simple Moving Average or a Relative...

Count:76
Name: Volatile Stocks - Simple Strategy w/Profit and Stop
Description: This strategy is based off of a script I wrote for another highly volatile asset, cryptocurrencies. It prints BUY and SELL signals based off of inputs that you can specify. I used this script as a time saver. If there is no signal on the chart, I'm less interested in analyzing it. BUY SIGNALS Bullish EMA Cross Positive MACD Cross Single-candle gains SELL...

Count:76
Name: Modified 3MA cross : Modified 3 moving average crossover
Description: Modified 3MA cross : Modified 3 moving average crossover

Count:76
Name: donchian channels
Description: simple donchian channels strategy. can be modified for long or short, futures / equities / crypto / forex

Count:76
Name: Fib and RSI Strategy Pineconnector
Description: Use on 1m only For best results strategy check for RSI overbought or oversold when key Fib levels are hit Optimisez to use with Pineconnector using alerts with {{strategy.order.alert_message}} Feel free to comment or DM if you want to improve Enjoy

Count:76
Name: TEMA Cross +HTF Backtest
Description: This is a follow up to a previous script release called " TEMA Cross Backtest ". This new strategy uses two TEMA crosses, one for trend direction, one for entry and exit. The entry and exit parameters are the same as the previous script. The trend direction is based on a user configurable higher timeframe TEMA cross which determines when to take longs or shorts....

Count:76
Name: Absolute Price Oscillator (APO) Backtest
Description: The Absolute Price Oscillator displays the difference between two exponential moving averages of a security's price and is expressed as an absolute value. How this indicator works APO crossing above zero is considered bullish, while crossing below zero is bearish. A positive indicator value indicates an upward movement, while negative readings ...

Count:76
Name: Mister Transistor 3.0
Description: This is a general purpose very flexible program to test the effectiveness of HA bars. Please note that if you are charting at tradingview using Heikin-Ashi charting, your system will be trading fictitious prices even if you check the "use real prices" box. Thought you might like to know that before you lose all your money. This program performs the HA calcs...

Count:76
Name: Backtests Are Broken
Description: This script demonstrates a fatal flaw with Trading View backtests involving trailing stops. Trading View assumes the most optimistic case for trailing stops, always giving you the best case high/low of a bar instead of the worst or average case. Within a bar, the price could reverse against your position after the open and trigger your trailing stop for a loss...

Count:76
Name: C320up Strategy Tester Start Time
Description: C320up Strategy Tester Start Time This is a little snippet you can paste into your Strategy to set the testing start date and time. It is not a Strategy per se, though is an example with the timestamp script included. Instructions are fairly straight forward, and are listed in the script. If for some reason you also wanted an end date, that too is possible....

Count:76
Name: STRAT_STEMWAP
Description: Here is the update to the stem matcs strategy. Here are the additions to the strategy. 1. VWAP tuning 2. Stop Loss adjusting fields now act more appropriate in relation to the super trend values. 3. Split out the volume checks to individual values for short and long 4. A max loss setting. This needs to be adjusted to which security and position size you are...

Count:76
Name: The Only EURUSD Trading Strategy You Need - Kaspricci
Description: The Only EURUSD Trading Strategy You Need I got the idea to this strategy from a youtube video uploaded by Trade Beta. It is designed to capture the early market move of major forex pair EURUSD at beginning of New York Stock Exchange (13:30 GMT). Trade Beta tested his strategy on the 5 minute chart. I have set all parameters to same values as shown in the video....


Count:76
Name: Escaping of Rate from Avarage By Mustafa OZVER Strategy
Description: I simulated the EoRfA indicator with the gold price For details about the indicator, visit my profile on tradingview For Simulation, with default settings, we order if Eorfa > 1 and change(eorfa) < 0 sell if Eorfa < -1 and change(eorfa) > 0 buy And we got - 2.49 % profit - 74 % profittable order from all But only this value can not guarantee good...

Count:76
Name: Balance of Power Heikin Ashi Investing Strategy
Description: Balance of Power Heikin Ashi Investing Strategy This is a swing strategy designed for investment help. Its made around the Balace of Power indicator, but has been adapted on using the Monthly Heikin Ashi candle from the SPY asset in order to be used with correlation for US Stock/ETF/Index Markets. The BOP acts as an oscilallator showing the power of a bull...

Count:76
Name: DZ Strategy ICT
Description: The script presented is a trading strategy called "Breaker Block Strategy with Price Channel". This strategy uses multiple time frames (1 minute, 5 minutes, 15 minutes, 1 hour, and 4 hours) to detect support and resistance areas on the chart. The strategy uses parameters such as length, deviations, multiplier, Fibonacci level, move lag and volume threshold for...

Count:75
Name: Optimized Zhaocaijinbao strategy
Description: Introduction: The Optimized Zhaocaijinbao strategy is a mid and long-term quantitative trading strategy that combines momentum and trend factors. It generates buy and sell signals by using a combination of exponential moving averages, moving averages, volume and slope indicators. It generates buy signals when the stock is above the 35-day moving average, the...

Count:75
Name: MA&AO
Description: That is quit simple strategy, which combines only two indicators: AO and MA. The logic of trades is also clear, when AO is bullish; slow ma is under the close price; fast ma > slow ma - buy.

Count:75
Name: Simple EMA_Hull_RSI Strategy
Description: Another simple strategy. Crossing EMA & Hull MA and the level of RSI (overbought/oversold) defines long or short. Can be improved by varying the parameters and adding take profit / stop loss. Backtest: ETHUSD (Bitmex): 5m

Count:75
Name: U&D
Description: if price has moved up since 1 to 3 candles ago = buy if price has moved down since 1 to 3 candles ago = sell has internal SL & TP tested on BITFINEX:ETHUSD BITFINEX:BTCUSD BITFINEX:LTCUSD BITFINEX:ETHBTC 4 hour charts

Count:75
Name: RSI+STOCHRSI Strategy
Description: RSI + STOCHASTIC RSI combination . It is useful for 5 min charts . Profitable in EOS/BTC and BTC/USDT , don't apply all cryptocurrency.

Count:75
Name: Drexel Strategy
Description: This is my variation of the famous Drexel Strategy. I've modified a few of the things, for instance using a JMA smoothing average as well as the RSX calculation from LazyBear. This strategy does not repaint I do not think, when I called the high and low I used or calculated things from open. I believe I avoided curve fitting because I get similar results across...

Count:75
Name: Weis Chop Strategy
Description: A new version of my earlier strategy with Choppiness Index as filter and trigger point. Also have used EMA to determine short time direction

Count:75
Name: 8 Whittle Down
Description: The system is designed to short on directionally negative instruments like VXX & SQQQ The system only shorts, no longs It enters a pilot position if the system has no trades open at the time is in the late afternoon It uses a 200-day moving average as a filter and will only short if the price is below the 200 day moving average The pilot position will...


Count:74
Name: Accumulation Stage Identifier and Strategy around for Trading
Description: In the psychology of trading at any market condition, there are four stage usually occurs on any tickers. Stage 1 -> Neglect phase or consolidation phase It occurs when the company does not produce the expected result and waiting for next result. It can extend for days, weeks, months and years. Never give entry at this stage though that blue-chip told to...

Count:74
Name: OBV Strategy
Description: A simple strategy to give buy/sell signals based on OBV and EMA crossover/crossunder. When OBV crossunder the EMA it gives a sell signal. When OBV crossover EMA it gives a buy signal. You can adjust the length of the EMA . By default it is set to 9

Count:74
Name: FSK (Fast and Slow Kurtosis) Backtest
Description: This indicator plots the Fast & Slow Kurtosis. The Kurtosis is a market sentiment indicator. The Kurtosis is constructed from three different parts. The Kurtosis, the Fast Kurtosis(FK), and the Fast/Slow Kurtosis(FSK). You can change long to short in the Input Settings Please, use it only for learning or paper trading. Do not for real trading.

Count:74
Name: TFS: Tether Line Backtest
Description: Tether line indicator is the first component of TFS trading strategy. It was named this way because stock prices have a tendency to cluster around it. It means that stock prices tend to move away from the midpoint between their 50-day highs and lows, then return to that midpoint at some time in the future. On a chart, it appears as though the stock price is ...


Count:74
Name: Advanced OutSide with HMA and Klinger Forex Swing strategy
Description: This is a swing forex strategy, adapted for big timeframes, such as 4h+. For this example I adapted the strategy to EUR USD main forex pair. Its components are: Outside condition Klinger Oscillator Hull moving average Rules for entry For long: if current high is bigger than previous high and current is smaller than previous low and klinger is positive, close of...

Count:74
Name: Crunchster's Turtle and Trend System
Description: This is a combination of two popular systematic trading strategies - in the trend following category. The strategy is designed for use on the daily timeframe. Specific features of this system are outlined below: 1. Two different strategies to choose from, "Trend" which is a volatility adjusted Exponential Moving Average (EMA) crossover strategy and "Breakout"...

Count:74
Name: Time of Day and Day of Week Buying and Selling Strategy
Description: This strategy allows you to back test longing or shorting or do nothing during time increments of 30 minutes for various days of the week. For example if you want to see if every Saturday if Bitcoin dropped in value from 1600-7000 UTC, this script will allow you to test that. Make sure you are in the 30 minute time frame while viewing the performance and trade history.

Count:74
Name: Daily Close correct results
Description: it's showing the correct results of a repainting cheating script

Count:74
Name: "Sell in May, buy in September"-Strategy
Description: Dear TV'ers, This script applies the classic traders mantra of "Sell in May, buy in September". Not much else to it to be honest. Seems to work though :-).


Count:74
Name: Up/Down Strategy - Contrarian
Description: This is a consecutive bar up/down strategy for going long when the short condition is met or going short when the long condition is met. This is known in trading as taking contrarian signals and is helpful when an asset can provide only losses with a given strategy. In theory taking the opposing trade should produce a profit. With this strategy you can specify how...

Count:74
Name: Backtest Larry Williams 9.1 ( exemplo) - JB
Description: Backtest simples para compra no rompimento do topo do primeiro candle que abre abaixo e fecha acima da ema de 9 periodos e venda no rompimento do fundo do primeiro candle que fecha abaixo da ema de 9

Count:74
Name: MouN1R - Basic Renko regression strategy
Description: Basic idea of how to untrend and calculate slope movement and derivative. Have fun

Count:73
Name: HMA Support & Resistance Strategy
Description: The Hull Moving Average indicator can in some cases be used to outline support and resistance levels. It doesn't work for every asset out there but there are some that have enjoyed this in the past 6 months, such as the OCEAN cryptocurrency on the chart above. This is a strategy to utilize this method, so you can test the assets you trade, including using...

Count:73
Name: Riz Coloured MACD
Description: This is a souped up common or garden MACD . The Histogram is coloured giving a clear visual representation of where we are UpTicking or DownTicking on the Histogram to help support trading decisions. When colour changes from pink to green market is bullish , and visa versa. Very useful as a supporting indicator to confirm other strategies, or even as a...


Count:73
Name: HODLBot
Description: HODLBot is a very simple script that HODLs BTC when price > 200 EMA on 6hr timeframe, and sells (closes long) when price < 200 EMA. Designed to be used with just coins / not leveraged trading, to allow restful sleep knowing that you're not participating in brutal drawdowns like 2018 ^_^

Count:73
Name: Pure RSI long only
Description: Please watch the comment lines in the formula. This is the demostration that RSI resembles actually the real trend and you could be successfull only using different levels of RSI for entering and leaving the market. Adding a simple moving average you may obtain explosive results.

Count:73
Name: CMO & WMA Backtest ver 2.0
Description: This indicator plots Chandre Momentum Oscillator and its WMA on the same chart. This indicator plots the absolute value of CMO. The CMO is closely related to, yet unique from, other momentum oriented indicators such as Relative Strength Index, Stochastic, Rate-of-Change, etc. It is most closely related to Welles Wilder?s RSI, yet it differs...

Count:73
Name: Custom Date Buy/Sell Strategy
Description: This strategy allows you to back test longing or shorting during a period of time between two dates. Make sure you are in the daily time frame while viewing the performance and trade history to ensure you have the most historical data as possible from Trading View. Finally, due to the way Trading View enters trades at the end of a candle, you must subtract one...

Count:73
Name: FLD's - Future Lines of Demarcation Backtest
Description: An FLD is a line that is plotted on the same scale as the price and is in fact the price itself displaced to the right (into the future) by (approximately) half the wavelength of the cycle for which the FLD is plotted. There are three FLD's that can be plotted for each cycle: An FLD based on the median price. An FLD based on the high price. ...

Count:73
Name: Noro's BitFinex Long/Shorts Strategy v1.0
Description: The lime line - long positions at the BitFinex.com exchange. The red line - short positions at the BitFinex.com exchange. Strategy If long positions it is more than short positions - to open long position. And vice versa. If short it is more than long - to close long position. You can change a symbol in settings.

Count:73
Name: SuperC BF 🚀
Description: Based on some code from noro and kiasaki - thank you. A Super Trend is a trend over a long period of time. There are lots of existing scripts that generate signals based on the overall direction of an instrument. What if we combined this idea with a measure of Money Flow and added a filter to try to avoid choppy sideways action? I started with a super trend...

Count:73
Name: MA + EMA Crossover Strategy
Description: EMA and MA crossovers are good signals fo trend reversal You can look at my other scripts. www.tradingview.com If you want to ask something, you can message me.

Count:73
Name: Percent change bar chart Backtest
Description: This histogram displays price or % change from previous bar. You can change long to short in the Input Settings WARNING: - For purpose educate only - This script to change bars colors.

Count:73
Name: AlignedMA and Cumulative HighLow Strategy
Description: Combining the indicators: 1. Aligned Moving Average Index : 2. Cumulative High Low Index : 3. Supertrend Works best in long only for crypto and precious metals. My scenario is to present how much you can earn by investing 1000 for full 10 years. Hence, I am using fixed 1000 initial deposit and 100% equity per trade without any pyramiding. This allows us to...

Count:73
Name: Bollinger Bands Modified (Stormer)
Description: This strategy is based and shown by trader and investor Alexandre Wolwacz "Stormer". Overview The strategy uses two indicators Bollinger Bands and EMA (optional for EMA). Calculates Bollinger Bands, EMA, highest high, and lowest low values based on the input parameters, evaluating the conditions to determine potential long and short entry signals. The...

Count:73
Name: Monthly Returns in Strategies with Market Benchmark
Description: This is a modified version of this excellent script Monthly Returns in PineScript Strategues by QuantNomad I liked and used the script but wanted to see how strategy performed vs market on each month/year. So I am sharing back. The modification consists in adding Market or Buy & Hold performance between parenthesis inside each cell to better see how strategy...


Count:73
Name: Combo Backtest 123 Reversal & Kaufman Moving Average Adaptive
Description: // This is combo strategies for get a cumulative signal. // First strategy This System was created from the Book "How I Tripled My Money In The Futures Market" by Ulf Jensen, Page 183. This is reverse type of strategies. The strategy buys at market, if close price is higher than the previous close during 2 days and the meaning of 9-days Stochastic Slow...

Count:73
Name: LPB MicroCycles Strategy
Description: What it is: We use the Hodrick-Prescott filter applied to the closing price, and then take the outputted trendline and apply a custom vwap, the time frame of which is based on user input, not the default 1 day vwap . Then we go long if the value 2 bars ago is greater then one bar ago. We sell and color the bars and lines when the if the value of 2 bars ago is...

Count:73
Name: Combo Backtest 123 Reversal & Key Reversal Down
Description: This is combo strategies for get a cumulative signal. First strategy This System was created from the Book "How I Tripled My Money In The Futures Market" by Ulf Jensen, Page 183. This is reverse type of strategies. The strategy buys at market, if close price is higher than the previous close during 2 days and the meaning of 9-days Stochastic Slow...

Count:73
Name: Slight Swing Momentum Strategy.
Description: Introduction: The Swing Momentum Strategy is a quantitative trading strategy designed to capture mid-term opportunities in the financial markets by combining swing trading principles with momentum indicators. It utilizes a combination of technical indicators, including moving averages, crossover signals, and volume analysis, to generate buy and sell signals. The...

Count:73
Name: Rsi strategy for BTC with (Rsi SPX)
Description: I hope this strategy is just an idea and a starting point, I use the correlation of the Sp500 with the Btc, this does not mean that this correlation will exist forever!. I love Trading view and I'm learning to program, I find correlations very interesting and here is a simple strategy. This is a trading strategy script written in Pine Script language for use in...

Count:73
Name: MASelect Crossover Strat
Description: Basic Crossover Strategy for backtesting purposes, to use with the study+alert script. Use "Format" to change your settings. Both Moving Averages can be changed individually to swap between EMA (Exponential Moving Average), SMA (Simple Moving Average), WMA (Weighted Moving Average), DEMA (Double Exponential Moving Average) and VWMA (Volume Weighted Moving...

Count:72
Name: Korea premium(KIMP)
Description: Korea premium(KIMP) Ver. 1.0 I posted an 'KIMP(Kimchi premium, Korea Premium) can be used as a leading indicator of collapse and adjustment.' idea. by the way @mahmodbeigy asked if it was true and I answered the question with this strategy.

Count:72
Name: Relative Volatility Index Backtest
Description: The RVI is a modified form of the relative strength index (RSI). The original RSI calculation separates one-day net changes into positive closes and negative closes, then smoothes the data and normalizes the ratio on a scale of zero to 100 as the basis for the formula. The RVI uses the same basic formula but substitutes the 10-day standard deviation of...

Count:72
Name: MASS Index Backtest
Description: The Mass Index was designed to identify trend reversals by measuring the narrowing and widening of the range between the high and low prices. As this range widens, the Mass Index increases; as the range narrows the Mass Index decreases. The Mass Index was developed by Donald Dorsey. You can change long to short in the Input Settings WARNING: - For...

Count:72
Name: Percentage Volume Oscillator (PVO) Backtest
Description: The Percentage Volume Oscillator (PVO) is a momentum oscillator for volume. PVO measures the difference between two volume-based moving averages as a percentage of the larger moving average. As with MACD and the Percentage Price Oscillator (PPO), it is shown with a signal line, a histogram and a centerline. PVO is positive when the shorter volume EMA is...

Count:72
Name: MomGulfing
Description: Long Position Rules: RED -> GREEN, Green close > previous red high, Green candle volume > previous red candle volume or RED -> GREEN -> GREEN First green close < previous red high, Second green close > previous red high, Second green candle volume > previous red candle volume or RED -> GREEN -> GREEN -> GREEN First green close < previous...


Count:72
Name: Trend continuation factor Backtest
Description: Trend continuation factor, by M.H. Pee The related article is copyrighted material from Stocks & Commodities. You can change long to short in the Input Settings WARNING: - For purpose educate only - This script to change bars colors.


Count:72
Name: Strategy JMA(7,50,RSI) crossing RSI(14,close)
Description: Hello, i would like to submit a script dealing with Jurik Moving Average Crossing RSI . Also to avoid false positive, i made a test with long/short positions and entry/closing prices but unfortunately it's not working. I may be too noob to Pine. If you have some ideas to refactor / improve / make this section works: // ======= DEBUGGGGGGGG ============...

Count:72
Name: MACD/CAM 2.1
Description: Added some modifications to Chris Moody's Macd indicator Made fast length, slow length and signal length 5, 8, 3 Put initial capital of $2k Buy at MACD/signal crossover Sell at signal/MACD crossunder or when day low < previous day low Open for feedback

Count:72
Name: KDJ Strategy @ionvolution
Description: Buys if there is crossover in J and D and the crossover is above an SMA defined as an input parameter Sells if the close is below the SMA or there is a crossunder in J and D The KDJ calculation is done using ll21LAMBOS21 script. I added start date, end date, stop loss margin and stop profit margin to ease the simulation on diferent conditions of the...

Count:72
Name: 35EMA Cross BuyAndSell Strategy + RIBBON [d3nv3r]
Description: This strategy allow the user to move the EMA which control the Buy&Sell Strategy and show the EMA ribbon that can be found in the Template area. Buy showing the ribbon and letting the user to adjust the EMA signaling the B&S strat the user can create an elaborated strategy for buyPoint and sellPoint. The 35EMA Cross is choosen by default but I recommend to move...

Count:72
Name: TradeIQ Darvas Box Backtest
Description: This script has been made to backtest the strategy explained in this video link: www.youtube.com Publicly available scripts explained in the video were copy pasted and therefore merged into one single script. Open and short entries were made according to the rules of the video.

Count:72
Name: Trenbolone Strategy
Description: C'est Supertrend Strategy mais avec un nom différent. C'est tout...

Count:72
Name: Binomial Strategy
Description: This script uses the Binomial distribution to enter trades. It calculates the cumulative distribution function for the last 20 bars, applies 2 EMAs to the CDF, and then goes long when the fast one crosses the slow one. NASDAQ:QQQ

Count:72
Name: Noro's MAs Cross Tests v1.0
Description: 1 = SMA = Simple Moving Average 2 = EMA = Exponential Moving Average 3 = VWMA = Volume-Weighted Moving Average 4 = DEMA = Double Exponential Moving Average 5 = TEMA = Triple Exponential Moving Average 6 = KAMA = Kaufman's Adaptive Moving Average 7 = Price Channel


Count:72
Name: Bollinger band (band display 5σ)
Description: Set the color for each bands and indicate the Bollinger bands. In order to indicate with simple moving average line,hide the bollonger bands line and set the color for bands. ボリンジャーバンドの帯域ごとに色を設定して表示します。 単純移動平均線と同時表示しても見やすいように、ボリンジャーバンドの線を非表示にして、帯域に色を設定して表示することができます。

Count:72
Name: Buy/Sell Signal Template/Boilerplate Strategy [JacobMagleby]
Description: This script allows the user to connect an external indicator output/plot value to allow for a no-code solution to setup a simple buy/sell signal strategy. For those of you who do not know how to program, do not be intimidated as this is a very easy setup process. Maybe you want to buy when the 'RSI' value drops below '30' and then sell when the 'RSI' value climbs...

Count:71
Name: Madri
Description: Esta estrategia fue creada por mi, basándose en el indicador bollinger bands+rsi y una ema , forexstrategiesresources me lo pasó a codigo y despues fue publicado en ChartArt y en la pagina web de forexstrategiesresources. Ahora este script lo he modificado para optimizarlo para BTC /USDT en la temporalidad de 1 hora, os invito a ir cambiando temporalidades y...

Count:71
Name: My BTC/USDT 45min Ichimoku Strat v2
Description: Improved last version by adding a RSI derivative condition, which is very effective for spotting sheep herd moves, and follow them asap.

Count:71
Name: Swing Points Breakouts
Description: Long term strategy for managing a Crypto investment with Swing Trades of more than 1 day. The strategy buys with a stop order at the Swing High price (green line) and sells with a stop order at the Swing Low price (red line). The direction of the strategy can be adjusted in the Inputs panel.

Count:71
Name: Combo Backtest 123 Reversal and 2/20 EMA
Description: This is combo strategies for get a cumulative signal. Result signal will return 1 if two strategies is long, -1 if all strategies is short and 0 if signals of strategies is not equal. First strategy This System was created from the Book "How I Tripled My Money In The Futures Market" by Ulf Jensen, Page 183. This is reverse type of strategies. The...


Count:71
Name: TEMA1 Backtest
Description: This study plots the TEMA1 indicator. TEMA1 ia s triple MA (Moving Average), and is calculated as 3*MA - (3*MA(MA)) + (MA(MA(MA))) You can change long to short in the Input Settings WARNING: - For purpose educate only - This script to change bars colors.

Count:71
Name: EMA Dual OHLC
Description: Experiment with simple EMA against offset curve using OHLC averages

Count:71
Name: Trend Analysis Index Backtest
Description: In essence, it is simply the standard deviation of the last x bars of a y-bar moving average. Thus, the TAI is a simple trend indicator when prices trend with authority, the slope of the moving average increases, and when prices meander in a trendless range, the slope of the moving average decreases. You can change long to short in the Input Settings ...

Count:71
Name: Stairs Gain Strategy - MG
Description: I will explain step by step. 1- The position order filtering option is used to filter out duplicate positions. 2- The reason I use an ATR multiplier is to balance the ATR value that differs in instruments. 3- ATR lower limit and ATR upper limit values are to reduce unnecessary transactions and commission expenses in the horizontal market. 4- Strategy take...

Count:71
Name: CC Trend strategy 2- Downtrend Short
Description: Trend Strategy #2 Indicators: 1. EMA(s) 2. Fibonacci retracement with a mutable lookback period Strategy: 1. Short Only 2. No preset Stop Loss/Take Profit 3. 0.01% commission 4. When in a profit and a closure above the 200ema, the position takes a profit. 5. The position is stopped When a closure over the (0.764) Fibonacci ratio occurs. * NO IMMEDIATE...

Count:71
Name: grid strategy long
Description: Design ideas for the first edition: Only go long, not short, choose a time period when the general trend is up. The default grid size is 1x ATR, the next one, two, and three grids will take orders, and the fifth grid will stop loss. When the empty position reaches the upper grid, the grid as a whole rises. Chinese...

Count:71
Name: VWAP Stoch Long Trailing Stop without wednesday and thursday
Description: Simple trading strategy based on VWAP and Stochastic indicators and a 3% trailing stop. After backtesting, wednesdays and thursdays seemed to be bad entry days so they are blacklisted.

Count:71
Name: Boftei's Strategy
Description: I wrote this strategy about a year ago, but decided to publish it just now. I have not been able to implement this strategy in the market. If you can, then I will be happy for you. This strategy is based on my "Botvenko Script". (It finds the difference between the logarithms of closing prices from different days.) (Check this script in my profile) Then the...

Count:71
Name: Intellitrader - Buy Random BACKTESTER
Description: I created a little backtester that it combines some of what we need to backtest to finetune a good strategy for Intellitrader. RSI STOCH STOCHRSI CCI Price Change

Count:71
Name: Bagheri IG Ether
Description: This is a technical trading strategy for Ethereum ( BINANCE:ETHUSDT ). We built and developed it on MetaEditor and optimized it with MetaTrader optimizer. The main indicators are Donchian Channel, Oscillator of ROC, Bears Power, Balance of Power, and Simple Moving Average (SMA). Default values in the input panel are the best combination of these indicators, but...

Count:70
Name: Strategy Timeframe
Description: Hello! Until now, it was among all my strategy codes, but I wanted to share it alone. You can use this code to see strategy results or indicator results within a specific date range. It will be sufficient to add window() condition to the trading or alarm conditions. If time information is also important, you can change the Timestamp interval in the code. Türkçe...

Count:70
Name: cATRpillar Strategy
Description: **This is my first strategy on the Pine editor, any tips or tricks from the community would be awesome! This strategy was developed from my indicator "cATRpillar". it uses the ATR range values to determine entry, and uses EMA values to determine an exit if the market goes against it.

Count:70
Name: Momentum Explosion 2CCI RSI
Description: "Momentum Explosion Template for Mobile Metatrader", that is a trading system trend momentum based on two Commodity Channel Index (CCI) , RSI and two Moving Averages.The trading signals are generated by the crossing of the moving averages confirmed by the agreement of the two CCIs and the RSI. Two Moving averages Filtered by double CCI and RSI Credit is to...

Count:70
Name: Higher TF - Repainting + Limiting backtest results
Description: This strategy is for illustration purpose only. Do not use this as there is massive repainting. As usual, I was experimenting with adding different entry/exit filters to my main strategy. Thought of adding higher frame filter, picked the code for getting higher time frame supertrend from someone else's script and copied it without thinking much about it. ...

Count:70
Name: Noro's Singapore Strategy
Description: Strategy uses only moving average. SMA. They are two: 1) Moving average, big timeframe 2) Moving average, this timeframe Crossing of two moving averages. Moving averages identical. But they have different timeframes.

Count:70
Name: BB limit
Description: Market maker strategy using Bollinger bands as entry, moving average as close and simple stop-loss with percentage of entry position. It was extremely profitable in june on xbtusd.

Count:70
Name: ATR Strategy for most volatile FOREX pairs
Description: A strategy suitable for volatile Forex pairs. The strategy is simple, buy low band and sell short high band. Doing so, you will always be in a trade, that is important to understand. Tested on 1 hour charts.

Count:70
Name: Candle patterns below/above MA
Description: Buy or sell candle patterns below or above MA EMA_for_1D-EMA to use for 1D chart Period_- highest/lowest days to put SL Mercurius.a.m Mercurius.a.m@gmail.com

Count:70
Name: BTC Rapid fire strategy 1M Scalping
Description: Rapid Fire strategy is known for scalping strategy for 1 min EURUSD I change 15 pip stop loss for eurusd and 1.5% for BTC for Take profit 10 pip foreurusd and 1% for BTC

Count:70
Name: Parabolic SAR Strategy With take profit and stop loss
Description: Do not make it too difficult! This is my first strategy! I took the Parabolic SAR Strategy and added Stop Loss and Take profit, and I can see some fantastic results in 2h-3h-4h on some of the Crypto coins. This is for training only, and I do not recommend using it as part of a trading bot, however, I do myself.
Count:70
Name: Inertia Indicator
Description: The inertia indicator measures the market, stock or currency pair momentum and trend by measuring the security smoothed RVI (Relative Volatility Index). The RVI is a technical indicator that estimates the general direction of the volatility of an asset. The inertia indicator returns a value that is comprised between 0 and 100. Positive inertia occurs...

Count:70
Name: Sonic R & RSI only BTCUSD D1 strategy
Description: Sonic R & RSI only BTCUSD D1 strategy for t.me/beincypto_vn for those who want to create their own strategy Use the explanations in the strategy to copy and edit a strategy for yourself buy when on the chart is buyEMA or buyRSI close buy order when on chart is closeEMA or closeRSI please use coinbase exchange time frame D1


Count:69
Name: Strategy Gaussian Anomaly Derivative
Description: Concept behind this Strategy : Considering a normal "buy/sell" situation, an asset would be bought in average at the median price following a Gaussian like concept. A higher or lower average trend would significate that the current perceived value is respectively higher or lower than the current median price, which mean that the buyers are evaluating the price...

Count:69
Name: Jomy's Gyroscopic Bands
Description: Price above white line? Long it. Price below white line? Short it. Tuned to XBTUSD on BitMEX. 12h chart. The bands aren't really needed, but you can also choose to long if the price goes above the band, and short if the price goes below the band. If used on other cryptos you should probably tinker with vara (variable a) until you get a respectable result, as that...

Count:69
Name: [fpemehd] SSL Baseline Strategy
Description: Hello Guys! Nice to meet you all! This is my third script! This Logic is trend following logic, This detects long & short trends based on SSL Hybrid Baseline. This fits to the longer time frame like 4hr and 1d. ### Long Condition 1. close > SSL Hybrid baseline upper k - Baseline is the ma of close price. (You can choose ma type and length) - Upper k is the upper...

Count:69
Name: ETHUSD_SuperTrend Strategy_Coinbase
Description: ETHUSD SuperTrend Strategy for COINBASE 1HR This will allow for traders to better visuals entries and exits in a trending ETHUSD market on COINBASE

Count:69
Name: CMO & WMA Backtest
Description: This indicator plots Chande Momentum Oscillator and its WMA on the same chart. This indicator plots the absolute value of CMO. The CMO is closely related to, yet unique from, other momentum oriented indicators such as Relative Strength Index, Stochastic, Rate-of-Change, etc. It is most closely related to Welles Wilder?s RSI, yet it differs ...

Count:69
Name: Qstick Indicator Backtest
Description: A technical indicator developed by Tushar Chande to numerically identify trends in candlestick charting. It is calculated by taking an 'n' period moving average of the difference between the open and closing prices. A Qstick value greater than zero means that the majority of the last 'n' days have been up, indicating that buying pressure has been...

Count:69
Name: CCI High Performance long only
Description: This strategy is based on the classic Commodity Channel Index and only works long. The system enters the market when this indicator is very low ( CCI <-150 or user-defined threshold) and as soon as it regains strength (i.e. CCI> CCI of the previous candle) with a filter on the "strength" of the prices themselves (i.e. the closing of the candle that provides the...

Count:69
Name: MACD Long Strat
Description: First script I've written, but the concept is pretty simple. This uses the MACD with settings fast_SMA = 6 and slow SMA=16 and uses the distance between the 2 (histogram) to look for potential trend reversals to flag potential entries for Long trades. It waits for the confirmation looking backward 2 x timeframes (to reduce false calls slightly). You can adjust it...

Count:69
Name: Combo Backtest 123 Reversal & D_Three Ten Osc
Description: This is combo strategies for get a cumulative signal. First strategy This System was created from the Book "How I Tripled My Money In The Futures Market" by Ulf Jensen, Page 183. This is reverse type of strategies. The strategy buys at market, if close price is higher than the previous close during 2 days and the meaning of 9-days Stochastic Slow...

Count:69
Name: DCA After Downtrend (by BHD_Trade_Bot)
Description: The purpose of the strategy is to identify the end of a short-term downtrend . So that you can easily to DCA certain amount of money for each month. ENTRY The buy orders are placed on a monthly basis for assets at the end of a short-term downtrend: - Each month condition: In 1-hour time frame, each month has 240 candles - The end of short-term downtrend...


Count:69
Name: Multi MA MACD SMA BB TCO Indicator Heatband copy & debuging
Description: Copy & editing code only

Count:69
Name: RIPO BOT
Description: Script using MA Trendline, RSI and strong buy signal Script still in development

Count:69
Name: Varprice4 - Price is the real King
Description: When you use any indicators you suffer of lagging and possibile mistakes. In this case, higher movements of the (daily) prices (long green candle) are a signal that market is appreciating your stock. The variation of a single candle is compared to standard deviation of the stock. Besides normal money management (on fixed percentages), we have kept the possibily of...

Count:68
Name: Breton Composite BTC Volume -turningpoint -strategy
Description: Composite BTCUSD Volume strategy compiled from 9 different exchanges, attempting to isolate turning points by trading on volume spikes and bag holding bars


Count:68
Name: COT + ema + aux ticker
Description: Purpose: Create a script for backtesting the idea that COT can steer weekly Bias on Forex Market. How does it works: the script use Commercials Delta Conctract, EMA of the selected ticker, EMA of 2 auxiliary tickers (e.g. correlated ticker) to generates buy and sell signals, it allows to include or not each of these. If you use all the indicator, The buy or sell...

Count:68
Name: KD compare strategy (交易策略對照組)
Description: This is a base and easy trading strategy for comparing my other strategy. The strategy consider K >= 80 is strong target in the last high period, and consider K <=20 is the weak target in the last low period. In the strong target, the strategy may increase long at the first day when K < 50, until 2/3 max order limitation or strong target become to weak. In the...

Count:68
Name: D-Bot Alpha RSI Breakout Strategy
Description: Hello dear Traders, Here is a simple yet effective strategy to use, for best profit higher time frame, such as daily. Structure of the code The code defines inputs for SMA (simple moving average) length, RSI (relative strength index) length, RSI entry level, RSI stop loss level, and RSI take profit level. The default values of these variables can be...

Count:68
Name: Ichimoku Cloud strategy for gold market
Description: This strategy is based on main ichimoku features (Leading span , conversion line and base line) compared to cloud conditions. I indicated all possibilities in this indicator and strategy decision is based on crossing factors of each main line through two other line confirmations.

Count:67
Name: ACM22 not repainted
Description: Делал данный скрипт для FORTS.Идеально подойдет тем,кто использует трейлинг стопы.В основе стратегии лежит RSI.Как по мне,хорошая вещь для проверки стратегии и ее оптимизиации.На скрине 50 контрактов,так что не сильно радуйтесь,а просто делите на 50 и получите показатели на 1 контракт. Script make for futures on MICEX.U can change paramets of RSI,traling stop...

Count:67
Name: Bull Trend Filtered StochRSI (BTFS)
Description: Ride Bull Trends Via Stochastic with Special Rules for Heavy Bullish Bias TLDR: Long Only Trend Indicator Where you are always entered Long if the stochastic is over the lower band line and the price is above the Donchian Chanel high. Exit when Stochastic RSI is below the lower band. Indicators: Filter = Trend/Bullish indicator is Donchian of ema(high) this is...

Count:67
Name: Parabolic SAR Strategy w/ Time Window
Description: PSAR Strategy with time window for backtest purpose

Count:67
Name: Bollinger Bands Strategy with StopLoss
Description: This is the default Bollinger Bands Strategy with a small change to support Stop Loss. The default built-int BBS does not support Stop Loss and using it may cause large losses, specially in margin trading. Added inputs: Source Stop Loss Percentage


Count:67
Name: MA Cross
Description: Very simple Strategy just for learning purposes. Uses crossover of SMA3/50

Count:67
Name: [cache_that_pass] 1m 15m Function - Weighted Standard Deviation
Description: Tradingview Community, As I progress through my journey, I have come to the realization that it is time to give back. This script isn't a life changer, but it has the building blocks for a motivated individual to optimize the parameters and have a production script ready to go. Credit for the indicator is due to @rumpypumpydumpy I adapted this indicator to a...

Count:67
Name: Nifty 50 5mint Strategy
Description: The script defines a specific trading session based on user inputs. This session is specified by a time range (e.g., "1000-1510") and selected days of the week (e.g., Monday to Friday). This session definition is crucial for trading only during specific times. Lookback and Breakout Conditions: The script uses a lookback period and the highest high and...


Count:67
Name: Bandpass Filter Reversed Strategy Backtest
Description: The related article is copyrighted material from Stocks & Commodities Mar 2010 You can use in the xPrice any series: Open, High, Low, Close, HL2, HLC3, OHLC4 and ect... Please, use it only for learning or paper trading. Do not for real trading.

Count:67
Name: Ergotic MDI (Mean Deviation Indicator) Bactest
Description: This is one of the techniques described by William Blau in his book "Momentum, Direction and Divergence" (1995). If you like to learn more, we advise you to read this book. His book focuses on three key aspects of trading: momentum, direction and divergence. Blau, who was an electrical engineer before becoming a trader, thoroughly examines the relationship...

Count:67
Name: MACD Trend Following Strategy
Description: How it work ? Work like normal MACD because this is MACD without any modify but i add color of candlestick and strategy. The color meaning : Green= macd > signal and macd>0 (Buy) Red= macd < signal and macd<0 (Sell) Yellow= macd > signal and macd<0 (Maybe reversal point) Blue= macd < signal and macd>0 (Maybe reversal point) Feature - Back test range -...

Count:67
Name: 4 EMA TREND Strategy
Description: I published an indicator based on 4 EMA, It is the strategy of that.

Count:67
Name: New Renaissance
Description: Prelim version of MACD long entry and exit with custom time frame selector. To do: Add Stoch and Stoch RSI criteria.

Count:67
Name: Moving Averages Cross - MTF - Strategy
Description: Backtesting Script for the following strategy Strategy Injector Source: github.com

Count:67
Name: High Low Bands Backtest
Description: As the name suggests, High low bands are two bands surrounding the underlying’s price. These bands are generated from the triangular moving averages calculated from the underlying’s price. The triangular moving average is, in turn, shifted up and down by a fixed percentage. The bands, thus formed, are termed as High low bands. The main theme and concept...

Count:67
Name: Buying Selling Volume Strategy
Description: First I would like to give the original credit and thanks to @ceyhun for his amazing volume script. The way I decided to convert it into a strategy is divided into multiple types. First, I decided in order to smooth out the values and make it more accurate to adapt the values to multiple timeframes. After that I took the initial values from the buyers and...

Count:66
Name: MACD TrueLevel Strategy
Description: This strategy uses the MACD indicator to determine buy and sell signals. In addition, the strategy employs the use of "TrueLevel Bands," which are essentially envelope bands that are calculated based on the linear regression and standard deviation of the price data over various lengths. The TrueLevel Bands are calculated for 14 different lengths and are plotted on...

Count:66
Name: [CM]EMA Trend Cross STRAT
Description: VISUALLY REPRESENTS THE CROSSING OF 8,13,21,55 EMA'S FROM KROWNS TA PROGRAM Hello everybody! I was curious and wanted to see how the Strat described in one of the modules would look coded. So here we are, a clear cut visual representation of the methods talked about in the course from the EMA Module. Enjoy! (Instructions) Whenever the 8,13,21 all cross above...

Count:66
Name: HYE Mean Reversion VWAP [Strategy]
Description: An RSI filtered version of PJ Sutherland's Jaws Mean Reversion algorithm using volume weighted average price (VWAP) instead of simple moving average (SMA). "Long" on the close when; 1-) 2 period VWAP closes 3% or more below the 5 period VWAP , 2-) 5 period exponential average of the 2 period RSI is below 30. "Exit Long" on the close when; 1-) 2 period VWAP...

Count:66
Name: DMI Strategy
Description: This strategy is based on DMI indicator. It helps me to identify base or top of the script. I mostly use this script to trade in Nifty bank options, even when the signal comes in nifty. It can be used to trade in other scripts as well. Pivot points can also be used to take entry. Long entry is taken when DI+(11) goes below 10 and DI-(11) goes above 40, whereas...

Count:66
Name: Simple Stock Strategy
Description: This is a simple and easy to use strategy for low-volatility stocks. It prints a BUY or SELL signal to alert you that certain conditions have been met. I use it as a time saver to help identify which charts I need to look at. You can adjust the inputs and properties to suit your needs. I would suggest allowing two or three orders. BUY Signals MACD Above 0 SMA...

Count:66
Name: Simple Moving Average Cross
Description: The script uses 3 simple moving averages that you can define (SMA Top, SMA Mid, SMA Long). Once the SMA Top is above the SMA Mid and the SMA Mid is above the SMA Top a long position is entered. Once the SMA Top is below the SMA Mid and the SMA Mid is below the SMA Top a short position is entered. You may define how long before these positions are entered by...

Count:66
Name: Trading the Equity Curve Position Sizing Example
Description: "Trading the equity curve" as a risk management method is the process of acting on trade signals depending on whether a system’s performance is indicating the strategy is in a profitable or losing phase. The point of managing equity curve is to minimize risk in trading when the equity curve is in a downtrend. This strategy has two modes to determine the equity...

Count:66
Name: Donchian Strat EXMO
Description: This is simple test of Turtle Trading strategy by Richard Dennis. The script meant to place orders on Donchian Channel borders. It's best to test and use on mid-term charts like 1H and more. I've chosen Kraken XBT/USDT chart because this market opened in december 2019. The main problem of crypto trading strategy testing is the bullish market of 2017 year. That...

Count:66
Name: Three (3)-Bar and Four (4)-Bar Plays Strategy
Description: This strategy analyzes the three and four-bar play which is when price action has a wide igniting bar that has a full body, then one or two narrow bars which have a relatively equal high for long plays and relatively equal low for short plays, then a continuation bar. You should not take plays that will encounter resistance. The stop loss is placed for long plays...

Count:66
Name: DAKELAX-XRPUSDT Bollinger Band Strategy for Tradebotler
Description: DAKELAX-XRPUSDT is a Tradebotler strategy designed to run on XRPUSDT for binance, it's a simple reverse to mean strategy and when backtested on may-aug 2019 on H1 timeframe it performs pretty well in backtest as well as running live. In order to get started install the Tradebotler extension and connect the strategy with Binance or other crypto exchanges of your...

Count:66
Name: sma RSI & sudden buy and sell Strategy v1
Description: This strategy uses mostly three things:- 1. average RSI (sma rsi over a period) 2. sudden buy and sudden sell (usually to infer the change in trend or direction) 3. various EMAs ( used as a filter) I mostly build it to work on a 3min crypto chart but it should work on any timeframe or any symbol. Settings - Length -RSI length (hardly needed to be changed but...


Count:65
Name: How to use Leverage in PineScript
Description: I believe there are many friends who have been confused by the leverage problem of TradingView strategy, when backtesting, it is always unable to bring its own leverage, so it is impossible to do leverage sustained compounding, this key point, and many friends are looking forward to solve. In particular, the default_qty_value = 100, where 100 is the upper...

Count:65
Name: CM_SlingShotSystem+_CassicEMA+Willams21EMA13 htc1977 edition
Description: This strategy is a combination of 2 indicators based on EMA(actually x3 EMAs and Williams ind. We usin this to see where EMA fast is above EMA slow(for long), entry position when price hit fast EMA and exit if trend changes or price overbought, or by stoploss 1%. The opposite for a short position. For better result You can change every EMA's, stoploss, Willam's...


Count:65
Name: Script functionality test - work in progress (2RS + BB + MA)
Description: This is the first script I've written. Its sole purpose is to make me learn a bit of pine script. Its not intended to trade live. Feel free to modify it if you wish and let me know if you do it. Also any comments are welcome! Also i need help in two things: 1. Im unable to print the "in-strategy" rsi on chart 2. I want to ignore the first buy signal after each...


Count:65
Name: Balance of Power Strategy
Description: A simple variation on the balance of power idea, using a weighted moving average and a basic lookback to attempt to predict the motion in the next tick. As far as a trading pattern goes, it's performance is rather conservative, and it is rather noisy as it doesn't do a good job of preventing quick, meaningless trades.

Count:65
Name: Nabz-BBMACD-2022-V1.1
Description: I have tried to make script which triggers indicators on combination of different feedback including Bollinger bands and MACD. Also used some of my logic by trial and error, It gave 744%+ profit on back-testing on coin RUNE/USDT from Jan 2021. It is my first script, I am happy to help the community. Please share your feedback.

Count:65
Name: I11L OIL Bot
Description: The System makes use of the Bolinger Bands strategy from TradingView and implements simple Money Management Rules like SL and TP. You can adjust the following Parameters: Leverage: Leverage. Risk Capital per Trade: The amount you are willing to lose per Trade, keep in mind that changes in Leverage should follow changes in Risk Capital. TP_Factor: Default is 2:1...


Count:65
Name: CMARSI result on Dow Jone I (237x)
Description: Money money money... Yeah, that's funny...

Count:65
Name: Vertical Horizontal Filter Backtest
Description: Vertical Horizontal Filter was initiated by Adam White. It was first published in a magazine called “Issues of Futures” in August, 1991. The Vertical Horizontal Filter (VHF) is a very common Indicator used by traders to find out the Phase of a Price Trend. Normally, a price trend can be in a Trending Phase or a Congestion Phase/Choppy Movement Phase. Adam...


Count:65
Name: uray MACD margin trade strategy
Description: simple margin trading strategy based on MACD i.imgur.com

Count:65
Name: Arch1tect's New Toy (Strategy Tester Version)
Description: Description: The version of Arch1tect's New Toy indicator with Strategy Tester added. This indicator tries to predict market trends by simply utilising 2 moving averages crossovers. How it works: Buy signals are triggered when the faster MA crosses over the slower MA from the downside to the upside. Sell signals are triggered when the faster MA crosses...

Count:65
Name: KISS MAURICE FOL
Description: Search on Google "finanzaonline maurice kiss me please"

Count:64
Name: BUY STRENGTH SELL WEAKNESS REMADE COPY
Description: Suggestions and ideas appreciated... This was just a simple idea I had with the RSI. I would like to add a filter.. example: Only to go long when RSI is overbought AND price above 200 ema Viceversa for short, when oversold and price below 200 ema. Is there anyone out there who can help ??

Count:64
Name: RSI KANNEMAN
Description: Para hacer muchos SUYAI Basado en RSI y media de RSI, con sobre compras y sobre ventas.

Count:64
Name: MTF RSI & STOCH Strategy by kzi
Description: This script is a teaml job with Indicator-Johns. First he used my script, then i transform his code. The origine: The first transformation: www.tradingview.com Funny moment together, thanks for that. :) This sharing is an indicator where you can see the average of different time frames. The RSI is the blue line The Stock is the yellow line You can manage...

Count:64
Name: HA smoothed eliminator v2
Description: This script is published to show the difference between Heiken ASHI and Japanese candlesticks. I do not recommend using it in trading. the indicator is taken from here

Count:64
Name: MACD Strategy with Histogram
Description: This combines a strategy for backtesting with a plotted MACD graph and orders

Count:64
Name: USO - Adam Smith - Moving Average Cross Strategy
Description: Simple Moving Average strategy for USO - United States Oil Fund . This strategy can be used on stocks and currencies but will need to tweak frequency on chart and backtest Max Draw Down to Net Profit ratios for maximum dollar gains.

Count:64
Name: SB_Compliment_RSI Strategy
Description: The strategy modifies the original rsi strategy with the addition of compliment si (i.e. 100-rsi). Strategy Idea: Previous rsi high and low value is recorded when the rsi crosses overBought(70) and OverSold(30) values. Now when the rsi crosses above the overSold range, the rsi is matched with the compliment of previous high rsi value. If the compliment...

Count:64
Name: Three Outside Up Backtest
Description: This is a three candlestick bullish reversal pattern consisting of a bullish engulfing pattern formed by the first two candlesticks then followed by an up candlestick with a higher close than the prior candlestick. WARNING: - For purpose educate only - This script to change bars colors.

Count:64
Name: Bollinger Squeeze Strategy
Description: A Bollinger Strategy where we try to squeeze out some profits.

Count:64
Name: LarryWillians - Simple Strategy
Description: A simple and classic strategy on market, created by LarryWillians using a EMA9. The brute model use a Cross from closing price on EMA9. But occurs many false entries. In other to correct this kind of thing, I add a SMA21 to confirm the trend and decrease numbers of false trades. The strategy waits to break the last High (for buy) a position. As a strategy...

Count:64
Name: Ichimoku + Daily-Candle_X + Gaussian Smooth + MacD
Description: I take no credit for this script. I swapped the Hull moving average used the original program made by SeaSide420 for a gaussian smooth function made by jjaskulowski. This script seems to consistently outperform the original strategy for the long condition. I'm mainly focused on crypto, so I removed the "short" option because most crypto exchanges don't have this...

Count:64
Name: Heikin Ashi ROC Percentile Strategy
Description: **User Guide for the "Heikin Ashi ROC Percentile Strategy"** This strategy, "Heikin Ashi ROC Percentile Strategy", is designed to provide an easy-to-use framework for trading based on the Heikin Ashi Rate of Change (ROC) and its percentiles. Here's how you can use it: 1. **Setting the Start Date**: You can set the start date for the strategy in the user inputs...

Count:64
Name: Noro's ShiftEx Strategy v1.0
Description: Lime line - level for opening a long position. Blue line - level to close a long position. Short positions are not used. Lime line = minimum of previous candle -% (or 0) Blue line = maximum of previous candle +% (or 0) For: - (any altcoin)/BTC, (any altcoin)/ETH, (any altcoin)/BNB - timeframes: 1h, 4h or 1d Preferably - if 1h TF: buy-5% and sell+0% - if 4h...

Count:64
Name: Modulo Logic + EMA Strat
Description: To understand this strategy first we need to look into the Modulo (%) operator. The modulo returns the remainder numerator of a division's quotient (the result). If we do 5 / 3, we get 1 and 2/3 as a result, where the remainder is 2 (two thirds, in this case). This can be used for many things, for example to determine when a number divides evenly into another...

Count:64
Name: I11L - Better Buy Low Volatility or High Volatility?
Description: This Pine Script code defines a TradingView strategy called "I11L - Better Buy Low Volatility or High Volatility?". The strategy aims to study the difference between buying when an asset's volatility is low and when it is high. It allows the user to select whether to buy during low or high volatility periods by changing the input variable mode. Here's a brief...

Count:64
Name: ATR + STC + MA
Description: This Script was wrote to backtest, in its current form it appears to be unprofitable

Count:63
Name: Ergodic CSI Backtest
Description: This is one of the techniques described by William Blau in his book "Momentum, Direction and Divergence" (1995). If you like to learn more, we advise you to read this book. His book focuses on three key aspects of trading: momentum, direction and divergence. Blau, who was an electrical engineer before becoming a trader, thoroughly examines the...

Count:63
Name: Strategy Creator
Description: 5 indicators. Backtesting available. Uses ADX, RSI, Stochastic, MACD, and crossing EMAs (1,2, or 3). This strategy creator allows you to turn on or off these indicators and adjust the parameters for each indicator. It allows you to make one trade at a time e.g the next trade doesn't open until the last one closes. (You are also able to enter how many trades in one...

Count:63
Name: My5min
Description: 1. Follow the instructions for entry and exit exactly as above. Don’t second guess, or assume/presume anything. 2. Avoid entering the trade when the price is temporarily above /below 10 day MA, but the price candle hasn’t fully formed yet. Enter the trade only after the price candle closes above/below the 10 day MA. 3. Exit the trade immediately when the price...

Count:63
Name: Stock_Strat_HL_V1
Description: Stock_Strat_HL_V1 applied to BTC with some additional filters

Count:63
Name: PB SAR BackTest - Colorbar
Description: Indicator with buy/sell alerts for setup/trigger conditions Built upon Peterbolic SAR current version as of publishing

Count:63
Name: Up/Down Strategy
Description: This is a consecutive bar up/down strategy where you can specify how many bars up to buy and how many bars down to sell. It also has code to check and make sure the condition is still true when launching the official alert, which helps back testing and live results line up, however be sure to enter commission and slippage into the properties to accurately reflect...


Count:63
Name: polynomic_stop
Description: A strategy with a trailing stop in the form of a polynomial function. The entry is made at the intersection of a simple sliding closing candle. At the moment of entering the position, it is fixed by the value of the Minimum for the period. After entering the position, a trailing stop of the form is activated: Min + D * N^a, where Min is the minimum for the period...

Count:63
Name: Bollinger Bands, RSI, and MA Strategy
Description: The "Bollinger Bands, RSI and MA Strategy" is a trend-following strategy that combines the Bollinger Bands indicator, the Relative Strength Index (RSI), and a moving average (MA). It aims to identify potential entry and exit points in the market based on price volatility, momentum, and trend. The strategy uses two Bollinger Bands with different standard...

Count:63
Name: sma dipsparity and sdv
Description: FXBTCJPY 1min contrarian script (2020/1/30) 1分足の逆張りです. If you want to use other timescale, need to change disparity rate and sdv. To display disparity(sma) and standard deviation, and to draw a hline(pine function) a certain valu. And lets think. I thought disparity rate 1~1.3 or -1~-1.3 are able to use constrarian trade (and sdv>600). In bottom, disparity index...

Count:63
Name: [Hawk] Daytrader 1H Strategy
Description: Experimenting with programming signals. -Hawk

Count:63
Name: 365 Day High Breakout Strategy
Description: SCRIPT NOTES - Strategy consists of 3 parameters :- 1. BUY on 365 day breakout (250 days taken in back-testing instead of 365 days considering weekends and other holidays in a year) 2. Moving averages (Noise Filtering condition ) 3. RELATIVE STRENTH indicator (Original Author - tradingview.com ) (Noise Filtering condition ) - Strategy works better on low...

Count:63
Name: MouN1R - StableSwap
Description: Use to identify large market movement. Indicate when to left & go (to play upper 1hr for noise). Have fun MouN1R

Count:63
Name: PPO Strategy
Description: PPO strategy, similar to MACD but with percentage Buy when PPO cross over a threshold, ex 0.4 Sell when cross under ... You may use it in 2h time frame or more ... to get strong signal Feel free to help improve the strategy

Count:62
Name: Hull MA of RSI Strategy
Description: This simple strategy base on RSI value of Close Price, High Price, Low Price, Median Price and RSI value smoothed by Hull Moving Average. 1. Optimize parameter on BTC H1 Binance chart RSI period: 13 Hull MA period: 3 Middle Channel: 55-45 Overbough / Oversold: 70-30 2. Setup 2.1 Long Condition - RSI of Close Price crossunder Overbought - Close Price lower than...

Count:62
Name: Trailing Stops/Choose a Day of the Week
Description: This would be my second ever published strategy. It is almost the same as my first ever published script . I've been working primarily on UGAZ and DGAZ . This is basically a statistical trade. It buys every morning near market open (or by choosing a "time constraint"), then immediately places a trailing stop at a specified amount in ticks (if used on...

Count:62
Name: Close v Open Moving Averages Strategy (Variable) [divonn1994]
Description: This is a simple moving average based strategy that works well with a few different coin pairings. It takes the moving average 'opening' price and plots it, then takes the moving average 'closing' price and plots it, and then decides to enter a 'long' position or exit it based on whether the two lines have crossed each other. The reasoning is that it 'enters' a...

Count:62
Name: Bullish Harami Backtest
Description: This is a bullish reversal pattern formed by two candlesticks in which a small real body is contained within the prior session's unusually large real body. Usually the second real body is the opposite color of the first real body. The Harami pattern is the reverse of the Engulfing pattern. WARNING: - For purpose educate only - This script to...

Count:62
Name: Lowest & CCI & SMA
Description: It works with rebound from lowest and the bottom level (-100) CCI.


Count:62
Name: SB_CM_RSI_2_Strategy_Version 1.0
Description: The strategy is based on the indicator posted by @ChrisMoody "CM RSI-2 Strategy Lower Indicator" which is based on "Larry Connors RSI-2 Strategy - Lower RSI" In this strategy the longs are placed when a green color is encountered in the rsi and short when red color is encountered in the rsi. Although the profits can be booked at different interval. Just message...

Count:62
Name: Simple Momentum Strategy Based on SMA, EMA and Volume
Description: A simple, non short selling (long positions only, i.e. buy low and sell high) strategy. Strategy makes use of simple SMA, EMA and Volume indicators to attempt to enter the market at the most optimum time (i.e. when momentum and price are moving upwards). Optimum time is defined mainly by picking best timing for price moves higher based on upwards momentum. This...

Count:62
Name: Setting Strategy Time Frame
Description: Advancing my previous post on my first pine script strategy in which i built a working Moving Average Crossover strategy, we now added a custom time frame.


Count:62
Name: Backtest History Setup 1.0
Description: Script of strategy component to setup the backtext lookback. You setup the maximum days back in the history, which will be used for backtest.

Count:62
Name: T3 ICL MACD STRATEGY
Description: Backtested manually and received approx 60% winrate. Tradingview strategy tester is skewed because this program does not specify when to sell at profit target or at a stop loss. Uses 1 min for entry and a longer time frame for confirmation (5,10,15, etc..) (Not sure what the yellow arrows are in the picture but they can be ignored) Ideal Long Entry - The algo...

Count:62
Name: Volatility Backtest
Description: The Volatility function measures the market volatility by plotting a smoothed average of the True Range. It returns an average of the TrueRange over a specific number of bars, giving higher weight to the TrueRange of the most recent bar. You can change long to short in the Input Settings WARNING: - For purpose educate only - This script to change bars colors.

Count:62
Name: Percentage Change strategy w/BG color
Description: The Percentage Change Method has historically been very effectively used by analysts on very long time horizons and very extreme percentage changes, for example a -6% or more drop in any index doesn't happen very often but it has very large implications and that much selling pressure typically leads to more selling at least for a while as a consequence of it....

Count:61
Name: Doji Backtest
Description: This is a candlestick where the open and close are the same. WARNING: - For purpose educate only - This script to change bars colors.


Count:61
Name: Random Entries Work!
Description: " tHe MaRkEtS aRe RaNdOm ", say moron academics. The purpose of this study is to show that most markets are NOT random! Most markets show a clear bias where we can make such easy money, that a random number generator can do it. === HOW THE INDICATOR WORKS === The study will randomly enter the market The study will randomly exit the market if in a trade ...

Count:61
Name: RSI correlation with cryptoindices [strategy version]
Description: Dear TV'ers, Hereby the strategy script where the RSI of an altcoin can be compared to one of the selected cryptocap indices. Included are: -total market cap -total market cap minus bitcoin -total market cap others -total market cap usdt -cix100 index -btc dominance -btc total cap If the signal crosses over 1, then the altcoin is undervalued compared to the...

Count:61
Name: IFR2 - RSI2
Description: When the price is over the EMA and RSI 2 is less then 25 so an open order is going to be made and the strike is the high of the antepenultimate price

Count:61
Name: MACD River Strategy
Description: It uses two MACD filter values instead of one increasing the profits

Count:61
Name: Combo Backtest 123 Reversal & Bear Power
Description: This is combo strategies for get a cumulative signal. Result signal will return 1 if two strategies is long, -1 if all strategies is short and 0 if signals of strategies is not equal. First strategy This System was created from the Book "How I Tripled My Money In The Futures Market" by Ulf Jensen, Page 183. This is reverse type of strategies. The...

Count:61
Name: Combo Backtest 123 Reversal & CMO & WMA
Description: This is combo strategies for get a cumulative signal. First strategy This System was created from the Book "How I Tripled My Money In The Futures Market" by Ulf Jensen, Page 183. This is reverse type of strategies. The strategy buys at market, if close price is higher than the previous close during 2 days and the meaning of 9-days Stochastic Slow...

Count:61
Name: MAConverging + QQE Threshold
Description: This trading script is a trading strategy that is made up of 2 public indicators so credit goes to LuxAlgo and Jose5770. I have the 2 indicators listed below. 1) Moving Average Converging (LuxAlgo) 2) QQE Threshold (Jose5770) This trading strategy is buying when the two indicators align, and then the take profit is the first red bar on the QQE Threshold...

Count:61
Name: Buy/Sell Strategy Traderspro 21EMA/200SMA & Pivots
Description: Buy Signal: If price closes over EMA 21 and SMA 200 and over Montly and weekly pivots. Sell Signal: If price closes below EMA 21 and SMA 200 and below Montly and weekly pivots. Use buystops sellstops over signal bar close For EURUSD Daily Timeframe works better. Check other pairs to see which timeframe has better profits. I apreciate your comments

Count:61
Name: Donchian Breakout no repaint
Description: donchian breakout strategy which i revise the script for no repaint signal

Count:61
Name: MA Cross + Strategy by Realmix
Description: Two Moving Average with crossmarker and strategy when both indicators are crossing for a possible position

Count:61
Name: RSI2 Scapling
Description: Rule 1. Price is above its 200-period moving average 2. The 2-period RSI of price closes below 5 3. Buy price on the close 4. Exit when price closes above its 5-period moving average

Count:61
Name: CryptOli 3 MAs long/short Backtest
Description: // this is an educational Script - basicly its very simple - you can see how minimal changes impact results, thats why i posted it // Credits to Quantnomad to publish tons of free educational script // this Script is based on Quantnomads Ultimate MA Indicator // HA - Option for calcultion based on HA-Candles (very famous recently) // Source Input - Option...

Count:61
Name: N Bars Up Backtest
Description: Evaluates for n number of consecutive higher closes. Returns a value of 1 when the condition is true or 0 when false. WARNING: - For purpose educate only - This script to change bars colors.

Count:61
Name: [BoTo] RSI Trend Strategy
Description: Open source code. It is very old trade strategy. It is older than you :) Uses the RSI indicator. The RSI indicator has described Welles Wilder in the book in 1978. And all this is still profitable! Additional articles 1. en.wikipedia.org 2. en.wikipedia.org 3. www.tradingview.com(RSI) How it works Step 1. The user chooses length for RSI Step 2. If...

Count:61
Name: Quadriple EMA Strategy
Description: Just a quick EMA strategy based on the popular SHORT Youtube clip: www.youtube.com in case you were interested in how it would behave when automated.. DISCLAIMER : I'm not a financial adviser and this is not a financial advise. Remember, most traders lose money.

Count:60
Name: Optimised RSI strategy for Reversals (by Coinrule)
Description: The most common way to use the RSI to spot a good buy opportunity is to check for values lower than 30. Unfortunately, the RSI can remain in oversold territory for long periods, and that could leave you trapped in a trade in loss. It would be appropriate to wait for a confirmation of the trend reversal. In the example above I use a short-term Moving Average (in...

Count:60
Name: Example of Simple RSI Buy/Sell at a level and hold for 10 days
Description: Script implements strategy: 1 Buy at RSI (10) < 30 2 Sell at RSI (10) > 40 or after 10 days The strategy is not profitable for long term trading.

Count:60
Name: Stochastic RSI Strategy (with SMA and VWAP Filters)
Description: The strategy is designed to trade on the Stochastic RSI indicator crossover signals. Below are all of the trading conditions: -When the Stochastic RSI crosses above 30, a long position is entered. -When the Stochastic RSI crosses below 70, a short position is entered. -The strategy also includes two additional conditions for entry: -Long entries must have a...

Count:60
Name: Relative Strength Index - Mayur
Description: RSI backtesting long only portfolio builder. only for investing at cheap valuations


Count:60
Name: SimpleMA smoothed crossover strategy
Description: Experimental simple Bot script for ETH/USD 1 hour chart. welcome to test on other pairs. put feedback in comments. This is a crossbreed between SMA and HULLMA

Count:60
Name: Cycle Position Trading
Description: Title: Cycle Position Trading Strategy v1.0 Description: Cycle Position Trading Strategy is a simple yet effective trading strategy based on a 200-day Simple Moving Average (SMA). Users can select between two modes, "Buy Uptrend" and "Buy Downtrend," to customize the strategy according to their trading preferences. The strategy allows users to set their own stop...

Count:60
Name: Percent difference between price and MA Backtest
Description: Percent difference between price and MA You can change long to short in the Input Settings WARNING: - For purpose educate only - This script to change bars colors.

Count:60
Name: Fixed price Stop Loss [Takazudo]
Description: This strategy is a demo for fixed price stop loss. This strategy enables you to specify fixed price stop loss. Let's say your deposit is USD. When you trade EURCAD, you need to specify the quantity for trade. Here comes three chances for trade. A: SL pips: 500 B: SL pips: 200 C: SL pips: 100 In these trade, the risk is different for each. ABC risk ratio...

Count:60
Name: Noro's Trend SMA Strategy v1.1
Description: Trade strategy which uses only 2 SMA . The slow SMA (blue) is used for definition of a trend The fast SMA (red) is used for an entrance to the transaction For H1 For crypto/fiat In the new version 1.1 - profit became more - the risk became less - strategy considers color of a candle

Count:60
Name: Smoothed RSI Backtest
Description: This is new version of RSI oscillator indicator, developed by John Ehlers. The main advantage of his way of enhancing the RSI indicator is smoothing with minimum of lag penalty. You can change long to short in the Input Settings WARNING: - For purpose educate only - This script to change bars colors.

Count:59
Name: Moving Average Convergence/Divergence MaCD Backesting
Description: Made this to backtest simple macd trading strategy, had to set it to open long and short positions because i'm not sure how you get it to calculate otherwise.

Count:59
Name: Coding lesson 3 - Color SMA
Description: This script is necessary for training, but not for trade. It isn't recommended to trade using this strategy. The line 1 - SMA , 20 periods If the candle red and low of a candle is higher than the line - to open a long position If the candle green and high of a candle is lower than the line - to open a short position

Count:59
Name: VWAP Trend Follower
Description: This strategy opens a position if the last price is above or below both VWAP and EMA200.
Count:59
Name: Key Performance Indicator
Description: We are happy to introduce the Key Performance Indicator by Detlev Matthes. This is an amazing tool to quantify the efficiency of a trading system and identify potential spots of improvement. Abstract A key performance indicator with high explanatory value for the quality of trading systems is introduced. Quality is expressed as an indicator and comprises the...

Count:59
Name: Free Strategy #02 (ES / SPY)
Description: This strategy was designed to be traded on daily data on the ES and SPY—the strategy was originally developed for NinjaTrader, which displays daily ES data based on RTH hours instead of 24 hours (1440 minute) like TradingView does, so we are presenting the results on the SPY until we figure out how to overcome this hurdle. Strategy #02 Quantity 100 Slippage:...

Count:59
Name: BandPass EOS - 1h
Description: This is a strategy i made for EOS Opens a long position if the PB line (the red line in the oscillator) crossover the low of the band, the zero line or the top of the band. If the PB line makes a crossunder in the top of the band, the zero line or the bottom of the band it closes the long position and immediately opens a short position. Also, the PB value must...


Count:59
Name: Advance-Decline Volume Percent Backtest
Description: Advance-Decline Volume Percent (AD Volume Percent) is a breadth indicator that measures the percentage of Net Advancing Volume for a particular group of stocks, such as an index or ETF. Net Advancing Volume equals the volume of advances less the volume of declines. AD Volume Percent equals Net Advancing Volume divided by total volume for the group. AD...

Count:59
Name: AMRS_LongOnly_PartTimer
Description: This Script is created to back-test the data starting 01/01/2000 based on AMRS strategy. AMRS is long only strategy. It is based on unique calculation around moving averages and 2 year high price. There are few strategies for moving average crossovers but AMRS strategy is unique compared to other moving averages strategies as it has very specific below mentioned...


Count:59
Name: MACD/RSI - edited
Description: This strategy checks MACDcrossover and RSI crossover. When MACD crosses up or down the signal line, it checks if RSI is crossing back OverSold or OverBought lines, respectively, over the past few candles. The period can be changed by the parameter "RSI lookback". The strategy seems to work better for reversal—still a work in progress.

Count:59
Name: Chandelier + BB + EMAS
Description: In this strategy I am using the Emas and bollinger bands' width to determine the entry conditions: Objetive of emas: Determine the current market trend BB: Avoid low volatility market periods Chandelier: Exit trades Long Condition: Once the fast moving average turns above the slow ma is first signal Entry into the trade...

Count:59
Name: Merovinh - Mean Reversion Lowest low
Description: The "Merovinh - Mean Reversion Lowest Low" strategy is a mean reversion trading approach that aims to identify potential reversal points based on the updated lowest low of the specified number of bars. This strategy focuses on the detection of bullish price movements. Works well on Tech giant's shares. Strategy Overview: The strategy detects the lowest low...

Count:58
Name: Daily Open Strategy (DOS)
Description: DOS is a mean-reversal strategy that trades against the previous candle direction as long as it has body greater than the PrevRange paremeter. Best results are obtained in GBP and AUD pairs on daily charts , but of course you can experiment with other assets and timeframes. Strategy parameters include starting and ending dates, the previous candle range (raw...

Count:58
Name: Bitcoin trend RVI and Ema
Description: strategy with two emas and rvi. Only long positions when fast ema above slow ema when rvi gives entry. Only short positions when slow ema above fast ema when rvi gives entry.

Count:58
Name: Long Term Breakout entry + 25% Trailing stop
Description: This script enters on a long term breakout and exits using a 25% trailing stop

Count:58
Name: Small short for Crypto
Description: This is the third modification of VuMAnChu cipher B indicator designed only for short sales. The trigger signal is called sommi bearish diamond (according to my due diligence it has the best performance) You can either fix a stop loss value or close position after crossing sma line. Take profit also can be tuned. Keep in mind that short positions are very...

Count:58
Name: EMA Strategy For Index Futures
Description: This is a simple long-term strategy based on EMA crossover basically designed for Index futures

Count:58
Name: Forex Midpoint Stratejisi For Nasdaq
Description: English Knowledge: Midpoint Strategy; The general calculation method is a strategy that helps determine direction by the intersection of a MA line and the value obtained by dividing the lowest and highest price in the specified length range. Başlangıç Periyodu: The data length of the Midpoint Line. Kaydırma Seviyesi: The number of steps forward or backward of...

Count:58
Name: Short Term RSI and SMA Percentage Change
Description: This strategy utilises common indicators like RSI and moving averages in order to enter and exit trades. The Relative Strength Index (RSI) is a momentum indicator that has a value between 0 and 100, where a value greater than 70 is considered overbought and a value less than 30 is oversold. If the RSI value is above or below these values, then it can signal a...

Count:58
Name: Trend Follower Strategy v2 [divonn1994]
Description: The Trend Follower Strategy that I made classifies red and green candles into tiny, small, and big sizes and will send buy or sell signals depending on if the candle is classified as "big" so you get into and out of a position when there is a big candle. Out during a big green candle to take profit. Out during a big red candle in case the market is turning down....

Count:58
Name: Weis BB Strategy
Description: This is a strategy based on Weis Wave & EMA. Weis Wave Volume is used to determine the overall trend and Bollinger Band to determine the Price breaking out from resistance zones.

Count:58
Name: Help Requested - "Time-Slot" Delay for Crossover Strategy
Description: Hello Tradingview Community, I've been playing around with some various volume-based indicators, and recently have been experiencing a delay in the entries for my strategy for 2 minutes in this scenario. If the time is adjusted, it also is delayed 2 bars. In this example, the "Short" position should enter when the blue line Crosses under the upper green line,...

Count:58
Name: Can someone please help me create an alert for this strategy
Description: Have tried a few different methods but just constantly get errors in different lines of code......been trying for hours *sigh*. Any help would be so greatly appreciated Long when rsi overbought, close trade when rsi oversold and < Vstop //@version=3 strategy("Vstop and RSI", overlay=true) //RSI Section length = input(2, "RSI Period") overSold = input(30,...

Count:58
Name: Combo Strategy 123 Reversal & Commodity Selection Index
Description: This is combo strategies for get a cumulative signal. First strategy This System was created from the Book "How I Tripled My Money In The Futures Market" by Ulf Jensen, Page 183. This is reverse type of strategies. The strategy buys at market, if close price is higher than the previous close during 2 days and the meaning of 9-days Stochastic Slow...

Count:58
Name: AC- MY SCRIPT1
Description: My Ac- My Scrpt1 that the BUY and SELL signals (trend reversals) for many coins defined different tickers in Tradingview charts Terminology explanation: Confirmed Reversal: Oxford T reversal that happened in the last bar and cannot be repainted. Potential Reversal: Oxford T reversal that might happen in the current bar but can also not happen depending upon the...

Count:58
Name: Double Bollinger Binary Options
Description: This script uses 2 Bollinger bands and rsi oversold and overbought region to give signals. Basically, it detects those conditions where the market gets spiked in one direction aggressively(mostly during news) and then reverses back, although signals occur less frequently, this strategy is worth trying. Keep the timeframe for 5 minutes and trade for 5 candles i.e....

Count:58
Name: S&P Bear Warning Indicator
Description: THIS SCRIPT HAS BEEN BUILT TO BE USED AS A S&P500 SPY CRASH INDICATOR ON A DAILY TIME FRAME (should not be used as a strategy). THIS SCRIPT HAS BEEN BUILT AS A STRATEGY FOR VISUALIZATION PURPOSES ONLY AND HAS NOT BEEN OPTIMIZED FOR PROFIT. The script has been built to show as a lower indicator and also gives visual SELL signal on top when conditions are met....

Count:58
Name: Modified Price-Volume Trend Backtest
Description: The related article is copyrighted material from Stocks & Commodities. Strategy by HPotter. You can change long to short in the Input Settings WARNING: - For purpose educate only - This script to change bars colors.

Count:58
Name: Moving Average Cross Strategy early Closing
Description: This is my example for the Moving Average Cross Strategy with early Closing. You can modify the strategy for your individual setup and market. I tested the strategy in DAX30 and SP55

Count:57
Name: Juiced Ichimoku Strat
Description: I saw this indicator and thought I'd try to make it into a script. I can't get an exit when the EMA is between signal lines so it's a long/short strategy until I can figure that part out.

Count:57
Name: Bear Power Strategy Backtest
Description: Bear Power Indicator To get more information please see "Bull And Bear Balance Indicator" by Vadim Gimelfarb.

Count:57
Name: Bearish Harami Backtest
Description: This is a bearish reversal pattern formed by two candlesticks in which a short real body is contained within the prior session's long real body. Usually the second real body is the opposite color of the first real body. The Harami pattern is the reverse of the Engulfing pattern. WARNING: - For purpose educate only - This script to change...


Count:57
Name: Forward testing code block by Canundo
Description: This is purely a code block useable for strategies you want to forward test. No backtest will happen. It's especially important to figure out if a strategy will perform as well in live trading as it does in backtesting since the trades in backtests are calculated differently. It can be a great difference. It's best to test it on 1 minute timeframe or lower. It...

Count:57
Name: ATR Stop Buy Strategy
Description: This strategy trial is let you to giving sell and buy orders with ATR (average true range) and an coefficent for them. it is my first strategy work, needs to be upgraded. USE IT WITH YOUR OWN RISK. IT IS NOT EVEN GUARANTEED TO WORK.

Count:57
Name: Under09_01
Description: Parametros de entradas Activo->btc xbtusd (Bitmex) Temporalidad->2h SL-> 0.2 TP->12.2 Angulo->4.2 p->2 longitud->27 //@version=4 // // ▒▒▒▒▒▒▒▒▒▒▒▒▒▒▒▒▒▒▒▒▒▒▒▒▒▒▒▒▒▒▒▒▒▒▒▒▒▒▒▒▒▒▒▒▒▒▒▒▒▒▒▒▒▒▒▒▒▒▒▒▒▒▒▒▒▒▒▒▒▒▒▒▒▒▒▒▒▒▒▒▒▒▒▒▒▒▒▒▒▒▒▒▒▒▒▒▒▒▒▒▒▒▒▒▒▒▒▒▒▒▒▒▒▒ // //Ultima version underground09 strategy(title = " underground09", shorttitle = "Under09", ...

Count:57
Name: Position Investing by SirSeff
Description: This is for my group. The ideas is to dollar cost average whenever the band is green and pause investing when the band is red. This gives you two things: 1. You'll minimize averaging down. Ibig sabihin maiiwasan mo bumili tapos kinabukasan down agad. 2. you'll maximize averaging up or scaling up. Ibig sabihin, most likely nakaka bili ka na green days and green...

Count:57
Name: Silver Long/Short
Description: Combines Gold and Silver price ratio with SMA trend indicators for buy and sell signals.

Count:57
Name: Starting Template
Description: This script sets defaults that I like to start with: Trade commission set to 0.25% Allow multiple buys before sells Fixed trade size Also included are setting a minimum desired gain (change gain_protection to 0 if you want to sell regardless of your gain), and buying only if it will reduce your average bought price (change avg_protection to 0 to turn this...


Count:56
Name: Break out strategy 0
Description: Breakout strategy (for verification) Not recommended. If you enter with a high (low) breakout for any period ブレークアウトストラテジー(検証用) 推奨するものではありません。 任意の期間の高値(安値)ブレークアウトでエントリーした場合


Count:56
Name: Villa Dinamic Pivot Supertrend Strategy
Description: This strategy works better on AUD/USD in the 15 min timeframe. It uses the Pivot Supertrend to enter trades based on different filters such as: - Simple EMA filter: that the 3 EMAs should be in order - DEMA angle: you can choose the DEMA Angle threshold and the look back to check the angle to just trade trades with DEMA at a certain angle - Simple DEMA filter:...

Count:56
Name: Linear Cross Trading Strategy
Description: Linear Cross Trading Strategy The Linear Cross trading strategy is a technical analysis strategy that uses linear regression to predict the future price of a stock. The strategy is based on the following principles: The price of a stock tends to follow a linear trend over time. The slope of the linear trend can be used to predict the future price of the...

Count:56
Name: Build A Bot
Description: This is the Robot we built during the 60 Minute Build-A-Bot webinar on September 12, 2018. We had a great time, and a lot of participation and the best part was that we finished up this robot and even ran a backtest in exactly 60 minutes! We built this robot based on recommendations and suggestions from those who were attending live. Lots of pieces in this robot,...

Count:56
Name: HYE Mean Reversion SMA [Strategy]
Description: An RSI filtered version of PJ Sutherland's Jaws Mean Reversion algorithm. "Long" on the close when; 1-) 2 period simple moving average closes 3% or more below the 5 period simple moving average, 2-) 5 period exponential average of the 2 period RSI is below 30. "Exit Long" on the close when; 1-) 2 period simple moving average closes above the 5 period moving...

Count:56
Name: VWAP Push Strategy
Description: This strategy is unfortunately not finished yet. A pretty simple strategy. If price broke through VWAP and had three consecutive candles following the breakthroughs trend, the high of the third candle will be drawn. If this happened after a crossover of the vwap and price breaks through the high of the third candle, strategy will go long. Short will be the same...

Count:56
Name: Infiten Slope Strategy
Description: This model is an index fund trading model, which uses moving averages and price percentage oscillators to minimize downside exposure.

Count:56
Name: [Strategy Alert Webhook Demo] Buy One Sell One
Description: Buy One Sell One Two Options to send Alert Order via Webhook 1. Order fill events with `alert_message` on strategy.close(), strategy.entry(), strategy.exit() and strategy.order() NOTE: Need to fill the Alert Creation box with `{{strategy.order.alert_message}}` 2. Send Alert through `alert()`


Count:55
Name: Fisher Transform Indicator based on Ehlers Backtest
Description: Use 9 as length and 8h timeframe for crypto

Count:55
Name: VIX - SHORT - SVXY - Daily Chart (Oldinvestor)
Description: This looks at he VIX and trades SVXY. Load SVXY and run the script on SVXY. INPUTS: Entry - You set this number to how high you want the VIX to go before SVXY will be bought. Keep in mind it buys the bar after a trigger, results may be confusing Exit - You set this number to how low you want the VIX to go before SVXY will be sold. Year - This as stated, It...

Count:55
Name: QuickSilver Intraday using RSI
Description: This is a simple intraday strategy using very basic intraday super indicators - RSI & VWAP for working on Stocks . You can modify the values on the stock and see what are your best picks. Comment below if you found something with good returns Strategy: Indicators used : The Relative Strength Index (RSI) is one of the most popular and widely used momentum...

Count:55
Name: Simple Momentum and Trend, Fixed PnL Strategy for SPY 1D [SR]
Description: This strategy uses an ATR rule to assess momentum and a TSI rule to assess bullish or bearishness It has a fixed stop at 50 points, and fixed take profit at 300 pips It provides a very satisfyingly smooth equity line with a max drawdown below 5% and realized profit over 200% This is the initial version as I work out optimizations and add plots to the chart based...

Count:55
Name: Cross Exchange Change
Description: The indicator itself looks at different Exchanges and compares the change in price of them. If one spikes up, we go long with it as we assume our Exchange will follow. Vice versa for short.

Count:55
Name: Noro's Distance Strategy v1.0
Description: Uses: - DCB indicator - Fast RSI indicator as a filter - Martingale (!)

Count:55
Name: Extracting The Trend Strategy Backtest
Description: The related article is copyrighted material from Stocks & Commodities Mar 2010 You can use in the xPrice any series: Open, High, Low, Close, HL2, HLC3, OHLC4 and ect... You can change long to short in the Input Settings Please, use it only for learning or paper trading. Do not for real trading.

Count:55
Name: [TH] Adaptive Trend : Strategy
Description: Adaptive Trend : Strategy *** It should be used with 'heikin ashi' chart *** Super Trend Basically, it is super trend strategy ( Rajandran R Supertrend ) - My idea is, 1. (scale) Factor of super trend is related with sensitivity of Up/Down trend change 2. Constant Factor cause failure of super trend strategy when market prices variance is low (...

Count:55
Name: McClellan Oscillator Strategy
Description: Buy and sell programs when 5 day EMA goes above and below zero, respectively. Useful for LEVERAGED ETF trading such as SPXL, TECL, FNGU, etc. Not so much for general portfolio holdings.


Count:54
Name: Statistical Volatility - Extreme Value Method Backtest
Description: This indicator used to calculate the statistical volatility, sometime called historical volatility, based on the Extreme Value Method. Please use this link to get more information about Volatility. You can change long to short in the Input Settings WARNING: - For purpose educate only - This script to change bars colors.

Count:54
Name: Configurable Multi MA Crossover Voting System
Description: This strategy goes long when all fast moving averages that you have defined are above their counterpart slow moving averages. Long position is closed when profit or loss target is hit and at least one of the fast moving averages is below its counterpart slow moving average. The format of the config is simple. The format is : FASTxSLOW,FASTxSLOW,... Example : If...

Count:54
Name: MA X 200 BF
Description: Go long when the price closes above the 200 SMA. Go short when the price crosses under the 200 SMA. Keep it simple.

Count:54
Name: [mdeacey] EMA% Channel + Bollinger Band Trending Strategy
Description: This strategy is based off the users selection of an EMA and percentage defined middle, upper and lower channels. The strategy longs if the price crosses the middle to upper channel until such time that a "reversal candle" (that exceeds the averages of 3 and 9 above the EMA 3) is found – and then shorts that reversal candle in the hope the price will change state...

Count:54
Name: 4 MA Strategy + Position Management
Description: // This is a simple crossover Moving Average strategy, good for long term crypto trades. // It buys when the MA "X" crosses up the MA "Y", viceversa for shorts. // Both MAs are selectable from the Inputs section in the front panel. // There is also a Position Management option thats // sizes positions to have the same USD risk (using leverage) on each...

Count:54
Name: Maguila Strategy by Rodrigo Cohen
Description: READ BEFORE USE!!! !!!ALERT!!!! THIS CODE ONLY WORKS WITH WDO AND WIN , BOTH WITH TIMEFRAMES 1 MINUTE AND 5 MINUTE. This is a test to the Maguila strategy created by Rodrigo Cohen. This code MUST be validaded by Rodrigo Cohen, use ONLY for tests. Some results are different from Cohen's videos, so the McGuinley indicator needs some ajustments. ...


Count:54
Name: Fibonacci EMA averages (21, 34, 55, 89, 144)
Description: Just a simple script that plots the following EMA averages that are based on the fibonacci sequence: 21, 34, 55, 89, 144


Count:54
Name: Triple Moving Average on Crude Strategy
Description: Basic strategy combining Turtle concepts with Niko Bakkers Phase Analysis study. Fun fun.

Count:54
Name: Buy/Sell on the levels
Description: This script is generally My describe is: There are a lot of levels we would like to buy some crypto. When the price has crossed the level-line - we buy, but only if we have the permission in array(2) When we have bought the crypto - we lose the permission for buy for now(till we will sell it on the next higher level) When we sell some crypto(on the buying level...

Count:54
Name: Volatility Finite Volume Elements Strategy
Description: The FVE is a pure volume indicator. Unlike most of the other indicators (except OBV), price change doesn?t come into the equation for the FVE (price is not multiplied by volume), but is only used to determine whether money is flowing in or out of the stock. This is contrary to the current trend in the design of modern money flow indicators. The author...

Count:54
Name: Impulse Strategy Signals V2
Description: This is a low timeframe strategy based on SMMAs and RSI, shared by Investishare. This script turns the indicator into a strategy and allows for several variables to be customized.

Count:54
Name: cii strategy
Description: 파인스크립트 공부한다고 만들어봤는데 혼자하니깐 피드백이 안되서 올려봅니다. 원리는 짧은 기간의 cci(14)가 긴 기간의 cci(56)을 뚫으면 매수, 뚫리면 매도하게 해놨습니다. 단기 분봉에는 거의 안 맞고 3시간봉 12시간봉에 맞춰서 쓰시면 됩니다. 횡보장때 승률이 많이 낮습니다..

Count:53
Name: Buy Any Bar By Chenyco
Description: Buys amount of shares by bars with specified amount of money (100$ for a month bar for example). Including commissions.

Count:53
Name: BarUpDn Strategy
Description: This is a bar up/down strategy where you can specify how many bars up to buy and how many bars down to sell. It also has code to check and make sure the condition is still true when launching the official alert, which helps back testing and live results line up, however be sure to enter commission and slippage into the properties to accurately reflect profits. I...

Count:53
Name: Finite Volume Elements (FVE) Backtest
Description: The FVE is a pure volume indicator. Unlike most of the other indicators (except OBV), price change doesn?t come into the equation for the FVE (price is not multiplied by volume), but is only used to determine whether money is flowing in or out of the stock. This is contrary to the current trend in the design of modern money flow indicators. The author...

Count:53
Name: Coinbase_3-MIN_HFT-Strategy
Description: This conceptual strategy trades against the short-term trend. The first position can be either long or short. In the short-term, prices fluctuate up and down on wide spread exchanges. And if the price moves to one side, the price tends to return to its original position momentarily. This strategy set stop order. Stop price is calculated with upper and lower shadows.

Count:53
Name: BLANK Strategy + TSL + Backtestrange
Description: - I often see ppl struggeling do the first own strategy - this is an example, for a smooth start - EDIT it to your needs ( DELET my EXAMPELS and add your INPUTS/CONDITIONS) - i added also a Backtestrange, so you can test your Strategy in different marketphases - also added a trailing-stop-loss

Count:53
Name: MACD 4H Strategy
Description: This strategy is a basic example of using MACD AND the instrument must be found an appropriate timeframe (4H recommended) before being tested with.

Count:53
Name: STEM_MATCS_BTC_STRATEGY
Description: As promised here is the strategy for using STEM and MATCS. The line of code for the buy and sell signals are bare bones. You will even notice that the ATR_CS is not being included in the logic for the buy/sell signals, which causes the ATR fine tuning not to function. I am presenting the code in this way because I want to encourage people to explore their own...


Count:53
Name: Swing Trading SPX Correlation
Description: This is a long timeframe script designed to benefit from the correlation with the Percentage of stocks Above 200 moving average from SPX At the same time with this percentage we are creating a weighted moving average to smooth its accuracy. The rules are simple : If the moving average is increasing its a long signal/short exit If the moving average is decreased...

Count:53
Name: Moving Averages Testing
Description: Script for testing price crossing moving average or two moving averages crossing as trade entry


Count:52
Name: Portfolio Performance - Effects of Rebalancing
Description: Function: - Can be used to evaluate the performance of a portfolio containing 2 assets over a set time interval - Shows the % return of the portfolio over the time interval defined by the user - Includes a threshold rebalancing algorithm to show the effects that rebalancing has on the portfolio over the long term - Created to evaluate of the performance of...

Count:52
Name: Candle analysis & long/short strategy (HF) inspired by TurtleBC
Description: This script is based on the candle meaning and a period based trading strategy

Count:52
Name: GANN_EMA_VWAP_BY_THEHOUSEOFTRADERS
Description: GANN LEVELS + VWAP + 3 EMA= 50,100 & 200 GANN LEVELS = Eg. 10.25 = BLUE, 10.50 = PINK, 10.75 = BLUE, 11 = RED (VIP LEVEL)

Count:52
Name: Combo Backtest 123 Reversal and ADXR
Description: This is combo strategies for get a cumulative signal. Result signal will return 1 if two strategies is long, -1 if all strategies is short and 0 if signals of strategies is not equal. First strategy This System was created from the Book "How I Tripled My Money In The Futures Market" by Ulf Jensen, Page 183. This is reverse type of strategies. The...

Count:52
Name: HAERI 𝐍𝐄𝐓𝐖𝐎𝐑𝐊
Description: this is for Haeri that prepared for trading view and crypto market

Count:52
Name: GBPUSD MACD 1min Long Only
Description: This MACD indicator uses two lines for long and sell long. It also uses a MACD indicator line with a historian. When the MACD historian crosses over the buy line, a long signal is executed. When the MACD historian crosses over the sell line, a close entry is signal is executed. There is a also a built in stop loss and you can adjust the buy and sell lines...

Count:52
Name: Ease of Movement (EOM) Backtest
Description: This indicator gauges the magnitude of price and volume movement. The indicator returns both positive and negative values where a positive value means the market has moved up from yesterday's value and a negative value means the market has moved down. A large positive or large negative value indicates a large move in price and/or lighter volume. A small...


Count:51
Name: [mdeacey] EMA% Channel + BB Range Strategy
Description: This strategy is based off the users selection of an EMA and percentage defined channel. The strategy longs when a red "reversal candle" (that exceeds the averages of 3 and 9 above the EMA 3) is found until such time that either the price goes outside the Bollinger Band or the green reversal candle is found. The same but opposite process for shorts. If the price...

Count:51
Name: CMOfilt Backtest
Description: This indicator plots a CMO which ignores price changes which are less than a threshold value. CMO was developed by Tushar Chande. A scientist, an inventor, and a respected trading system developer, Mr. Chande developed the CMO to capture what he calls "pure momentum". For more definitive information on the CMO and other indicators we recommend the book The...

Count:51
Name: FTSE Fridays
Description: This code snippet below is a quick and dirty follow up to some statistical analysis performed on the FTSE 100. It showed that over the long run, (since 1995) going long on a Friday appeared to have a statistical edge (53%). As a bit of fun, I wanted to create a quick pine script backtest to test this and see if it is possible to profit from it. After all, the...

Count:51
Name: thailh
Description: first script all in one contain EMA, RSi ádkals;fjalskcm,z.xmc.,zxmcaksdjalksdjalskdjalskdja,xcmz.,xmvz.,xmv.z,xv

Count:51
Name: EMA 9 & 20 Cross Strategy
Description: This is for 9 and 20 Exponential Moving Averages to identify buy and sell opportunities

Count:51
Name: Mini-Pullbacks Supertrend
Description: This WOP script is trying to check the pullbacks in a trend and open a position when the pullback is finishing

Count:51
Name: [WAI GUA]
Description: 这是一个数字货币合约的指标策略,集合多个指标,分析权重,做最安全的开单,和止损等。 目前初级版只用了均线,胜率也不高,大伙可以和我一起调试,永久开源免费。 交流探讨请加QQ群:795307664

Count:51
Name: rt maax EMA cross strategy
Description: this just sample of our strategies we published with open source, to learning our investor the way of trading and analysis, this strategy just for study and learning in this strategy we use expontial moving avarage 20 , 50 , 200 and the we build this strategy when the price move up ema 200 and ema 20,50 cross up the 200 ema in this conditions the strargey will...

Count:51
Name: [XRP][1h] Chanu Delta inspired — Breakeven Strategy
Description: Hello, this is my first TV contribution. I usually don't publish anything but the script is a quick review of an other contributor (Chanu Delta V3 script ) I reverse engineered this indicator today as I wanted to test it on other contracts. The original version (which aims to be traded on BTC) has been ported to XRP (as btc and xrp prices are narrowly...

Count:51
Name: PlutusX Tutorial Strategy | Fast RSI
Description: Hi PlutusX Family, Here is a simple FAST RSI script i built during a "How to Build a Trading Script Tutorial". If you have questions message us here. Thank you!

Count:51
Name: Adam Smith - MovingAvg Cross
Description: Simple Moving Average Cross script. Test on stocks and currency. For stocks test shorter time periods, meaning intra-day time periods such as 3min to 30min and so on to fit what is best. For currency, try longer periods with this model such as day to weeks depending on which currency. NOTE: Take a look at your Max Drawdowns when testing. This will be the main...

Count:51
Name: SB_Variable_Resistance Version 1.0
Description: It is a simple test strategy. The strategy involves variable resistance. If the price closes above the resistance a long order is placed and when price closes below the resistance a short order is placed. Comment the perfect combination of indicators for it and will try to incorporate those indicators into it in the next version. Message if you think of any...

Count:51
Name: Simple Trend Following Strategy
Description: Super simple short/long entry signal strategy based off the one used by the "Turtles" with 4 simple moving averages rolled into one indicator.

Count:51
Name: Moving Average Crossover
Description: This indicator is based on ema 5 and ema 20, when ema 5 crosses over ema 20, the line will be green, when ema 5 crosses down it will be red This indicator has been accompanied by a strategy so we can see the results through the strategy tester, this strategy there is only a long, I recommend using a weekly timeframe because the volatility is lower and minimal...

Count:51
Name: Wick Reversal
Description: Hi the given strategy is based on detecting hammer and shooting star patterns to trade early reversals.

Count:51
Name: EMA + Bullish Engulfing Candle Pattern Strategy
Description: Hello Guys! Nice to meet you all! This is my first open source script! ### Long Condition 1. Bullish Engulfing Candle 2. No doge Candle 3. Present volume should be bigger than the previous volume (20%) 4. Trend filter (with 2 EMAs) ### Close Condition 1. When trend Changes 2. When Bearish Engulfing Candle appears ### No stop loss and take profit.

Count:50
Name: Noro's MAs Tests
Description: Trade strategy from one moving average. To choose what sliding average it is more effective to use for this pair and this timeframe. Types: 1 = SMA = Simple Moving Average 2 = EMA = Exponential Moving Average 3 = VWMA = Volume-Weighted Moving Average 4 = DEMA = Double Exponential Moving Average 5 = TEMA = Triple Exponential Moving Average 6 = KAMA =...

Count:50
Name: High - EMA Strategy Backtest
Description: This indicator plots the difference between the High (of the previous period) and an exponential moving average (13 period) of the Close (of the previous period). You can use in the xPrice any series: Open, High, Low, Close, HL2, HLC3, OHLC4 and ect... It buy if indicator above 0 and sell if below. You can change long to short in the Input Settings Please,...

Count:50
Name: Outside Day
Description: This strategy is taken from Perry Kaufman's book "Trading System and Methods". You can enter on the direction of the candle, or opposite to it. I find that the opposite tends to yield better results in volatile assets, allowing a better reward to risk ratio. There is no stop loss in this strategy, only a fixed take profit and a time limitation.

Count:50
Name: Mechanical Trading Strategy
Description: The "Mechanical Trading Strategy" is a simple and systematic approach to trading that aims to capture short-term price movements in the financial markets. This strategy focuses on executing trades based on specific conditions and predetermined profit targets and stop loss levels. Key Features: Profit Target: The strategy allows you to set a profit target as a...

Count:50
Name: BBPullback1.0.2
Description: This is a simple strategy script based on Bollinger Bands pullbacks. The strategy is simple, as follows: For LONGS: At the close of any candle, it check to see if this candle is an UP candle where the low broke below the lower Bollinger Band. If so, we call this the trigger candle. For the next bar, we issue a BUY signal if the price breaks above the high of the...

Count:50
Name: rang3r: A support/resistance indicator with an included cloud.
Description: This indicator finds the minimum and maximum values within a set time period. Crosses of these minimum and maximum values are noted with the green/red background colours. The indicator also produces a "cloud", which is generated through the 0.382 and 0.612 points between the two maximum and minimum lines. Settings: Entry Period: Time period the indicator...


Count:50
Name: SMA Diff strat
Description: Hello Tradingviewers I don’t claim that anything I share is original, but I will never intentionally steal someone else’s work other than using plug and play pieces of code that are shared publicly This strategy's code is the same from the previous "study" post that can be found here: It's primarily made for back-testing...

Count:50
Name: Ujanja
Description: Ujanja uses Zero Lag EMA combined with Hull Moving Average for smoothing purposes. It is a less aggressive. It is only to be used with huge volume , huge momentum and high volatility to get trend analysis... It doesn't repaint at all. Advised use : Trades highly volatile Crypto currencies, stocks as well as Gold . It is only to be used with huge...


Count:50
Name: BB and KC Strategy
Description: This script is designed as a TradingView strategy that uses Bollinger Bands (BB) and Keltner Channels (KC) as the primary indicators for generating trade signals. It aims to catch potential market trends by comparing the movements of these two popular volatility measures. Key aspects of this strategy: 1. **Bollinger Bands and Keltner Channels:** Both are...


Count:50
Name: Moving Average Rainbow (Stormer)
Description: This strategy is based and shown by trader and investor Alexandre Wolwacz "Stormer". Overview The strategy uses 12 moving averages (default EMA) to identify trends and generate trading signals opening positions. Allowing to select the type of moving average and length to be used. The conditions includes relationship between moving averages, the position of the...

Count:50
Name: Baracuda Ichimoku/StochRSI Strategy
Description: Combined Ichimoku + Stoch RSI strategy

Count:50
Name: Move Up Stops
Description: This script creates a stop loss level and then moves it up in 5% increments as prices increase. Basically, it checks to see if the lowest low of the last 7 days is above a certain level. If yes, it sets the stop at that level. It then checks for the next highest level and keeps going until the price is not above a level. Those variables are then set to the level...

Count:50
Name: N Bars Down Backtest
Description: Evaluates for n number of consecutive lower closes. Returns a value of 1 when the condition is true or 0 when false. WARNING: - For purpose educate only - This script to change bars colors.

Count:50
Name: Bolinger strategy v1 open
Description: Find lows based on divergence on bollinger bands . Works great on stocks and index, no success on forex. Different stock/index requires different values. Exit is not perfect, often on the safer side. Example settings: NASDAQ:OMXS30, 30m: 25 0.452 0.42 0.453 2 62 20 Lower bbrower = buys harder dips, too low will cause buy during fall. Higher bbrhigher = buys on...


Count:49
Name: [EURUSD60] BB Expansion Strategy
Description: Overview This is a strategy that can be used in the EURUSD 60 time frame. It is a trend-following method that uses Bollinger Bands Expansions. The idea of using Bollinger Bands expansion is well known to the general public, but I don’t know any strategy that this idea has been PINE coded. The three main components of this strategy are as follows. ・Long term BB...


Count:49
Name: GRB Long
Description: This strategy generates swing trading signals based on the Golden Ratio Breakout. This is a long-only strategy, entry is breakout and retest of 38.2 fib level and SL is 23.6 fib level from last 21 days. These are only suggestions and NOT recommendations. Please do your own due diligence before taking ANY action. No responsibility for any profits/LOSSES.

Count:49
Name: Tangram Bot 2 - Smartbot
Description: Primeira Versão do Script Tangram Bot 2 da Smartbot para tradingview. A intenção é agilizar e fazer um teste prévio e rápido do setup. O resultado indicado aqui jamais corresponderá a um resultado real. É apenas uma ferramenta de estudo. Ainda falta fazer e melhorar a parte de gestão de risco. Caso queria fazer alguma sugestão ao cógido para melhorar a gestão de...

Count:49
Name: hullma percentage lines
Description: What you see is a hullMA (user defined length) with 4 percentage bands attached to it. The bands percentage and hullMA length can be adjusted to see how the trading strategy performs. I implemented only long trades with a crossover from one of the lower bands, when it crosses over a high band it exits the trade. Improvement coulde be: -more percentage...

Count:49
Name: percentrank strategy
Description: Srategy for percentrank Percent rank is the percents of how many previous values was less than or equal to the current value of given series. long entry: intersection line 1 from bottom to top short entry: crossing line 2 from top to bottom Стратегия для индикатора percentrank Процентный рейтинг — это процент от количества предыдущих значений, которые были меньше...

Count:49
Name: (H-L)/C Histogram Backtest
Description: This histogram displays (high-low)/close Can be applied to any time frame. WARNING: - For purpose educate only - This script to change bars colors.

Count:49
Name: [VJ]War Machine PAT Intra
Description: This is a simple intraday strategy for working on Stocks . You can modify the values on the stock and see what are your best picks. Comment below if you found something with good returns Strategy: Indicators used : The Choppiness Index is designed to determine whether the market is choppy or trading sideways, or not choppy and trading within a trend in either...

Count:49
Name: The Pivot Detector Oscillator Backtest
Description: The Pivot Detector Oscillator, by Giorgos E. Siligardos The related article is copyrighted material from Stocks & Commodities 2009 Sep You can change long to short in the Input Settings WARNING: - For purpose educate only - This script to change bars colors.

Count:49
Name: Connor's R3 Strategy
Description: Created based on Connor's R3 Strategy. However, the signal always appears on the next candle, where it should appear at the closing price of the same candle.


Count:49
Name: Consecutive Weekly Up w/o doji
Description: Based on the built-in Consecutive Up/Down strategy by TradingView . Long only

Count:49
Name: [VJ]Thor for MFI
Description: This is a simple intraday strategy for working on Stocks or commodities . You can modify the start time and end time based on your timezones. Session value should be from market start to the time you want to square-off Important: The end time should be at least 2 minutes before the intraday square-off time set by your broker Comment below if you get good...

Count:48
Name: Gab EMA + rsi + bb
Description: scrypt I made for a friend you are welcome bro ;) simple strategy BB Default RSI 3 200 ema 200 EMA gives the trend direction. if RSI is over bought and candle touch BB upper band then there will be buy entry. (Price must be above 200 ema) If RSI is over sold and price touch bb lower band then there will be sell entry. (Price must be below the 200 ema) SL...

Count:48
Name: Stochastic Strategy
Description: This strategy is designed to make trading decisions based on the Stochastic Oscillator (Stoch) indicator with settings of (7,2,2). The strategy opens a long (buy) position when the Stoch indicator crosses above the 50 level from below. Conversely, it opens a short (sell) position when the Stoch indicator crosses below the 50 level from above. Additionally, when a...

Count:48
Name: "NoSKi Hammer/Star /w angle of ema Backtester %
Description: Applied the angle of ema filter to stars formed in an uptrend, and hammers in a downtrend to try to pick good trading entries Uses the average angle of the ema over the last 20 bars (Please note: the angle calculation default value is calibrated for BTCUSD . There is no way currently to code it to be used across multiple pairs. The price to bar ratio has to be...

Count:48
Name: Multi-TimeFrame MA
Description: There is a youtube channel which ı follow, He shared an educational video and ı want to share it with you. You can also follow it in Youtube , its name is "Xmaxpro - Kriptocu" You can see how to develop a multi-time-frame trading strategy and test this MA strategy.

Count:48
Name: dirt cheap yet elegant RSI Strategy
Description: For Educational Purposes. Results can differ on different markets and can fail at any time. Profit is not guaranteed. This only works in a few markets and in certain situations. Changing the settings can give better or worse results for other markets. This is a good way to show off a good looking strategy, atleast in paper, with minimal effort involved in the...

Count:48
Name: TEMA/DEMA/HMA Strategy
Description: The TEMA/DEMA/HMA strategy is a basic trend follower looking for when the TEMA crosses above the DEMA as a buy signal and the opposite for the sell. The HMA is used as a longer more Dynamic MA to confirm the wider trend to filter out bad trades. This is a basic idea that can be expanded on using different indicator types to either add signals or filter out...

Count:48
Name: Cruzameto 2MM
Description: Cruzamento de duas médias A compra será feita após o fechamento do candle que trazer a média rápida acima da média lenta. A venda será feita após o fechamento do candle que trazer a média rápida abaixo da média lenta. Melhores resultados obtidos no timeframe de 15Min no WDON% WDON%

Count:48
Name: Elastic Volume Weighted Moving Average Cross Strategy
Description: Simple EVWMA Cross Strategy No Risk Management ETC Results aren't amazing - mainly a thought exercise

Count:48
Name: TPS - FX Trade
Description: I based my strategy on the Lagging Span 2 line in the Ichimoku Cloud. I actually designed the strategy for the DAX Germany index 3 Minutes period, but you can use it on any instrument you want. I would like to point out some points that you should pay attention to when optimizing the strategy for the instrument you want to use. Position Take Profit and Stop Loss...

Count:48
Name: Chande Kroll Stop
Description: 今天和大家分享Chande Kroll Stop 回测, 信号采用了上限线和下限线共通反向趋势而决定买卖信号,如果有新的构思能提高买卖信号欢迎在留言区发表你的建议,祝你交易开心!

Count:48
Name: Sunny Supertrend Strategy
Description: It provides fantastic accuracy in anticipating trend reversals and works perfectly as a timing indicator. Thus it increases patience skills on the market and helps traders enter and exit in the markets at the right moment. The adaptability of TD sequential is also part of its strength. It can be applied to any timeframe and any asset class to the point that it...

Count:48
Name: High/Low Breaker Backtest 1.0
Description: Play with backtesting results from high/low breaker indicator

Count:48
Name: Coding lesson 1
Description: In the strategy of only 6 lines of a program code. It is less just not to make. This script is necessary for training, but not for trade. It isn't recommended to trade using this strategy. If the price is higher than SMA with the period of 7 bars - to open a long position If the price is lower than SMA with the period of 7 bars - to open a short position

Count:48
Name: GHG RETRACEMENT MODE 1
Description: This scripts are based on breakout and fibonacci retracement To trade using this Signal, you need to 1. Wait for buy/sell signal 2. When a signal ready follow these steps. Eg. STEPS TO BUY 1. When a signal appear on candle, pull fibonacci retracement from swing high of SIGNAL CANDLE, to swing low of pervious 2 candle. 2. Then place a pending order at level,...

Count:48
Name: Tulkens ETHUSDC StrategyV3
Description: Hello, My first strategy! I'nt know how to get it working on poloniex. Can somebody help me pls? I also want to add a stop-loss off some kind but i coudn't get it to work properly. Please comment on what i need to aprove.

Count:48
Name: volume rsi strategy by pro trader123
Description: this strategy includes volume and rsi and plots a buy signal when rsi is below 30 with high average volume and takes profit when the rsi 14 ema crosses rsi

Count:47
Name: Bollinger Bands & Fibonacci Strategy
Description: The Bollinger Bands & Fibonacci Strategy is a powerful technical analysis trading strategy designed to identify potential entry and exit points in financial markets. This strategy combines two widely used indicators, Bollinger Bands and Fibonacci retracement levels, to assist traders in making informed trading decisions. Key Features: Bollinger Bands: This...


Count:47
Name: BB+STOCH RSI v2
Description: Developed for one of my followers. The basic idea is that the buy signal is generated by stoch and bb. However, If price hits the upper line or trend return crossing under midline, the strategy closes the position.

Count:47
Name: Volume & Intraday Script
Description: I am still learning pinescript, and part of this was created using the Pine Script language reference manual. This includes looking at the time series, a fixed length, and the default intraday_loss variables. This also includes the basic fixed lengths for an swma (Symmetrically weighted moving average) and the script to start creating a strategy. All in all this...

Count:47
Name: Trend Following
Description: Moving Average Period:** This is the period of the moving average that will be used to identify the trend. A good starting point is 10 days. * **Candlestick Patterns:** The candlestick patterns that will be used to identify potential reversals in the trend. Some of the most common candlestick patterns include the bullish engulfing pattern, the bearish engulfing...

Count:47
Name: Combo Backtest 123 Reversal and Absolute Price Oscillator (APO)
Description: This is combo strategies for get a cumulative signal. Result signal will return 1 if two strategies is long, -1 if all strategies is short and 0 if signals of strategies is not equal. First strategy This System was created from the Book "How I Tripled My Money In The Futures Market" by Ulf Jensen, Page 183. This is reverse type of strategies. The...

Count:47
Name: 5212 EMA Strategy
Description: ver 01 23 December 2021 This strategy using : - 3 EMA period 50, 100, 200 - stochastic RSI slow Long Cond : - Stochastic RSI cross below 20 - EMA 50 > 100 > 200 Short Cond : - Stochastic RSI cross above 80 - EMA 50 < 100 < 200 Sleeping Mode - EMA 50 between EMA 100 & EMA 200

Count:47
Name: Simple Moving Averge Strategy
Description: Simple Vs. Exponential Moving Averages Formula for Exponential Moving Average (EMA) \begin{aligned} &\begin{aligned} EMA_{\text{Today}}=&\left(\text{Value}_{\text{Today}}\ast\left(\frac{\text{Smoothing}}{1+\text{Days}}\right)\right)\\ &+EMA_{\text{Yesterday}}\ast\left(1-\left(\frac{\text{Smoothing}}{1+\text{Days}}\right)\right)\end{aligned}\\ &\textbf{where:}\\...

Count:47
Name: BUY/SELL on the levels only
Description: My discribe is: There ara a lot of levels we would like to buy some crypto. When the price has acrossed the level-line - we buy, but only if we have the permission in array(2) When we have bought the crypto - we lose the permission for buy for now(till we will sell it on the next hiegher level) When we sell some crypto(on the buying level + 1) we have the...

Count:47
Name: High and Low Levels Backtest
Description: This script shows a high and low period value. Width - width of lines SelectPeriod - Day or Week or Month and etc. LookBack - Shift levels 0 - current period, 1 - previous and etc. You can change long to short in the Input Settings WARNING: - For purpose educate only - This script to change bars colors.

Count:47
Name: Combo Backtest 123 Reversal & Chande Forecast Oscillator
Description: This is combo strategies for get a cumulative signal. First strategy This System was created from the Book "How I Tripled My Money In The Futures Market" by Ulf Jensen, Page 183. This is reverse type of strategies. The strategy buys at market, if close price is higher than the previous close during 2 days and the meaning of 9-days Stochastic Slow...

Count:47
Name: Buy-and-hold strategy stats
Description: When you develop your own strategy you should compare its performance to the "buy-and-hold" strategy (you buy the financial instrument and you hold it long term). Ideally your strategy should perform better than the buy-and-hold strategy. While the net profit % of the buy-and-hold strategy is available under the "Performance Summary" tab of the "Strategy Tester"...

Count:47
Name: Buy every Month
Description: This strategy script simulates, if you invest every new month. Features: You can set a Date Range You can set your Sparrate/how much you want to invest every month In the Right Corner you can see, how much you invested so far In the End of the Date Range, all positions get closed and you can see your performance. Note: Please ignore the...

Count:47
Name: Combo Backtest 123 Reversal and Accelerator Oscillator (AC)
Description: This is combo strategies for get a cumulative signal. Result signal will return 1 if two strategies is long, -1 if all strategies is short and 0 if signals of strategies is not equal. First strategy This System was created from the Book "How I Tripled My Money In The Futures Market" by Ulf Jensen, Page 183. This is reverse type of strategies. The...

Count:47
Name: Vortex and RSI ts 2020
Description: * System long only (for shares). * Enter if Vortex up crosses up vortex down and there is the classical second test of a close higher than previous' high * Exit if a) RSI crosses under 70 OR b) on the contrary, Vortex down crosses up vortex up and there is the classical second test of a close lower than previous' low * fixed money management...

Count:47
Name: MM tester
Description: You can test a two ema / sma strategy changing type of MM and length on settings. If you get a profitable combination you can share it in the comments :)

Count:47
Name: strategy.convert_to_symbol() demo
Description: A strategy demonstrating the new strategy.convert_to_symbol() and strategy.convert_to_account() functions introduced in Pine v5. Try selecting a custom "Base Currency" under Properties to see how the conversion works. Note: The conversion functions seem to work as expected on BTCUSD, but not on BTCUSDT. This is likely because USDT is not recognized as a currency.

Count:47
Name: Strategy Oil Z Score
Description: Objective is to find forward looking indicators to find good entries into major index's. In similar vein to my Combo Z Score script I have implemented one looking at oil and oil volatility. Interestingly the script out performs WITHOUT applying the EMA in longer timeframes but under performs in shorter timeframes, for example 2007 vs 2019. Likely due to the...

Count:47
Name: Equity Curve Trading with EMA
Description: What Is Equity Curve Trading? In equity curve trading, traders apply a moving average to the curve. The idea is when the equity curve drops below the moving average, the strategy is put on hold. This is done to stop losses when either the hopes of the plan working start dimming or when the trader knows he cannot afford more losses on a strategy. The trader can...

Count:46
Name: BB+RSI+OBV
Description: I use Bolinger Band and RSI and OBV when Bolinger band midline cross and rsi is bigger than 50 and obv is going up i wrote this strategy to test this strategy

Count:46
Name: Bagheri IG Ether v2
Description: In this version, the winning ratio has been decreased, but the Risk to Reward Ratio (RRR) has been set to be better than the previous version. This is a technical trading strategy for Ethereum ( BINANCE:ETHUSDT ). We built and developed it on MetaEditor and optimized it with MetaTrader optimizer. The main indicators are Donchian Channel, Oscillator of ROC ,...

Count:46
Name: UVTrader Strateji
Description: If you see "AL" you can buy, If you see "SAT" you can sell. You can use all charts, but 4 H and 1 D charts are very well..

Count:46
Name: Parabolic SAR Strategy
Description: Really questioning how the trailing stop works in the backtesting framework of tradingview/pinescript, I am sure I would not get the same results with the same strategy in MT4.

Count:46
Name: CMOav Backtest
Description: This indicator plots average of three different length CMO's. This indicator was developed by Tushar Chande. A scientist, an inventor, and a respected trading system developer, Mr. Chande developed the CMO to capture what he calls "pure momentum". For more definitive information on the CMO and other indicators we recommend the book The New...

Count:46
Name: Portfolio Performance - 2 Assets
Description: Function: - Can be used to evaluate the performance of portfolios containing 2 assets over a set time interval - Created to evaluate of the performance of portfolios containing different weightings of stocks and bonds over time - Shows the % return of each portfolio over the time interval defined by the user - Capable of showing the risk adjusted % return of each...

Count:46
Name: CMOabs Backtest
Description: This indicator plots the absolute value of CMO. CMO was developed by Tushar Chande. A scientist, an inventor, and a respected trading system developer, Mr. Chande developed the CMO to capture what he calls "pure momentum". For more definitive information on the CMO and other indicators we recommend the book The New Technical Trader by...

Count:46
Name: NoScoobies Bollinger Bands
Description: Bollinger Bands strategy that I am trying out, however I can't get my strategy.close to work. Looking for help.

Count:46
Name: $ HL Engulfing/Hammer
Description: all my strategies have a 0.15 commision built in. this one works on btcusd on 5 min coinbase. maybe you guys can make it better

Count:46
Name: REVERSALS
Description: The systems basically play reversals, it enters when the close is lower than its low of 5 bars ago to enter It exits when the price is higher than the high of 5 days ago Uses a 200 MA as a market filter, does not trade when the price is below its 200 Moving average Uses a 5% stop, as per the red Stop Loss Line -- can be adjusted The amount of...

Count:46
Name: EMA SCALPEUR + RSi - SHORT
Description: this indicator is about 4 EMAs, you can choose a cross under 2 EMA's for the entry end 2 others EMAs for the exit. Plus I add a RSI function to be sure it doesn't take a short if RSI is under 40. It's still in development

Count:46
Name: StochRSI Strategy by jurev
Description: Simple strategy on Stochastic RSI, opens buy when K is undersold, and buys when K is overbought. You can experiment with SL and TP points to optimize profit.

Count:46
Name: Williams %R Cross Strategy with 200 MA Filter
Description: 1. The script is a trading strategy based on the Williams %R indicator and a 200-period moving average (MA) filter. 2. The user can input the length of the Williams %R indicator (`wrLength`), the threshold for %R crossing (`crossPips`), the take profit level in pips (`takeProfitPips`), and the stop loss level in pips (`stopLossPips`). 3. The script calculates...


Count:45
Name: EMA Strategy 13 48
Description: strategy croisement EMA 13 / 48 pour test, à ajouter des stop loss

Count:45
Name: Trend Reversal Alerts Strategy [lite]
Description: This strategy was created as experimental and after playing around with it, I was able to realize what is a good way to base your strategy on and what is not. This one is most primitive way and you should not expect gains from it(it's best on the weekly btw). Anyway, all my attempts to advance this strategy in the end gave me around 1%2% +Net Profit on the...

Count:45
Name: UP TREND AND DOWN TREND
Description: It's help you to find the market trend up or down side

Count:45
Name: 50H-50L-15C-EMA
Description: This consists of Moving Average 50H-50L-15C EMA crossover. Works well in Trending Environment.

Count:45
Name: PowerX by jwitt98
Description: This strategy attempts to replicate the PowerX strategy as described in the book by by Markus Heitkoetter Three indicators are used: RSI (7) - An RSI above 50 indicates and uptrend. An RSI below 50 indicates a downtrend. Slow Stochastics (14, 3, 3) - A %K above 50 indicates an uptrend. A %K below 50 indicates a downtrend. MACD (12, 26, 9) - A MACD above the...

Count:45
Name: Oscillating Market Case Study
Description: This is a little something I created to analyze the market. Ultimately, I wanted to create something that could encapsulate the entire market as best as possible. The idea was simple, use technical analysis to create cases that would indicate entry positions and exit positions for long positions initially. After completing that, I decided to add a few shorting...

Count:45
Name: EMA 5,15,35,89,200 BY NUT
Description: Plots exponential moving average on four timeframes at once for rapid indication of momentum shift as well as slower-moving confirmations. Displays EMA 5, 15, 35, 89 and 200... default colors are hotter for faster timeframes, cooler for slower ones ขอบคุณครับ

Count:45
Name: RSI multitimeframe SMA crossover
Description: Strategy based on the multi timeframe equally weighted RSI moving averages turned into single average and then cross of the 2 combined outputs, seems to be promising, default settings work good on 5m chart(better entry) but very filtered trade amount. If you want to use it on different timeframes be my guest and mess with adjustments, pretty much every aspect of...

Count:45
Name: DELAYED FIBO
Description: fibo delayed and real value wave design. Burada bandlar arası dalgalanmadan faydalanılmakta.

Count:45
Name: CMOaDisparity Index Backtest
Description: The related article is copyrighted materialfrom Stocks & Commodities Dec 2009 My strategy modification. You can change long to short in the Input Settings WARNING: - For purpose educate only - This script to change bars colors.


Count:45
Name: LAT Holy Grail v3
Description: The Holy Grail ADX and EMA20 crossovers. do not trade with this strategy. it is not ready yet.

Count:44
Name: Up/Down Short Strategy
Description: This is a consecutive bar up/down strategy for going short only where you can specify how many bars down to enter and how many bars up to exit. It also has code to check and make sure the condition is still true when launching the official alert, which helps back testing and live results line up, however be sure to enter commission and slippage into the properties...

Count:44
Name: Moving Average profit targets with var size
Description: Profit target: Profit targets are those scenarios where the system expects to be greater than the actual return at the end of the transaction: they may be short-term benefits, such as a favorable price shock model. In short-term transactions, profit objectives are essential. Price fluctuations make any favorable event likely to turn around in an instant. Moreover,...

Count:44
Name: Golden Swing Strategy - Souradeep Dey
Description: This strategy is developed by Mr. Souradeep Dey. Strategy is based on RSI, Stoch, BB & Supertrend. Coding by Rajkumar

Count:44
Name: Candle Patterns Strategy
Description: //I saw this code from DanyChe, i modify it to work on the latest version of pinescript //The script allows you to test popular candlestick patterns on various instruments and timeframes. In addition, you can configure risk management (if the value is zero, it means the function is disabled), and you can also specify the time of the trading session (for example,...

Count:44
Name: Auto Ichimoku
Description: A strategy where entries are calculated for you using the Ichimoku Cloud. The IC isn't plotted though, just a heads up.

Count:44
Name: TEMA_System_SAR
Description: This modified version earlier script with short and long

Count:44
Name: Bollinger Bands Trend Strategy
Description: This is a trading strategy for trend traders. Buy signals are generated when price closes above upper band. Sell signals are generated when price closes below lower band. Good luck.


Count:44
Name: Follow the Crypto Shorts
Description: This script allows to test the impact of variations in the number of BTCUSD Shorts Positions on its price. In particular, it compares the number of short positions with its moving average to decide if shorts are being liquidated. In case the number of short positions crosses below its moving average, it will generate a Long Position, which will be closed if shorts...

Count:44
Name: Booz Strategy
Description: Booz Backtesting : Booz Backtesting is a method for analyzing the performance of your current trading strategy . Booz Backtesting aims to help you generate results and evaluate risk and return without risking real capital. The Booz Backtesting is the Booz Super Swing Indicator equivalent but gives you the ability to backtest data on different charts. This is an...

Count:44
Name: Dieyson Swingtrade EMA 20+200 and bar & line color
Description: Dieyson Setup EMA 9 + EMA20 + EMA200 daytrade

Count:44
Name: 1St Bar GAP+BkOut Screener v2 by RM
Description: First Bar Gap and subsequent conditions are used as one of the several strategies for Day traders. This script runs on first bar and checks if the stocks has an initial Gap (up or down), then checks for next bars to be inside the boundaries of the first candle you can customize this screener according to your requirement. There are a number of very clever...

Count:43
Name: Mathias & Christer EMA
Description: So this Strategy is my first at when writing it's not 100% finnished. The strategy idé builds on EMA (9) being clearly over/under the EMA for some bars. If the EMA is over this will make a triggerline that when EMA (1) crosses this line it signals a buy/sell. I don't have a great TP or SL for this yet so as of now I'm only using oposit crossing of close for...

Count:43
Name: Derivative Based Strategy
Description: This strategy is based on utilizing the 1st, 2nd, 3rd, and 4th time derivatives of the HMA for investing equal percentages of some capital. Entry points are identified by trends in the 2nd, 3rd, and 4th derivatives while exit points are created at either a new entry point or a trailing stop loss %.

Count:43
Name: EMA Slope AyE
Description: We create our own indicator to calculate the slope of a 20 period EMA over the last candle.

Count:43
Name: Sundays Suck for Bitcoin - Daily Strategy
Description: Bitcoin tends to have bad Sundays, so this strategy just sells on Saturday, and buys back the next Wednesday if the price is kinda going up! (Its Jonnys first script, so is this really just published for people looking for simple code to learn from :-) (The strategy works best if you set your chart time period to 1 day.)

Count:43
Name: ninja strategy
Description: The ninja strategy is 3-minute scalping. It takes profits from very short term ups and downs.

Count:43
Name: I11L - Risk Adjusted Leveraging
Description: This trading system, called "I11L - Risk Adjusted Leveraging", is designed to manage trades based on the current market volatility relative to its historical average. The system calculates the target number of open trades based on the ATR (Average True Range) indicator and adjusts the leverage accordingly. The system opens and closes trades using a pyramiding...

Count:43
Name: DEMA/EMA & VOLATILITY (VAMS)
Description: The biggest issue with momentum following strategies is over signaling during whipsaw periods. I created this strategy that measure momentum with DEMA (Fast Moving) and EMA (Slow moving). In order to mitigate over signaling during whipsaw periods I implemented the average true range percentage (ATRP) to measure realized volatility. If momentum is picking up while...


Count:43
Name: SSL Backtester With ATR SL TP and Money Management
Description: Similar to other SSL Channel scripts, but this one allows you to set an ATR-derived stop loss and adds the option to risk a % of the equity or used a fixed lot. Enters upon a long or short SSL crossover. FIXED LOTS For 0.01 "lots" use 1000 For 1 standard lot, use 100,000 FOR MONEY MANAGEMENT For 1% risk, enter 0.01 For 10% risk, enter 0.1 etc You should be...

Count:43
Name: Indicator Integrator Strat <<<<<< Updated again, second
Description: 2nd patch Found an error in the orders. Script was making double orders at times. I fixed it. It is tuned as such: NZDUSD 15 min chart starting $USD to show 1000 contracts for minicontract with FXCM (start date 3-18 $633 ** see note) Indicator plots Starting equity-trade gain and loses-number of trades time spread = net money ** with 1:50 leverage it requires...

Count:43
Name: Trailing Stops Only - For Leveraged ETFs (UGAZ/DGAZ)
Description: Looking for Statistical trades that work. This one seems to work on some Leveraged ETFs with a lot of noise like UGAZ/DGAZ. It can also be used on Futures Contracts, but be sure to change up the type of investment from % of equity to contracts. Also one point I'm trying to make with this strategy is the trades are best made in the morning around market open. ...

Count:43
Name: ChBrkOutStrategySMA
Description: This script relies on channel breakout strategy and the exit condition is defined by the SMA crossover, this works well on futures and Indices

Count:43
Name: Aggressive Bandpass Trigger Strategy [jwammo12]
Description: This strategy enters a trade on an inflection point of the lead line of the adaptive bandpass trigger oscillator, so it is an aggressive entry. It closes the trade on the reverse signal and only trades long and when price is over a long term moving average.


Count:43
Name: Strategia RSI semplice
Description: Questo semplice script sfrutta il RSI a 14 periodi per comprare (solo long) quando RSI crocia al rialzo i 30 (oversold line) e chiude l'operazione quando RSI crocia al ribasso i 70 (overbought line). La strategia è stata progettata sul TimeFrame delle 4H (su BTC) e dimostra come una semplicissima strategia con un solo segnale poteva portare un 20% dal 2020 ad...

Count:43
Name: MACD Strategy custom for cryptos
Description: It is a MACD with strategy simulation implemented to "tune" the MACD parameters for cryptos, it only use long and close strategy, not short


Count:42
Name: [EKIN] ATR Exit Strategy
Description: My exit strategy to reduce risk via tracking price and ATR. Sets new STOP price based on how many ATR is current price above from the entry price. I only check 5 and 20 EMAs for entry strategy. I intentionally used a simple entry strategy to further test the impact of this exit strategy. First sets STOP at 1.5 ATR below the entry price. If there is a 2 ATR...

Count:42
Name: Buy On Open After Outside Bar
Description: This script will buy (on open) if there is an outside bar.

Count:42
Name: PCT Trailing Stoploss-Strategy
Description: I am not a financial advisor and this is not financial advice. This is provided for illustration only for a Percent based Trailing Stoploss. I have been looking for a Percent based Trailing Stoploss and have not been able to find one that would work for me so I wrote my own. This works in both a Strategies and Indicators I put comments inline of where to...

Count:42
Name: Intraday Stochiastic Strategy
Description: WORKS FOR BTCUSD M30 OBVERVED GOOD PERFORMANCES FOR SELL MODE M15 : US30USD / UK100GBP / JP225USD / SPX500USD / BCOUSD / EURGBP Best Forex Hours are 7-21 0 is Long Position 1 is Short Position 2 No position

Count:42
Name: BlackSwan strategy
Description: Wild fluctuation of price is detected automatically, you will be informed of the black swan immediately. Period: 1-3minutes

Count:42
Name: [Strategy] Simple Golden Cross
Description: Simple Golden Cross Strategy. Works best on a daily chart on "Blue Chip" cryptos such as BTC, ETH, and LTC. Entry Signal: -50 day moving average crosses over the 100 day moving average. Exit Signal: -50 day moving average crosses under the 100 day moving average. -Daily candle closes under the 100 day moving average (support). -100 day moving average crosses...

Count:42
Name: Vol ST VM
Description: This script works with super trend and volume. Based on super trend and MA signal we can go for buy/sell. Use min 1Hr time frame. We can use this mostly for 24Hr markets.

Count:42
Name: M8 BUY @ END OF DAY
Description: I've read a couple of times at a couple of different places that most of the move in the market happens after hours, meaning during non-standard trading hours. After-market and pre-market hours and have seen data presented showing that systems which bought just before end normal market hours and sold the next morning had really amazing resutls. But when...

Count:42
Name: Combo Backtest 123 Reversal & Breakout Range Long
Description: This is combo strategies for get a cumulative signal. First strategy This System was created from the Book "How I Tripled My Money In The Futures Market" by Ulf Jensen, Page 183. This is reverse type of strategies. The strategy buys at market, if close price is higher than the previous close during 2 days and the meaning of 9-days Stochastic Slow...

Count:41
Name: Misery index strategy
Description: Hi all, It's bear market so let's have a look at the misery index. Misery index = inflation(%) + unemployment (%) It's only possible to use this chart on the monthly (as misery index is updated monthly), but just for fun I added a strategy to it. If misery index increases you short and you go long when MI decreases. Enjoy p.s. the band is pretty cool too

Count:41
Name: Simply Stochastic Backtest
Description: This back testing strategy generates a long trade at the Open of the following bar when the %K line crosses up UpBand line. It generates a short trade at the Open of the following bar when the %K line crosses down DownBand line. You can change long to short in the Input Settings WARNING: - For purpose educate only - This script to change bars colors.


Count:41
Name: Chirag Strategy SMA with StopLoss
Description: The Moving Average Crossover trading strategy is possibly the most popular trading strategy in the world of trading. This strategy is a good example of so-called traditional strategies. Traditional strategies are always long or short. That means they are never out of the market. The concept of having a strategy that is always long or short may be scary,...

Count:41
Name: Coding lesson 2
Description: This script is necessary for training, but not for trade. It isn't recommended to trade using this strategy. The line 1 - SMA, 7 periods, W1-timeframe The line 2 - SMA, 7 periods chosen timeframe (use D1) If the price of closing of a candle is higher than both lines - to open a long position If the price of closing of a candle is lower than any of two lines -...

Count:41
Name: Dynamo Strategy Backtest
Description: In July 1996 Futures magazine, E. Marshall Wall introduces the Dynamic Momentum Oscillator (Dynamo). Please refer to this article for interpretation. The Dynamo oscillator is a normalizing function which adjusts the values of a standard oscillator for trendiness by taking the difference between the value of the oscillator and a moving average of the...

Count:41
Name: Combo Backtest 123 Reversal & Bandpass Filter
Description: This is combo strategies for get a cumulative signal. Result signal will return 1 if two strategies is long, -1 if all strategies is short and 0 if signals of strategies is not equal. First strategy This System was created from the Book "How I Tripled My Money In The Futures Market" by Ulf Jensen, Page 183. This is reverse type of strategies. The...

Count:41
Name: MACD BF
Description: This is a modified version of the MACD strategy in the public library. You can set the time period you want in the input parameters, along with the MACD and signal line values. The default values for this strategy are 12, 26, 12. These settings seem favorable to BTC/USD pairs. The strategy is simple - when the histogram crosses above zero, a buy signal is...

Count:41
Name: RSI Improved strategy
Description: Set a Horizontal Ray at the price that relates highest / lowest RSI . It 's more clear to decide when to open long / short position manually. It's a scalping strategy that works in 15min chart(basically works in most of timeframe , if you don't look it as a scalping strategy), when RSI hits Highest / Lowest value , the strategy will open a Long / Short...

Count:41
Name: Recursive Moving Trend Average
Description: Taken from an article "The Yen Recused" in the December 1998 issue of TASC, written by Dennis Meyers. He describes the Recursive MA in mathematical terms as "recursive polynomial fit, a technique that uses a small number of past values of the estimated price and today's price to predict tomorrows price." Red bars color - short position. Green is long. ...


Count:41
Name: Pivot Points H/L by Himansu
Description: Im not able to figure out why the strategy.exit only stays for one candle. I was trying to let the trade open till it hits Target or StopLoss. Will really appreciate some help here.

Count:41
Name: Trend Tracker
Description: Works best on the Daily Something Iv'e been playing around with for a while seems to work real well on High Beta Names

Count:41
Name: Easy Bands Custom Indicator
Description: Based on 21 Week SMA --- // Buy when the market is oversold - Sell when the Market is overbought // -- If you don't know what that means don't use this indicator. Good luck out there!

Count:40
Name: trading YM based on pair trading
Description: This is inspired by some online free webinars. Didn't pay for the strategy/ course. I just figured it out myself. So there might be problem with this strategy. Theory: It is based on something called cointegrated. Cointegration means the difference between 2 securities are stable in long term. When the difference is bigger / smaller than normal, then there is...

Count:40
Name: Open_Range_Strategy_with_dynamic_PT_by_frenchy
Description: Opening the code for the group

Count:40
Name: f.society v7
Description: testing in cryptocurrency. send me ideas for scalping strategies please probando en criptomonedas. envienme ideas para estrategias de escalping por favor

Count:40
Name: First Script, buy/sell on EMA
Description: Spent many hours working on a script to find out when the next earnings report is.. there should be a builtin feature but anyways, it's done now.. The strat is to buy and sell based on the EMA (Whatever that is) and to exit all entries if the Earnings report is within a week.


Count:40
Name: ma 20 high-low
Description: This is a simple 20-period high and low SMA strategy. We buy the stock when it closes above the 20 period SMA of high prices and sell when it closes below it. We sell when the price closes below 20 period SMA of low prices. This strategy works phenomenally well for a few stocks examples are bajaj finance and bajaj finserv. I want to see if it makes a good return...

Count:40
Name: CoinruleCombinedCryptoStrat
Description: Utilizes a combination of RSI and MA to determine the best time to acquire cryptocurrencies and then sell when the markets are reaching peak prices. Best followed on lower time frames. Based on a strategy of averaging down during dips then selling at peaks with the highest volume first, then slowly liquidating as the price increases in percentage of holdings.

Count:40
Name: Advancing Our Basic Strategy
Description: This script advances my previous post in which i created the most basic script i can think of for beginners like myself by adding more parameters and complex situations. I hope this can help anyone starting our with trading views strategy tester :)


Count:40
Name: Atrend by OTS
Description: Atrend is a indiactor used to identify long and short term trends it uses MACD, RSI, ATR, and a DEMA along with some pieces from supertrend, the indicator works good on 1-4 hour time frame

Count:40
Name: charl macd ema rsi
Description: Trade trend continuation and reversals using this script


Count:40
Name: Vortex with TSI strategy
Description: Strategy Terms Indicator: Vortex Indicator: True Strength Indicator As you will see, the indicators have red and blue lines. To buy an option for a price increase, you need to wait for the simultaneous intersection of the lines of both indicators when the blue lines are at the top and the red ones go down. And vice versa, to buy an option with a forecast of a...

Count:39
Name: Last Price minus Open Price Intraday Volume
Description: Last Price minus Open Price Intraday Volume Change in price from day Open price to Last Price indicate the stock price movement. Last Price minus Open Price Intraday Volume indicator is framed on volume change during change in price from day Open price to Last Price. It takes into account the average intraday volume based on intraday length of bars and...

Count:39
Name: Oversold RSI with Tight Stop-Loss Strategy (by Coinrule)
Description: KRAKEN:LINKUSD This is one of the best strategies that can be used to get familiar with technical indicators and start to include them in your rules on Coinrule . ENTRY 1. This trading system uses the RSI (Relative Strength Index) to anticipate good points to enter positions. RSI is a technical indicator frequently used in trading. It works by measuring...


Count:39
Name: BarUpDn Long Strategy
Description: This is a bar up/down strategy for going long only where you can specify how many bars up to buy and how many bars down to sell. It also has code to check and make sure the condition is still true when launching the official alert, which helps back testing and live results line up, however be sure to enter commission and slippage into the properties to accurately...

Count:39
Name: Aggregate BTC Volume + EMA Strat
Description: // This strategy buys when the price crosses the Fast EMA. It can go long only // when the price is above the slow EMA and short when is below. The exit // is determined by volume spikes, when the volume is greater than the Volume // MA multiplied by the assigned input multiplier. Thanks to MartinShkreli // for the Aggregated BTC volume. There is also a Maximum...

Count:39
Name: volume high standard deviation stystem
Description: On the basis of moving average, add moving average and standard deviation line of volume to filter the entry and exit time. Do not enter trades on high volume and price in trend direction. Exit on high volume and price in profitable direction. Option 0 = No entry or exit filter Option 1 = Entry filter only Option 2 = Exit filter only Option 3 = Both entry and exit filters

Count:39
Name: ARGO_BAND-STRATEGY
Description: A 4 hours breakout trading system inspired from the Channel Strategy

Count:39
Name: SPX 5 minute moving average crossover example
Description: SPX 5 minute moving average crossover example

Count:39
Name: Combo Backtest 123 Reversal & CMOav
Description: This is combo strategies for get a cumulative signal. First strategy This System was created from the Book "How I Tripled My Money In The Futures Market" by Ulf Jensen, Page 183. This is reverse type of strategies. The strategy buys at market, if close price is higher than the previous close during 2 days and the meaning of 9-days Stochastic Slow...

Count:39
Name: RELATIVE VALUE TRADE MANAGEMENT WEBHOOK
Description: This script it's created to send open-close signals via webhook. It allows you to open a relative value position based in the relative graph. You can set the TP and SL levels and the script will send the signal to your exchange. Due a pine limitations it is necessary apply the script in the 2 different actives and set the alerts. You can just do the relative...


Count:39
Name: Trading Day and Time Session
Description: This script provides options for the user to choose: - Start date and End date - Trade time during a day (With UTC offset) - Which days of the week to trade It return a condition if all the date and time conditions are true. It's very easy to integrate with any script.

Count:38
Name: Three Outside Down Backtest
Description: This is a three candlestick bearish reversal pattern consisting of a bearish engulfing pattern formed by the first two candlesticks then followed by a down candlestick with a lower close than the prior candlestick. WARNING: - For purpose educate only - This script to change bars colors.

Count:38
Name: PPO Strategy
Description: PPO strategy, similar to MACD but with percentage Buy when PPO cross over a threshold, ex 0.4 Sell when cross under ... You may use it in 2h time frame or more ... to get strong signal

Count:38
Name: basic fixed fraction strategy
Description: One of the most common trading strategy is to invest a certain percentage in an asset, and keep the percentage fixed. For example you invest 2% in a stock, and as the value goes up you sell. And as the value goes down you buy. Always trying to keep the value of how much you have invested in that asset at 2%. This works very well with assets that are stable. If...

Count:38
Name: EMA Fan
Description: A bot that gradually buys or sells into the market depending on how much the EMAs fan out.

Count:38
Name: Three Inside Up Backtest
Description: This is a three candlestick bullish reversal pattern consisting of a bullish harami pattern formed by the first 2 candlesticks then followed by up candlestick with a higher close than the prior candlestick. WARNING: - For purpose educate only - This script to change bars colors.

Count:37
Name: DaysAfterCertainPercentChangev1
Description: This script will show you certain days that either had a gain or drop of a certain percent and highlight that day and 4 days after. The strategy is to long/short on the next day and then close the position x number of days later. Input: - Long or Short - Down Day or Up Day - Percent of Change day changed (up or down from previous input) - Number of days until you...

Count:37
Name: stoch supertrd atr 200ma
Description: This strategy combines Supertrend, 200 EMA, Stochastic, and an ATR stop loss indicator. For buy conditions, the Stochastic has to be below the 20 level, price has to be above the 200 Ema and the Supertrend has to be green. For sell conditions, it has to be the opposite. the Stochastic has to be above the 80 level, price has to be below the 200 Ema and the...

Count:37
Name: 200DMA last DOM - ajh
Description: Implements and backtests a simple 200 day moving average trend following rules based on last day of month to limits trades to 12 per year. From the book : 5 BEST Moving Average Strategies (That beat buy and hold) by Steve Burns and Holly Burns Click on the cog to set the input date range eg; 2000-01-01 to 2016-12-31 The book back tested SP500 returns from...

Count:37
Name: [STRATEGY]EMA 30/60 Cross Strategy
Description: strategy based on EMA 30/60 cross works best on 4hr timeframes & high-midcaps


Count:37
Name: Repaint is still available in strategy version 3...
Description: See results of trades, then comment out 2nd line and comment in 3rd line, and see results again... ¯\_(ツ)_/¯ (DO NOT USE THIS STRATEGY)

Count:37
Name: Bollinger Band with Date Range Options
Description: Bollinger Band with Date Range Options


Count:37
Name: ETF trader
Description: simple breakout system that uses an ATR based SL and an ATR based trailing SL

Count:37
Name: moonshot hypertrender (supertrend strategy)
Description: This is a well-known strategy by using 3 different Supertrends and a trend-defining EMA, feel free to play around with the settings, a backtest on 8h ETHUSDT pair brought some good results using the 233EMA and investing 75% of a 10k start capital. The idea is to have at least 2 Supertrends going green above the trend-EMA to go into a long position. The...

Count:37
Name: BNB Burn Buyer
Description: This strategy is only meant to be used on BNB. It's more of an inconclusive analysis of the effect of BNB's quarterly coin burn. To date there have been 13 coin burns. According to Binance's whitepaper, each quarter, they will burn BNB based on their trading volume until 50% of all BNB is burned. They eventually will destroy 100MM BNB, leaving 100MM BNB...

Count:37
Name: ECO Strategy Backtest
Description: We call this one the ECO for short, but it will be listed on the indicator list at W. Blau’s Ergodic Candlestick Oscillator. The ECO is a momentum indicator. It is based on candlestick bars, and takes into account the size and direction of the candlestick "body". We have found it to be a very good momentum indicator, and especially smooth, because it is...

Count:37
Name: HK Percentile Interpolation One
Description: This script is designed to execute a trading strategy based on Heikin Ashi candlesticks, moving averages, and percentile levels. Please note that you should keep your original chart in normal candlestick mode and not switch it to Heikin Ashi mode. The script itself calculates Heikin Ashi values from regular candlesticks. If your chart is already in Heikin Ashi...

Count:37
Name: Grid HW
Description: Buys 10 layers from a fixed price, there is 1% between each layer. Sells after 1% profit on each layer.

Count:37
Name: Extended Price Volume Trend Strategy : Educational
Description: The Extended Price Volume Trend (EPVT) is a technical indicator that is used to identify potential trend changes and measure the strength of a trend. In this strategy, we combine the EPVT with other indicators to create a trading system that aims to capture trend reversals and momentum shifts. The EPVT indicator is calculated by taking the cumulative volume and...

Count:37
Name: Richard's Strategy
Description: Strategy/Indicator based on Richard Dennis turtle trading technique

Count:37
Name: Perfect Order
Description: Entry Point How to Entry Perfect Order Entry SMA5,13,21 & EMA75,90,200 Please enjoy your entry

Count:37
Name: GBPJPY MACD 1min Long Only
Description: This MACD indicator uses two lines for long and sell long. It also uses a MACD indicator line with a historian. When the MACD historian crosses over the buy line, a long signal is executed. When the MACD historian crosses over the sell line, a close entry is signal is executed. There is a also a built in stop loss and you can adjust the buy and sell lines...

Count:36
Name: D_DSP (Detrended Synthetic Price) Strategy Backtest
Description: Detrended Synthetic Price is a function that is in phase with the dominant cycle of real price data. This DSP is computed by subtracting a half-cycle exponential moving average (EMA) from the quarter cycle exponential moving average. See "MESA and Trading Market Cycles" by John Ehlers pages 64 - 70.

Count:36
Name: DEMA of DPD Strategy
Description: DPD response quickly and one of my followers wanted a smoothed version of DPD. I think taking DEMA of DPD is a good solution for that.

Count:36
Name: Gotobi Teriyaki
Description: USDJPY Anomaly. This anomaly originated in Japan. Buy from 2:00 pm Japan time. Sell at 9:55 Japan time. Japanese importers often settle payments to suppliers in dollars, and exchange yen for dollars on settlement days (days falling on a 5 or 10, so-called goto days). Therefore, on goto days, there is sometimes a shortage of dollars held by financial...

Count:36
Name: Buurmans Tutorial
Description: A little Script as part of a Tutorial using Monday as entries and Friday as exits/shorts, with option to Long-Only and a rudimentary Stoploss. outlined in detail here can't find a better fitting Category, so bear with me

Count:36
Name: EMA Cross by MarketAlpha
Description: Signals are generated when EMA(FastLength) and EMA(SlowLength) cross each other. Below are the additional user parameters: 1. User defined backtesting period 2. User defined Target and StopLoss percentage points

Count:36
Name: Jigga - Heatmap Comparision
Description: Hi All, I always have a question on how to know which sector is performing. I have created this Heatmap comparison to know strength of sector. I have used RSI and MACD calculation and put it across 5 different index. Color shows bullishness and Gray shows weakness. You can select RSI or MACD or Both to have calculation. And you can also compare stocks if you...

Count:36
Name: CMF Velocity with 200EMA Strategy
Description: This is a demonstration of my new Indicator - CMF Velocity - in a profitable trading strategy. It is able to take shorts when the close is less than the 200 EMA, and longs when the close is greater than the 200 EMA.

Count:36
Name: EMA Cross Strategy
Description: I write this script for my self to test EMA cross strategy for crypto futures trading.


Count:36
Name: XBT Weekend Trade Strategy
Description: Using Friday's GXBT close price do the following: - Go short when price rises above 4.5% - Go long when price falls below 4.5% - Close all orders when profits reach threshold (default 3%) - Close all orders start of Monday Default leverage is 1x

Count:36
Name: Custom 15m strat
Description: This strategy is using multiple powerful indicators to generate low-timeframe signals. The script is best used on the 15 min timeframe but with correct parameters it can be rather sucesfull on higher timeframes too.

Count:36
Name: DAPD - Strategy Backtest
Description: This indicator is similar to Bollinger Bands. It based on DAPD - Daily Average Price Delta. DAPD is based upon a summation for each of the highs (hod) for the 21 days prior to today minus the summation for each of the lows (lod) for the last 21 days prior to today. The result of this calculation would then be divided by 21. It will be buy when high above...

Count:36
Name: Warm_Up
Description: Warm_Up I havent coded any scripts in some time, need to get back into the swing of things

Count:36
Name: Strategy - Trend Chaser - PSe
Description: Trend Chaser for Philippine Stock Exchange - LONG ONLY -Elvin Kennedy Latayan 2022


Count:36
Name: buy down and sell high trend 200 sma and ma cross
Description: this indicator showing you when have to buy down and sell high and also can see the market trend is being above or below I'm sorry if there is an error

Count:35
Name: Dark Cloud Backtest
Description: This is a bearish reversal pattern formed by two candlesticks within a uptrend. Consists of an up candlestick followed by a down candlestick which opens lower than the prior candlestick and closes below the midrange of the prior candlestick. It is the reverse of the Piercing Line. WARNING: - For purpose educate only - This script to change...


Count:35
Name: Oscillating SSL Channel Strategy - 3m & 5m Time Frames
Description: This script is pretty self-explanatory. I will suggest trying some different exits to get that win rate above 20% (I'd start with Take Profit and Stop Loss percentages). Enjoy!


Count:35
Name: GENESIS
Description: Hola, espero les sirva, por favor dejen sus comentarios de sus resultados, saludos

Count:35
Name: Santanu Strategy
Description: This script use for crypto market, its use ema and supertrend to find the current trend in the market

Count:35
Name: 2nd Grade Strategy
Description: This is a strategy to complement the 2GT indicator. It utilises the same rules as 2GT. This is comprises of multiple popularly used indicators to help decide on whether to go long or short. This indicator will overlay the MA lines and background colours on your chart. The heikin-ashi colour will be shown as the background colour. This will help you identify a...

Count:35
Name: 8 On 34 ema's
Description: Hi guy's this simple dude send nice message consider short/long when 8Ema Cross 34 Ema - If you learn this sutep and clear the false alarms (thats why it's - "consider") you can ride some waves Enjoy


Count:35
Name: Three Inside Down Backtest
Description: This is a three candlestick bearish reversal pattern consisting of a bearish harami pattern formed by the first 2 candlesticks then followed by down candlestick with a lower close than the prior candlestick. WARNING: - For purpose educate only - This script to change bars colors.

Count:35
Name: Combining Exponential And Volume Weighting Backtest
Description: The related article is copyrighted material from Stocks & Commodities 2009 Oct You can change long to short in the Input Settings WARNING: - For purpose educate only - This script to change bars colors.

Count:35
Name: Combo Backtest 123 Reversal & (H-L)/C Histogram
Description: This is combo strategies for get a cumulative signal. Result signal will return 1 if two strategies is long, -1 if all strategies is short and 0 if signals of strategies is not equal. First strategy This System was created from the Book "How I Tripled My Money In The Futures Market" by Ulf Jensen, Page 183. This is reverse type of strategies. The...

Count:35
Name: Gage Updated Strategy 2019
Description: Based on Divergence and hidden divergences, most useful when using the Money Flow Index to spot the reversal and locate the bottom of the market.

Count:35
Name: Trading The Loonie (CADUSD)
Description: A port of the trading strategy described at technical.traders.com "In “Trading The Loonie,” which appeared in the December 2015 issue of STOCKS & COMMODITIES, author Markos Katsanos explains the heavy correlation between the Canadian dollar and crude oil. He then goes on to describe how one could trade this correlation. Using similar logic as that employed in...

Count:35
Name: HULLMiguel 2019/ Strategy v3
Description: This script make BUY and SELL orders accordingly with the direction of EMA. (positive BUY and Negative SELL). It can help on a Daily or 4h chart. Check the Strategy Tester and adapt the Time Frame and the EMA to a especific Coin. If you have any ideas to create a new strategy or improve the hesisting one, please contact me.

Count:35
Name: Linear On MACD
Description: Unlocking the Magic of Linear Regression in TradingView In the ever-evolving world of financial markets, traders and investors seek effective tools to gauge price movements, make informed decisions, and achieve their financial goals. One such tool that has proven its worth over time is linear regression, a mathematical concept that has found its way into...

Count:34
Name: Combo Backtest 123 Reversal & D_DSP (Detrended Synthetic Price)
Description: This is combo strategies for get a cumulative signal. First strategy This System was created from the Book "How I Tripled My Money In The Futures Market" by Ulf Jensen, Page 183. This is reverse type of strategies. The strategy buys at market, if close price is higher than the previous close during 2 days and the meaning of 9-days Stochastic Slow...

Count:34
Name: Perfomance index Backtest
Description: The Performance indicator or a more familiar term, KPI (key performance indicator), is an industry term that measures the performance. Generally used by organizations, they determine whether the company is successful or not, and the degree of success. It is used on a business’ different levels, to quantify the progress or regress of a department, of an...

Count:34
Name: ROCKET_EWO
Description: Simple flag system strategy based on EMA cross overs, and standard deviation. Converted from pine script v3

Count:34
Name: 3SmmaCrossUp + Fractal + RSI
Description: This script is a combination of 3 smoothed moving averages, and RSI. When moving averages are aligned upward (downward) and RSI is above (below) 50 and a down (up) William fractal appears, it enters long (short) position. Exiting from long and short entries are defined by StopLoss and TargetProfit.

Count:34
Name: MA cross strategy
Description: I created an sma (10/30) strategy. The script is under construction and can be changed, since i'm looking for a more profitable strategy. If you have ideas to make it more profitable, please comment. It is possible to change everything to your own needs.

Count:34
Name: BTC Good Signal
Description: This strategy uses the intersection between the triple exponential moving average and the least square moving average. We also control for the profit that you will gain during the upward trend by implementing the trailing stop based on the ATR indicator. This is the strategy for the spot market only and can be primarily used for long-term investors.

Count:34
Name: Linear Regression MA - Strategy
Description: using the linear regression and linear regression MA to enter long and short positions.

Count:34
Name: Initial template
Description: I have created a starting template for strategies. It allows quick control of turning on/off long and short conditions, or disabling them entirely. It includes trade filters for strategy equity and volatility. If there is not enough volatility it will not trade, or if the strategy equity is below the equity ema it will not trade. It has standard stops and...

Count:34
Name: Pinku Buy
Description: Indicator is for buying options buying. Only created for option buying not for selling.

Count:34
Name: Mou Value Areas
Description: Use in CORRELATION with KEY AREAS - its only CONFIRMATION tool May ONLY BUY when its GREEN and ONLY SELL when RED Helps prevent buying the top and selling the bottom. Good for showing pullbacks during strong trends.

Count:34
Name: On Balance Volume w MA Strat
Description: I couldn't find an OBV MA strategy, so I modified one into what i wanted. Now for all to enjoy.

Count:34
Name: Coinbase to Binance premium indicator/strategy
Description: 1) Offers bar/ma chart of premium 2) Offers different trading strats based on premium(ma cross, premium value cross, smoothed premium value cross) supersmoother code credited to someone else from tradingview

Count:34
Name: Consecutive Up/Down Strategy with Reverse and SL
Description: Extension of the built-in strategy by TradingView. The strategy buys after an X amount of consecutive bullish bars and viceversa for selling. This logic can be reversed and a Stop Loss with Take Profit can be added. There's also an option to adapt the SL into a Trailing Stop.

Count:34
Name: Bozz Strategy
Description: Booz Backtesting : Booz Backtesting is a method for analyzing the performance of your current trading strategy . Booz Backtesting aims to help you generate results and evaluate risk and return without risking real capital. The Booz Backtesting is the Booz Super Swing Indicator equivalent but gives you the ability to backtest data on different charts. This is an...

Count:34
Name: 10PreBuyer
Description: Quite a simple system Uses a moving average, the blue line to try and get filled at favorable prices The MA is multiplied by a number (e.g. .90) which means the system tries to get filled at a 10% lower price (on the Blue MA line) This means that stop limit buy orders have to be set in advance on the blue line and hope that they would get filled when...

Count:34
Name: Trend following with HA
Description: This is my first script and it is basically a MA crossover/under strategy that uses heikin ashi closing prices. I've also used limit orders based on HA opening prices of the previous day for entry which improves the performance. However, this impose a restriction when prices are moving too fast and the algo is unable to enter the trade, resulting in a bad position...


Count:34
Name: Ahsan Tufail Precise MA Crossover Filter for Reliable Signals
Description: Introduction: In the ever-evolving world of Forex trading, strategies that provide a competitive edge are highly sought after. The Moving Average (MA) crossover technique is a popular long-term approach, but its vulnerability to false signals can lead to potential losses. To overcome this challenge, we introduce a game-changing MA crossover filter designed to...

Count:34
Name: Educational Strategy : TRIPLE DRAG-ON SYSTEM V.1
Description: The Triple Dragon System is a technical trading strategy that uses a combination of three different indicators to identify potential buy and sell signals in the market. The three indicators used in this strategy are the Extended Price Volume Trend (EPVT), the Donchian Channels, and the Parabolic SAR. Each of these indicators provides different types of information...

Count:33
Name: Combo Backtest 123 Reversal & Breakout Range Short
Description: This is combo strategies for get a cumulative signal. First strategy This System was created from the Book "How I Tripled My Money In The Futures Market" by Ulf Jensen, Page 183. This is reverse type of strategies. The strategy buys at market, if close price is higher than the previous close during 2 days and the meaning of 9-days Stochastic Slow...

Count:33
Name: FAVEL corp. Indicator Strategy
Description: Индикатор - помощник наблюдения за рынком

Count:33
Name: Up/Down Long Strategy
Description: This is a consecutive bar up/down strategy for going long only where you can specify how many bars up to buy and how many bars down to sell. It also has code to check and make sure the condition is still true when launching the official alert, which helps back testing and live results line up, however be sure to enter commission and slippage into the properties to...


Count:33
Name: Moriceau_Crypto_strategies_Long_short_indicator_Thesis
Description: After 3 years of analysis and trading I decided to publish a modify version of my indicator of my thesis. It not a recommandation of trade or an advice it is just for training The Goal Of this indicator is to avoid sell panic and Maximise drawdown and Money management I used mainly KRAKEN:BCHEUR but you can use it at you own risk on equity or other Crypto...

Count:33
Name: Cryptopians - MA Trading Strategy
Description: Simple moving average trading strategy. Based on: 10 MA 20 MA Daily timeframe

Count:33
Name: Correlation Strategy
Description: This is a basic strategy that shows how to trigger short/long/close signals on chart's symbol based on calculations made on another symbol which we consider correlated to it. With default parameters, ETH/USDT as base symbol, the strategy shows good results in backtest for several symbols : DENT/USDT, BTT/USDT, FTT/USDT, DOT/USDT etc. This is not surprising giving...

Count:33
Name: ASH1Strategy
Description: Positional Hourly trading system, to be used in conjunction with the default Choppiness indicator. Filter: Choppiness <= 44 for entry

Count:33
Name: EMA Strategy v_1 by.JanS.
Description: This Strategy use in 1 hour and daily graph. Long Strategy; The strategy is if the EMA_5 cross over EMA_10 in 1 hour chart, it is long opportunity. Now check the price on daily chart. If the EMA_5 cross over EMA_10 in daily chart, long more!!. Short Strategy; If the EMA_5 cross under EMA_10 in 1 hour chart, it is a short opportunity. Now check the...

Count:33
Name: Crunchster's Normalised Trend Strategy
Description: This is a unique rules-based, systematic trading strategy - in the trend following category. The strategy is designed for use on the daily timeframe. Specific features of this strategy are outlined below: 1. Uses a transformed price series (which I dub "real price") to generate signals rather than ticker price 2. Uses advanced position sizing and risk...


Count:32
Name: Double HULL Moving Average Strategy
Description: // Credit Indicator from KIVANC // author and idea: KIVANC @fr3762 on twitter // creator: Alan HULL // Strategy edited by teejk1986

Count:32
Name: Supertrend V1.0 - Buy or Sell Signal
Description: Testing a concept to get a TP and SL based on the ATR at the time of the position entry.


Count:32
Name: infy strategy for mukesh
Description: vwap, rsi and linear regression used in the setup to generate signal

Count:32
Name: tvbot Trend Following with Mean Reversion algo
Description: Default settings are for the ETHUSDT 5 min Binance Chart regular candles. Back test Default settings are 10,000 usd to start, Commission 0.075%, capital deployment per position is 10%, slippage value of 1. This algo uses the EMA to set the trend line . You are also able to turn the trend line into a range instead of just a static line. The algo uses the VWMA to...

Count:32
Name: Mathias & Christer Timeframe RSI
Description: This strategy is based on High and low RSI. If RSI is => 80 and RSI drops enter Sell position If RSI is =< 20 anr RSI goes up enter Buy position. as exit I use MA crosses MA short (30) MA Long (50)


Count:32
Name: Buy Monday, Exit Wednesday
Description: Strategy to go long at end of Monday before market closes and exit before Wednesday close, or at stop loss or take profit percentages This runs strategy on entering by weekday name and also by session time. Implemented are also Take Profit and Stop Loss to exit position using custom inputs. Added stop loss and take profit plot lines

Count:32
Name: TurtleBC Strategy review by V.Troussel
Description: Short added to the previous script by TurtleBC

Count:31
Name: sa-strategy with HTF-TSL
Description: Entry- based on HA close above HMA confirmation done with ST and HTF ATR Exit- based on close below ATR which works as trailing SL


Count:31
Name: Trend Confirmation Strategy
Description: The profitability and uniqueness of a trading strategy depend on various factors including market conditions, risk management, and the strategy's ability to capitalize on price movements. I'll describe the strategy provided and highlight its potential benefits and differences compared to other strategies: Strategy Overview: The provided strategy combines three...


Count:31
Name: Hour breakout model
Description: Hi guys, this is my first script and i need help to upgrade it I'm sure this work better if: 1) the breakout line green and red are the max and min of the "time window" between 03 00 and 07 00 (and not only 03 00 like now) 2) put stoploss on the redline for long, and on greenline for short Thx for any help

Count:31
Name: Indicator Integrator Strat <<<<<< UPDATED with Correction
Description: Found an error in the orders. Script was making double orders at times. I fixed it. It is tuned as such: NZDUSD 15 min chart starting $USD to show 1000 contracts for minicontract with FXCM (start date 3-18 $633 with 1:50 leverage) Indicator plots ==> Starting equity - (trade gain and loses) - (number of trades) * (spread) = true balance estimate

Count:31
Name: Laughing Owl
Description: Let the owl make you a fortune and keep you out of harm's way. Laugh your way all the way to the bank..

Count:31
Name: 4-Hour Stochastic EMA Trend
Description: This trading strategy relies heavily on catching the trend. You may have success using this strategy on as low as the one hour chart or as high as the daily chart; however, I’ve had most success trading it on the four hour chart. This strategy consists of four indicators, which are: 1. 5 Period Exponential Moving Average (closed) 2. 15 Period Exponential Moving...

Count:31
Name: Simple Heiken Ashi Stop and Reverse Trading on Futures
Description: This is the initial version of the Heikein Ashi Strategy. It calculates the Heiken Ashi values for the candlestick charts displayed on the screen and generates alerts/trades based on the actual value in the candlestick chart.

Count:31
Name: Donchian Strategy
Description: Added TSL in Green and Red Buy/Sell above Midline(Black)

Count:30
Name: Hoffman Heiken Bias
Description: This indicator uses a couple of different things including the Hoffman moving averages applied with heiken ashi bar data and some volatility to help determine when the bias of the market has shifted for the timeframe you are looking at.

Count:30
Name: Adaptive SMI Ergodic Strategy
Description: The Adaptive SMI Ergodic Strategy aims to capture the momentum and direction of a financial asset by leveraging the Stochastic Momentum Index Indicator (SMI) in an ergodic form. The strategy uses two lengths for the SMI, a shorter and a longer one, and an Exponential Moving Average (EMA) to serve as the signal line. Additionally, the strategy incorporates...

Count:30
Name: [2022] MACD Cross Strategy (version 1)
Description: Early workings of a macd crossover. User inputs, strategy parameters, use on forex, crypto, stocks, etc,..

Count:30
Name: Break even stop loss (% of instrument price)
Description: Simply proof of concept to place a stop loss a percentage below entry price and move it to break even if the price moves the same percentage above the entre price.

Count:30
Name: Default Strategy Template
Description: © CN_FX-999 Coded By Christian Nataliano First Coded In 14/06/2023 Last Edited In 22/06/2023 This Is A Default Strategy Template That Can Make Your Strategy Scripts More Organized With The Benefit Of Having The Same Layouts & Not Needing To Copy Over The Common Codes Such As Displaying Backtest Results, Opening & Closing Trades, Pine Connector Capabilities And A...

Count:30
Name: T3 crossover strategy
Description: Hi everybody, Hereby a simple strategy based on T3 moving average crossover. If people are interested we can also add some alerts in people are interested.

Count:30
Name: BB KANNEMAN
Description: Estrategia basada en las bandas de bollinger para ganer muchos SUYAI

Count:30
Name: bhramaji EMA Cross Strategy
Description: bhramaji EMA Cross Strategy bhramaji EMA Cross Strategy bhramaji EMA Cross Strategy bhramaji EMA Cross Strategy bhramaji EMA Cross Strategy

Count:30
Name: When was the last time we were in stagflation?
Description: Here I coded a strategy that indicates when we should enter a long position in the US dollar. The three indicators I used were the Inflation Rate, 10Y interest rate, and GDP growth rate. Right now in our economy, It seems as though we are in stagflation due to high inflation and declining GDP growth. Thoughts on how our government should handle the oversupply of...

Count:30
Name: ChannelBreakOutStrategyV2.1
Description: This is the basic strategy that uses the price breakout of BollingerBands.

Count:30
Name: Selected Dates Filter by @zeusbottrading
Description: We are presenting you feature for strategies in Pine Script. This function/pine script is about NOT opening trades on selected days. Real usage is for bank holidays or volatile days (PPI, CPI, Interest Rates etc.) in United States and United Kingdom from 2020 to 2030 (10 years of dates of bank holidays in mentioned countries above). Strategy is simple - SMA...


Count:30
Name: Adding some essential components to a prebuilt RSI strategy v4
Description: Taken from and just updated to compile in version 4. Added notes for users on where to swap out RSI component with their setup components to signal a long or short position.

Count:30
Name: lokendra Revert-Strategy
Description: this reversal strategy is to be used with hull moving average (9,18) with each intersection shows the the buy-sell point which will give more accuracy when my reversal strategy give candle turning point towards the change of trend indication by showing buy sell point

Count:30
Name: Same high/low
Description: If you are using support/resistance level-based strategies in your trading then this indicator can help you. I think that the retest level strategy is the best for beginners due to its simplicity of risk/reward calculations and higher abundance on the market. There is a well-known method to recognize a big player (buyer/seller) by candlestick pattern where the...


Count:30
Name: Pivots strategy XN
Description: Directional Strategy with pivot, ma , super trend A convenient script for using CPR with R1S1 strategy with this indicator. It works on Daily, 60m and 15m timeframes. For all other timeframes it will display an error message. The CPR values are calculated based on the following logic: For 1D timeframe, pivot and R1 and S1 calculations are based on previous month...

Count:29
Name: SMIO strat
Description: SMIO strat with longer input which rounds off the trends. The strat is based on when SMIO hits over 0 it sends a buy signal and when it goes under it sends a short signal. The SMIO input was changed from 20, 5, 5 to 35, 15, 15.


Count:29
Name: ------ This is it UPDATED
Description: // IB/ strategy(title='------ This is it UPDATED', shorttitle='----This is it UPDATED', overlay=true, pyramiding=1, initial_capital=1000, currency=currency.USD) //IB-----------------------------// len = 33 src = input(close, title="IB") out = sma(src, len) last8h = highest(close, 12) lastl8 = lowest(close, 12) bearish = cross(close,out) == 1 and falling(close,...

Count:29
Name: Dr Kumalo 16v Strategy
Description: //@version=3 strategy(title = "MACD of RSI", overlay = false) //////////////////////// RSI /////////////////////////// src = close, len = input(14, minval=1, title="Length") up = sma(max(change(src), 0), len) down = sma(-min(change(src), 0), len) rsi = down == 0 ? 100 : up == 0 ? 0 : 100 - (100 / (1 + up / down)) //////////////////////// RSI ...


Count:29
Name: DPD+RSI+BB
Description: Combination of DPD ,STOCHRSI and RSI indicators. Be careful for percantage selection to fit your candle size.

Count:29
Name: DEMA PRICE DİFFERENCE Strategy
Description: Strategy based on DPD indicator , price crossover the lower line , it means BUY signal. Price crossunder the upper line,it means SELL signal. For @dpanday


Count:28
Name: BB Strategy tooba
Description: bollinger bands strategy with added upper basis and lower line on the chart. when we use BB strategy in trading view unfortunately the upper, lower and basis line did not display. so we solve the problem with just a little script codes and bring back the lines to the chart

Count:28
Name: ET TurnaroundMonday
Description: ET TurnaroundMonday - two red bars, on Monday go long and exit when close > yeasterday High

Count:28
Name: Triple EMA Cross JS
Description: Strategy that indicates potential buy and sell signals.

Count:28
Name: Binomial Moving Average Strategy
Description: Binomial Moving Average: This type of moving average that is made by myself and i did not see anywhere before uses the half of binomial coefficients for averaging the prices for example if the period be 5 then we use the 9 degree binomial coefficients(that yields 10 coefficients) and use half of them. we use 126/256 for last bar,84/256,36/256,9/256 and finally use...

Count:28
Name: D-BoT Alpha 'Short' SMA and RSI Strategy
Description: Dostlar selamlar, İşte son derece basit ama etkili ve hızlı, HTF de çok iyi sonuçlar veren bir strateji daha, hepinize bol kazançlar dilerim ... Nedir, Nasıl Çalışır: Strateji, iki ana girdiye dayanır: SMA ve RSI. SMA hesaplama aralığı 200 olarak, RSI ise 14 olarak ayarlanmıştır. Bu değerler, kullanıcı tercihlerine veya geriye dönük test sonuçlarına göre...


Count:28
Name: P-Signal Strategy (BTCUSD Multi Frame)
Description: This is an example of constructing P-Signal strategy on a set of probability spaces. In this case, the daily weekly and monthly time frames are used. Please note that the parameters for each of the spaces (the number of bars in the gear) are different.

Count:28
Name: RSI-2, Larry Connars without adjustment
Description: >200MA only LONG RSI2: <10 LONG 平倉at SMA5

Count:28
Name: Buy Only Strategy with Dynamic Re-Entry and Exit
Description: The strategy aims to create a simple buy-only trading system based on moving average crossovers and the Weekly Commodity Channel Index (CCI) or Weekly Average Directional Index (ADX). It generates buy signals when the fast-moving average crosses above the slow-moving average and when the Weekly CCI and or Weekly ADX meet the specified conditions. The strategy...

Count:28
Name: Prime Number Oscillator Backtest
Description: Determining market trends has become a science even though a high number or people still believe it’s a gambling game. Mathematicians, technicians, brokers and investors have worked together in developing quite several indicators to help them better understand and forecast market movements. Developed by Modulus Financial Engineering Inc., the prime number...

Count:28
Name: Improved EMA & CDC Trailing Stop Strategy
Description: Improved EMA & CDC Trailing Stop Strategy Objective: This strategy seeks to exploit potential trend reversals or continuations using Exponential Moving Averages (EMAs) and a trailing stop based on the Chande Dynamic Convergence Divergence (CDC) ATR method. Components: Exponential Moving Averages (EMAs): 60-period EMA (Blue Line): Faster-moving average that...

Count:28
Name: DEMA/EMA & VOL (Short strategy)
Description: Hello, I am trying to build a short momentum strategy that is based off of the DEMA crossing under the EMA, but because many momentum strategies send too many signals, I have also implemented a volatility condition based on the average true range percentage (ATRP). Essentially, as momentum moves downwards + volatility (ATRP) moves upwards, it shorts the security....

Count:28
Name: Dual Timeframe SMA Ribbon Crossover Backtest
Description: // Backtesting Dual SMA Ribbon Crossover Strategy // see f.bpcdn.co // including time limiting Turned this study into a backtest.


Count:27
Name: MavCrossover v2
Description: Simple moving average crossover strategy with SMA and EMA, a time window and the possibility to set the 2nd MA as a factor of the 1st one (to quick cycle through them)

Count:27
Name: Moving Average Color Strategy
Description: Hello, Strategy based on scrips "Moving Average Color Direction Detection" from Dreadblitz published on Aug 9, 2019. You can chose MA type, length and reaction setting to adjust to time frame/ticker. Always seemed like RSI is ahead of actual price action and just messing around with MA on the RSI . Couple I found: SPXS / SPXL 20M timeframe, MA 32 Reaction 2...

Count:27
Name: TRAX Detrended Price Strategy
Description: In this script, the "TRAX" (TRIX) indicator is calculated using the Volume Weighted Moving Average (VWMA) instead of Exponential Moving Average (EMA) like the standard TRIX. The Detrended Price is used to identify short term cycles with a rate of change verses the rate of change from a triple smoothed TRAX VWMA . The strategy is intended for counter-trend trading,...

Count:27
Name: Trading Pub Script
Description: Crazy curve fitting, but I'm just trying to practice writing strategies. If only it were actually this easy!

Count:27
Name: Bollinger + sar
Description: Problem with change in bollingerbands when adding psar short condition - and i dont know why. Anyone - any ideas?

Count:27
Name: [Salavi] | Andy Super Pro Strategy
Description: Beware, fearless warriors venturing through market waves— | Andy Super Pro Strategy is here to dominate! This technical indicator is destined to become the star of the Salavi cryptocurrency exchange, garnering attention for its exceptional functionality and advanced features. 🚀 **Supernatural Strategy:** | Andy Super Pro Strategy transcends tradition with its...

Count:27
Name: Golden Short Testing 1.1
Description: New version of Golden Short Strategy based on the golden number theory and is for long positions. It has two parameters: 1. Step to form the body of candle to generate a possible enter 2. Number of steps to form the body of the candle Profit 1: 1:0.61 Risk/Reward Ratio -> WinRate on EURUSD: 61.41% Values on EURUSD: Interval: 1h Step: 0.00022 Body: 3


Count:27
Name: Please help to make Larry Williams' volatility breakthrough.
Description: Hello Traders! I'm going to backtest Larry Williams' volatility breakthrough strategy. However, contrary to my expectation, orders at certain bars are made the next day. Is there anything I missed at my pine script code? Please give me any tiny tips. Thank you!!

Count:27
Name: Turtle Project
Description: so this is my new strategje that is based ont the turtle strategie

Count:27
Name: Open_Range_Strategy_with_dynamic_PT_by_frenchy
Description: Updated version for Option Traders

Count:26
Name: rsisma imkind daily
Description: rsi 14 sma 8 time fram : weekly and daily rsi 14 sma 8 time fram : weekly and daily rsi 14 sma 8 time fram : weekly and daily rsi 14 sma 8 time fram : weekly and daily


Count:26
Name: Golden Long Testing 1.1
Description: New version of Golden Long Strategy based on the golden number theory and is for long positions. It has two parameters: 1. Step to form the body of candle to generate a possible enter 2. Number of steps to form the body of the candle Profit 1: 1:0.61 Risk/Reward Ratio -> WinRate on EURUSD: 66.70% Profit 2: 1:1.61 Risk/Reward Ratio -> WinRate on EURUSD:...


Count:26
Name: DaveStrat
Description: This script attempts to guess inflection points in cryptocurrency asset prices using change in two simple moving averages on the daily timescale.

Count:26
Name: RSI Crossover Strategy 8rookz
Description: RSI Crossover Strategy used to create entry points for increasing relative strength

Count:26
Name: Dales BarUpDn Strategy
Description: long and short buy orders. the option to connect a 3commas bot to it with just the settings box


Count:26
Name: Derivative Based Trends
Description: Uses a combination of moving averages to establish trends, and finite-difference derivative approximations to predict possible reversals. Seems to work best on 1 hour charts of less volatile currency pairs.

Count:25
Name: True Strength Indicator BTCUSD 15p thaieibvn
Description: True Strength Indicator BTCUSD 15p thaieibvn

Count:25
Name: At Specified Time, Execute Order
Description: Sell current holdings at a specified time, then place a buy limit order at 1% the selling price.

Count:25
Name: RSI cross Strategy by alireza v1.1.1
Description: an script for buy and sell signals use it in 2h time

Count:25
Name: Donchian Channel Testing
Description: Conditions: 1. Centre line above close long entry, exit centre line below close. 2. Centre line below close short entry, exit centre line below close. 3. But For now I coded like Long Exit becomes entry for Short and vice versa Have to further Update

Count:25
Name: Strategy weekly results as numbers v1
Description: This script is based on an idea of monthly statistics that have been found across tradingview community scripts. This is an improved version with weekly results with the ability to define the size of every group (number of weeks within one group). Initial setup of the strategy 1. Set the period to calculate the results between. 2. Set the statistic precision...

Count:25
Name: TriautoETF(TQQQ) Short Strategy B1
Description: ○ Objective. This is a strategy for the TQQQ NASDAQ:TQQQ short strategy in the TriAuto ETF . It is used as a hedging short rather than for profit-making purposes. Entry and close points are indicated. ○ Strategy The strategy is to hold a short position when the price falls below the moving average line, which is a market-conscious line that is rarely broken. The...

Count:25
Name: MA_Script
Description: - Entry Point : base on MA20, MA50, MA100, MA200. - Exit Point : base on stop loss, MA and trailing stop.

Count:25
Name: Take America Back Version 1.0
Description: So basically, the when the price goes down a little, it buys, and when it goes up a little it buys. The only indicators are account balances, and the price, that’s it. Now I wish that Pine Script had a function or variable in which I could recall the balances of specific portions of the portfolio, but it doesn’t. So, I had to improvise. Now for this to work...

Count:25
Name: EMA12/26 with date backtest range (BTCpair)
Description: This version including specific back test period function , and default unit per one order is 0.02BTC , if you would like to use it in USD unit please go to setting to change the setting. This script's mainly indicator author is Chaloke.com. this version is just only add strategy back test and specific period function. Thanks😀

Count:25
Name: DUAL RSI
Description: This system uses two RSI's with different settings Fast RSI Lenght is 16, buys when RSI price is oversold @ 91 or lower, and sells when RSI price is overbought at 70 Slow RSI Lenght is 31, buys when RSI price is oversold @ 91 or lower, and sells when RSI price is overbought at 68 Pyramiding is set to 2 since each system should be able to trade in the...

Count:24
Name: EMA crossover - BTC/USD 4hr
Description: This is my first strategy script, and looking at other EMA crossover strategies, there wasn't anything that I have seen which allowed different EMAs to be used for each Enter/Exit signal This uses a long term trend ling (one for Longs, one for shorts) to decide if we are in a bull bear market • If in a bull market, then it will allow for the longs to be opened •...

Count:24
Name: HullMA Strategy--HULL 20
Description: Hisse senedinin hull moving average gibi hızlı bir hareketli ortalamada 20 li paremetrege performansını göstermektedir. Kodu trdingwiewswn alınmıştır.

Count:24
Name: Quarterly Returns in Strategies vs Buy & Hold
Description: This is a Quarterly Returns version of Monthly Returns in PineScript Strategies by QuantNomad This script shows a table of Quarterly/Yearly performance of your strategy. It also provides an option to compare with Buy & Hold. The script can easily integrated to your strategy. All you need to do is copy the table part and paste it at the end of your script ...

Count:24
Name: Bitcoin 15 min crossover SMA Strategy Script
Description: Is a very simple script that must be used on the 15 min chart of BTCUSD, and works. Tested same EA in production since 2016. Use the 200 and 50 SMA to buy and sell. Works well! Enjoi!

Count:24
Name: Trend Continuation
Description: Go long in a positive trend after a correction below a given EMA


Count:24
Name: RSI Strategy
Description: INTRADAY GO WITH SIGNAL AT THE END OF DAY YOU WILL BE IN PROFITS GURANTEE............... Just Take Care of one thing only use it for top tarded counters or most volatine scripts...........


Count:24
Name: 5MA_X_L
Description: This is a 5 day moving average crossing long strategy in 10 min. chart, used in short term momentum trading strategy. Momentum trading Strategy: When S&P 500 index is at up trend (or above 60 sma ), buy 10+ stocks in top 20% stock RS ranking at equal weight using this MA5X_L strategy. Change stocks when any stock exited by algorithm. Back test start since...

Count:24
Name: [VJ] Hulk Smash Intra
Description: This is a simple intraday strategy for working on Stocks or commodities based out on Super Trend and ever reliable ADX . You can modify the start time and end time based on your timezones. Session value should be from market start to the time you want to square-off Important: The end time should be at least 2 minutes before the intraday square-off time set by...

Count:23
Name: Custom Band Strategy
Description: 1. Trend if ema200 > ema30 Long entry only else Short entry only 2. Custom Band Upper band = sma(period) + max(close, period) * multiplier Lower band = sma(period) - max(close, period) * multiplier Multiplier can be either 1.3 or 1.1 depending on the trend. (If trend is long, upper band's factor would be 1.3, lower band be 1.1) 2. Long entry condition -...

Count:23
Name: AlexInc PriceChannel Str
Description: Here is strategy which uses Donchian channel to buy and sell. It needs to be improoved with stop loss due often counter-trent purchases.

Count:23
Name: RSI Etoro Strategy
Description: Tmp (WIP) just for my bro Manu ;) BTW "Used" on COPPER

Count:23
Name: Vortex Cross w/MA Confirmation
Description: This script is a trading strategy that combines the Vortex Indicator and a Moving Average (MA) to generate potential entry signals for long and short positions. 1. Vortex Indicator: The Vortex Indicator consists of two lines: Vortex Positive (VIP) and Vortex Negative (VIM). It is designed to identify trend direction and measure the strength of a trend. 2. Moving...


Count:23
Name: MACD Cross+MA
Description: Strategy MACD cross + Ma cross การเข้าจะเข้าต่อเมื่อมีการ Cross ของ MACD ก่อน แล้วมีการ Cross ของเส้น ma 9,26 ตามมา จากการ Backtest ของผมถือว่าเป้น Indicator ที่ค่อนข้างบอกให้เข้าช้าเลยทีเดียว แต่ใช้ Follow เทรนพอใช้ได้อยู่ครับ แนะนำให้ใช้ในช่วงที่ตลาดเป็นขาขึ้นนะครับ ช่วงหมียาวอย่างปี 2018 Indicator ตั้วนี้ไม่เวิร์คอย่างแรงเลยครับ ในภาพ backtest ตั้งแต่ปี 2019 -...

Count:23
Name: ABUs Euroramp
Description: This strategy backtests the opening ramp of Europe at 9am European time, which is 2am Chicago time ( CME ES timezone ) on the ES Futures Contract. The following conditions are embedded in the strategy: - Market entry at 2 am Chicago time - Size = 2 contracts - Stop = -5 points - TP 1 = +3 points (1 Contract) - Stop to Break even (entry + 0.5) after TP 1 is...

Count:23
Name: gap_bounce_down
Description: basic script to back-test a simple strategy which looks for dead cat bounc

Count:23
Name: Trading Inside Gap - 15 min chart
Description: This code is for educational purposes. Following are the major takeaways from this code 1. Identify the first bar of the series. 2. Using security function to obtain data from a higher Time frame 3. Use of function strategy.risk.max_intraday_filled_orders 4. closing trade at the end of the session The code is in raw form and can be refined/modified to improve results

Count:23
Name: Moving Average Crossover Strategy
Description: moving average crossover startegy 10*30 it indicates when to buy or sell


Count:22
Name: D_Three Ten Osc Strategy Backtest
Description: This indicator allows the user to plot a daily 3-10 Oscillator on a Tick Bar Chart or any intraday interval. Walter Bressert's 3-10 Oscillator is a detrending oscillator derived from subtracting a 10 day moving average from a 3 day moving average. The second plot is an 16 day simple moving average of the 3-10 Oscillator. The 16 period moving average is the...

Count:22
Name: EMA12/26 buy spot only
Description: Inspire by CDC action zone, all thanks should be given to AJ piranya33


Count:22
Name: SirSeff's EMA Rainbow
Description: This strategy uses divergences between three exponential moving averages and their slope directions as well as crosses between the price and these moving averages to switch between a long or short position. The strategy is non-stop in the market and always either long or short.\ This trend trading strategy uses exponential moving averages of 10, 20, 50, 100, 150,...

Count:22
Name: Suchit RSI CCI
Description: Suchit RSI CCI strategy uses the Relative Strength Index and Commodity Channel Index levels and their movement for buy and sell calls

Count:22
Name: EMA SCALPEUR SHORT
Description: I'm trying to find the best EMA's for scalpingm you are able to choose 2 differents EMAs for your enter and 2 differents EMAs for you exit. It's putting entry and exit on the graph

Count:22
Name: Build A Bot Hull Trigger
Description: This is the automated trading system we built during the 60-Minute Build-A-Bot webinar on September 12, 2018. We had a lot of fun, and implemented a TON of indicators LIVE during this webinar! And the best part is that as a group we researched, designed, and built a profitable robot in exactly 60 minutes! We started by voting on the type of trading system, and...

Count:22
Name: Unilateral Pairs Trading
Description: ecco qua il postino pat e con lui ce anche il suo gatto jeff

Count:22
Name: Renko Stock Daily
Description: Hello, This strategy must be use only for stocks. It doesnt work with FOREX or others.. You must use it only for renko candles Best regards


Count:22
Name: meta-capitulation
Description: Tracks the maximal drawdown from a -25% crash over 200 day period.

Count:22
Name: Stock Strat v1
Description: Stock Strat v1 Buy: mom > mom1 and mom1 > mom2 and rsi > 80 Sell: mom < mom1 and mom1 < mom2 and rsi < 80


Count:22
Name: MollyETF_EMA_Crossover
Description: Basic EMA crossover backtesting strategy for Molly's ETF group.

Count:22
Name: Bitpanda Coinrule Template
Description: This strategy for Bitpanda on the Coinrule platform utilises 3 different conditions that have to be met to buy and 1 condition to sell. This strategy works best on the ETH/EUR pair on the 4 hour timescale. In order for the strategy to enter the trade it must meet all of the conditions listed below. ENTRY RSI increases by 5 RSI is lower than 70 MA9 crosses...

Count:21
Name: Estocastoco Lento - DT
Description: Operacional criado pelo Jean Lira - Trader. Basicamente busca uma situação de confirmação de exaustão com o indicador estocastico. Na primeira barra de reversão do movimento, e com o sinal forte do estocastico Lento, no periodo de 5. Gerenciamento de risco com e sem parcial.

Count:21
Name: KST Alert
Description: Just added Alert condition to the default indicator Default timeframe is set to 15m Buy signal initiates when kst line crosses over signal line Sell Signal initiates when kst line crosses under signal line


Count:21
Name: Simple Relative Strength Index
Description: Created this script to simply let us predict buy and sell for RSI 15 and 85 (configurable). It is best use for ETH and monthly chart. Good for people who can not stay for daily trade and only able to trade few times a month. The earning is quite lucrative while ETH is on up trend. However, this will not work when ETH on side way. This only work when ETH is...

Count:21
Name: Strategy Template
Description: This is an example strategy template that is provided to new pinescript users as an example of how to create a strategy. It is based off the example template strategy provided by TradingView. This strategy will show users how to: Use inputs to control variables Set take profits and stop losses Select whether to apply take profits or stop losses or neither ...

Count:21
Name: CMOabsav Backtest
Description: This indicator plots the absolute value of CMO averaged over three different lengths. This indicator plots a classical-looking oscillator, which is really an averaged value based on three different periods. You can change long to short in the Input Settings Please, use it only for learning or paper trading. Do not for real trading.


Count:20
Name: Combining Exponential And Volume Weighting Backtest
Description: The related article is copyrighted material from Stocks & Commodities 2009 Oct You can change long to short in the Input Settings Please, use it only for learning or paper trading. Do not for real trading.

Count:20
Name: [001] Entry_Test [TradeStand]
Description: Entry_Exit_Test . ------------------------------------ Function description ------------------------------------ You can automatically receive an entry alert when the conditions you specify are met. Settlement alerts can be sent automatically when the conditions you specify are met. Three types of moving averages can be...

Count:20
Name: DPD+STOCH RSI +RSI
Description: Combination of DPD ,STOCHRSI and RSI indicators. Be careful for percantage selection to fit your candle size.

Count:20
Name: A simple trading strategy for XTZ/EUR (December 2021)
Description: This is my current trading strategy for XTZ/EUR for this month of December. It tries to avoid pumps/dumps (i.e. does not trade on big candles). It always performs one order in each candle for the trading window of the rebalance bear/bull market indicator (check my profile for it). It has alerts configured so that you can use it in your server/broker (just...

Count:20
Name: GBP combine
Description: 1. stop trading in one side market - use what kind of TA to decide one side market? 2. TA might react differently in different session - inactive session need to RSI 60-40? 3. need to stop trading once daily target is complete? - what is the daily target? 4. How to loss less? - (1) - develop more restriction in strategy?


Count:19
Name: oussamacrypto
Description: What Is an Exponential Moving Average (EMA)? An exponential moving average (EMA) is a type of moving average (MA) that places a greater weight and significance on the most recent data points. The exponential moving average is also referred to as the exponentially weighted moving average. An exponentially weighted moving average reacts more significantly to recent...


Count:19
Name: Engulfing with Trend
Description: The script above is a trading strategy with rules based on the Engulfing candlestick pattern within the context of the trend. Some key elements of this script include: 1. ATR (Average True Range) settings to measure market volatility. 2. Supertrend settings to identify the market trend. 3. Conditions for determining uptrend and downtrend. 4. Determination of...

Count:19
Name: pomila
Description: This video is a detailed video overview of the _CM_Ultimate_MA_MTF_V4 - Multiple Time Frame - V4 Release. I will post the link to the Indicator within a few minutes after this video goes live on TradingView either in the Link to Related Ideas below, or I'll post a comment below with the link. Thanks for you patience. Please Post and feature requests for this...

Count:19
Name: Simple MA strategy
Description: Simple above below MA strategy perfect for long term investors , numbers worked on a 1 for 1 contract basis with enough capital to cover the trades. Heikin ashi 1 hr


Count:19
Name: Mayer Multiple Strategy
Description: Created by Trace Mayer, the Mayer Multiple is calculated dividing the current price of Bitcoin by its 200-day moving average. This simple script allows to backtest strategies based on Mayer Multiple levels, which can be easily adjusted. It can be tested on any chart and any timeframe.

Count:19
Name: SRJ RSI Outperformer Strategy
Description: For Daily timeframe use 100, 40, 21, 200 in input settings. For 15 Minute time frame use 14, 28, 21, 100 in input settings

Count:19
Name: Gold Fair Value Gap Entry(FVG GOLD)
Description: This script calculates the fair value of gold, which is set as an input parameter. It then gets the current price of gold and calculates the gap between the price and the fair value. If the gap is positive, it enters a long trade, and if it's negative, it enters a short trade. The script also uses proper risk management techniques by setting a stop loss and take...


Count:19
Name: Proper lookback period
Description: This will allow you to enter the date when the strategy should start trading. It cancels all orders if the the current bar is older than the date you entered in the input field. Motivation: strategy(lookback) never worked for me and even if it did, it is garbage, because I want to set a date instead of number of bars. I can see on the chart clearly what period is...

Count:19
Name: Tan_Aug09
Description: Crypto pairs: ETH/USDT Time-frame: D1 Based on Heikin Ashi Candle and Exponential Moving Average Indicators Crypto pick: 5D Stock pick: 8D Best work in strong trend. Recommend using with trend line .

Count:18
Name: SOJA PIVOT
Description: Strategy using SOJA HUNTER indicator for buy and Pivot points for sell : -1st TP at R1 with 25% shares -2nd TP at R2 with 25% shares SL using trailing stop.


Count:18
Name: Anand's Strategy
Description: First, we identify the trend, the trend will be determined by the daily candles, whenever the daily candle closes above the high of a previous candle the trend becomes positive and the trend remains positive till the time a candle closes below the lowest price of this candle, however, if the cost of any future candle closes above the high of this candle then the...

Count:18
Name: RSI-2 Larry Connars for 15 min K
Description: Only Long when close > ma120 and rsi < 10 and rsi >1 平倉WHEN close > ma5 and ma1 穿 ma3

Count:18
Name: MA Crossover Alerts
Description: Create option in Alert dialogue box when MAs cross over

Count:17
Name: No Shadow Candles - Backtesting
Description: Testing this strange strategy :) scripted on request

Count:17
Name: Golden Long Testing
Description: These scripts is based on the golden number theory and is for long entries. It has two parameters: 1. Number of pips of the body of candles to put an entry 2. Number of contracts to put on 3 orders executed at the same time

Count:17
Name: Golden Short Testing
Description: This scripts is based on the golden number theory and is for short entries. It has three parameters: 1. Step of the body i.e: pip-0.0001, cents-0.01 2. Number of steps of the body of the candle 2. Number of contracts to put on 3 orders executed at the same time


Count:17
Name: [Salavi] | Andy Advance Pro Strategy
Description: Introducing the revolutionary | Andy Advance Pro Strategy – a cutting-edge technical indicator designed exclusively for the Salavi cryptocurrency exchange. This avant-garde indicator stands as a beacon of sophistication and profitability, offering users an unparalleled trading experience. 🚀 **Pinnacle of Coolness:** With its sleek algorithms and advanced...

Count:17
Name: Gage Strategy
Description: Based on Divergence and hidden divergences, most useful when using the Money Flow Index to spot the reversal and locate the bottom of the market.

Count:17
Name: @@rp_Indicator
Description: god for long term investment. follow this for momentum investing.

Count:17
Name: Eltrut
Description: Turtle inverted. Long when 1. 7 period high broken 2. trendflex below 1 3. inside 35,3 bollinger band

Count:17
Name: Daily_Mid Term_Consulting BOLT
Description: Daily Mid Term Consulting BOLT es una estrategia a mediano y largo plazo creada para detectar los cambios tendenciales en zonas de tiempo diarias. se basa en el análisis de los cambios porcentuales que sufre el precio contra las distintas medias móviles simples definidas en la estrategia. el uso de osciladores como el MACD , RSI y EFI apoyan la decisión de...


Count:17
Name: Long Term
Description: The Strategy is to buy based on Stan which is long term strategy on stocks. This works on 30WEEK And RSI indicator which helps to understand when to enter stock and when not to. Additionally due to fast moving trades, added logic of crossover of close price above 50DMA

Count:17
Name: Power Zonessssss
Description: Powerfull buy snd asell strategy for the good buying sn f [rofi


Count:16
Name: MCL-YG Pair Trading Strategy
Description: This strategy uses Bollinger Band breakouts to detect buy and sell signals on a correlated pair of assets.

Count:16
Name: XTZ trading strategy for Bear months
Description: This is my 3rd approach into trading XTZ. It is tuned into bear months and needs to work for at least 30 days. It looks at the rebalance oscillator and bear market indicator and tries to find a position in the market that does not lose money within the month. Use the cog icon to update the trading window to fit previous months, and check out the data window for...


Count:16
Name: GMH : ATH 200d
Description: All-Time High Strategy for Tech Stock In a bull market where valuation is completely neglected. For risk protect we choose a trade set up with stock that is going its break all time high. Given All-Time High days as input parameter for strategy. And stoploss by ema crossunder. Should give decent profit factor for bull run.


Count:16
Name: Advanced EMA Cross with Normalized ATR Filter, Controlling ADX
Description: Description: This strategy is based on EMA cross strategy and additional filters are used to get better results, a normalized ATR filter, and ADX control... It aims to provide traders with a code base that generates signals for long positions based on market conditions defined by various indicators. How it Works: 1. EMA: Uses short (8 periods) and long (20...


Count:16
Name: Alex Days HiLo Rajib
Description: 20 Days High Low Breakout , can be as Contrarian Way or in Trending Way


Count:16
Name: eswaran ab
Description: //@version=5 strategy("MACD Strategy", overlay=true) fastLength = input(12) slowlength = input(26) MACDLength = input(9) MACD = ta.ema(close, fastLength) - ta.ema(close, slowlength) aMACD = ta.ema(MACD, MACDLength) delta = MACD - aMACD if (ta.crossover(delta, 0)) strategy.entry("MacdLE", strategy.long, comment="MacdLE") if (ta.crossunder(delta,...


Count:16
Name: sonu1997
Description: full banchod Information technology (IT) companies will kick off the first-quarter earnings season in July amid expectations they will post strong revenue growth, offset by pressure on profit margins exerted by higher. wage costs. IT companies including Infosys and HCL Technologies are unlikely to change their full-year guidance despite concerns of a recession in...


Count:15
Name: CROSS_ALGO SYSTEM
Description: Crossover Strategy using exponential moving averages with entry and exits.

Count:15
Name: RI test
Description: summ close-close in period inter long in first cross in negative value of summ exit long in first cross in postive value of summ

Count:15
Name: Two Moving Average Cross test
Description: Published for testing the tradingview strategy finder

Count:15
Name: Koushik_&_Arpan_Indicator
Description: this will give proper entry to a chart. Also exit will come timely.

Count:15
Name: Volume Extra (@ulong_Mask)
Description: High volume illumination You can choose which volume to highlight

Count:15
Name: Supertrend TEST Strategy
Description: супер тренд ааааааываыв вдрплввр арапр ыапап опвоапо

Count:15
Name: SQV Cross
Description: This strategy is used to find tickers that do well when SPY and QQQ are up and VIX is down. This uses EMA's on the user defined resolution to define direction of each ticker. Trades are entered upon crossover. EMAs are user defined as well.

Count:15
Name: Supertrend TEST 2 Strategy
Description: ры вап вп ывапвыап вып выап вар блооЫВУп м лрп чс апр пб ою а рырб по а ап


Count:15
Name: Keltner Channel Strategy with Golden Cross
Description: Only trade with the trend. This Keltner Channel-based strategy that will only enter into a trade if the signal of the Keltner Channel agrees with a moving average crossover as defined by the user. Long Position Entries 2 Conditions must be present 1. There must be a Golden Cross (lower period moving average is above higher period moving average). ex 50...

Count:15
Name: EMA Strat
Description: If previous day close above EMA, enter long at open the following day. Exit long position if prices close below EMA.


Count:14
Name: Based RSI (BullDozz)
Description: Installation: To use this script, open TradingView and create a new Pine Script strategy. You can paste the code provided into the Pine Script editor. Customizable Inputs: The script includes various input parameters that you can customize to fit your trading preferences. These parameters are defined using the input function and include values like length,...

Count:14
Name: MovingAvg Lines
Description: Possibility that you use four lines with different values. And that lines calculate a simple moving average. In my use, I put the numbers 9, 21, 72 and 200.

Count:14
Name: no dice
Description: Allow this strategy to run on it's own and try not to get your emotions involved by manually closing positions. Let the strategy do all the work and you will see good returns every month.

Count:14
Name: Astor SMA20/60
Description: 我看網路上都是用英文打的 所以我就用中文來打一個吧 不然對很多人來說英文真的很難看得懂 1. 可以設定回測開始時間 2. 簡單利用均線的策略


Count:14
Name: Tendies Heist Auto Compounding Example
Description: This is an example of how we can use compounding to control our position size. This example shows how we can automatically add and reduce position size based on account equity. The "initial capital" in properties is the starting account equity. At default its set to 100,000. If our max position size is set to 25 then the very first position that's taken has a...


Count:14
Name: CoinFlip Indicator + Strategy
Description: Flip a coin every Monday. Heads, go long. Tail, go short. Stoploss at 1 ATR, and Take profit at 1 ATR too. 1:1 risk to reward ratio. After backtesting 2018, 2019, and 2020 with 28 major currency pairs. We are getting close to a 50% win rate with an 8% standard deviation. Believe it or not, this simple performs better than lots of the popular indicators out...

Count:14
Name: 3 Indicator Strategy Backtest
Description: Use 5 min, hourly and daily EMAs vs Close prices to decide when to buy

Count:13
Name: Date Range Demonstration
Description: This is a simple strategy that demonstrates how to easily incorporate a date range into a strategy. This allows you to limit your backtesting to a specific range of dates, which is vital if you want to compare different time frames. To use: Copy the code block between the '////' lines into your strategy. Add the variable 'inDateRange' to your entry and/or...

Count:13
Name: Test strat charlot citron
Description: Test strat charlot citrondsfsdfsdf sôkfsd$*pokf*$psf slf*^sdkf*sd^pf l*^fs;*^fskd*^psdf *sp^zqf;s*d^pofplks*^pfok

Count:13
Name: Brad VWMACD Strategy 2233
Description: Volume Weighted MACD. DO NOT USE AS STANDALONE. THEY ARE GUNNING FOR yOUR MONeY. Or if you use standalone, use only small fraction of your funds. NOT FINANCIAL ADVICE, PAST RESULTS OFTEN ARE COUNTER TO FUTURE RESULTS. What worked in the past is usually what will NOT work in future. I tried not to overtune this and it works great some months, terrible other...

Count:13
Name: My Strategy
Description: This is for educational purpose. Strategy is a test strategy to take long and short position

Count:13
Name: EMA SCALPEUR LONG V2
Description: THIS IS A TRY TO FIND THE BEST EMAS FOR SCALPING YOU HAVE 4 EMAS, YOU CAN CHOOSE 2 FOR THE ENTER This a try to find the best EMAs for scalping you have 4 EMAs, 2 to find the best enter possible and 2 others to find the best way out possible


Count:13
Name: EMA Crossover Trade Strategy (Useless)
Description: EURUSD - 1H - 800+ Trade - 0.79$ profit, what a great work

Count:13
Name: Try Me I'm New
Description: This script can be used on the Forex Majors. When you apply it to the chart open the properties box and click the 'recalculate after update' box. It open only long positions when the conditions are met. This is my very first attempt so dont crit me too much.

Count:13
Name: JetzGiantz Strategy
Description: The algorithm for this strategy was provided by JetzGiantz. It creates buy and sell signals based on the close and open prices of the previous 3 bars, and compares them to the lowest low, or highest high, between the last 3 and 50 bars. You can select the month and year you wish to backtest. You can enter the SL and TP values. There are no other inputs.

Count:12
Name: Practice RSI, HA, Positions- DONTUSE
Description: Just practicing adding multiple indicators conditions and position size conditions to a strategy with signals.

Count:12
Name: Time Session Filter - MACD example
Description: Time Session Filter in TradingView Strategy: A Comprehensive Guide Welcome to this educational TradingView blog where we dive deep into the functionality and utility of the time session filter in trading strategies. It's interesting to note that the time session filter is a commonly overlooked feature in Pine Script, often not integrated into overall trading...

Count:12
Name: CS: 2 Moving Averages Script - Strategy (Testing)
Description: 2 Moving Averages Trading Script - Strategy Version (For Backtesting)


Count:12
Name: [002] DAY_MA_Pass [TradeStand]
Description: Cond_for_Day_MA ------------------------------------ Function description ------------------------------------ You can automatically receive an entry alert when the conditions you specify are met. Settlement alerts can be sent automatically when the conditions you specify are met. Three types of moving averages can be...

Count:12
Name: 均線操作-月季
Description: TestTestTestTestTestTestTestTestTestTestTestTestTestTestTestTestTestTestTestTestTestTestTestTestTestTest TestTestTestTestTestTestTestTestTestTestTestTestTestTestTestTestTestTestTestTestTestTestTestTestTestTest TestTestTestTestTestTestTestTestTestTestTestTestTestTestTestTestTestTestTestTestTestTestTestTestTestTest TestTestTestTestTestTestTestTestTestTestTestTestTest...

Count:12
Name: test_%_down_up
Description: Strategy for testing efficiency of strategies based on % retrace from local top based on modifiable range.

Count:12
Name: Orderbug
Description: This script demonstrate what I don't understand - according to documentation with order managements The from_entry parameter should execute the exit on this specified trade. The chart shows the right information, but the list of trades, in the Strategy tester panel doesn't make sense: This is an extract of the CSV file I got from this script: The enter1 ...

Count:12
Name: simple momentum
Description: It's a simple momentum script: - go long if A positive closes in a row, exit after B negative closes - go short if C negative closes in a row, exit after D positive closes


Count:12
Name: Arpan_Koushik_5_EMA
Description: Arpan_Koushik_5_EMA is an extended EMA indicator, which will provide perfect buy and sell call.

Count:11
Name: hà tỷ phú 999
Description: xin chào chúng tôi rất vui vì có1 chiến lược cho mọi người xem đầu tiên là cái thứ nhất sau đó là cái thứ 2

Count:11
Name: Average Directional Index v2
Description: This script uses another method of obtaining the price with each tick. The combination of gap settings and price data provide a good ADXx plot that does not repaint by default.

Count:11
Name: Soren test 222
Description: Say we use strategy.risk.allow_entry_in() to only trade longs. When our script uses the strategy.entry() function to open a short trade, TradingView of course won’t allow our strategy to go short. But that doesn’t mean the trade is ignored. Instead the ‘enter short’ trade – which is actually a sell command – becomes an ‘exit long’ order. Another way to think...

Count:11
Name: 80-20
Description: Indicator which shows candles which have open or close in top or bottom 20% of the range.

Count:11
Name: 2 and 2 Strategy
Description: 2 Moving Averages 2 profit Targets 29% in backtesting on daily USDCAD

Count:11
Name: VSR-DZ 2H_
Description: Bitcoin Futures 30min_ Scalping Strategy 1. The winning rate and the earning rate are high 2. We sell about 50 units in a month 3.Leverage applicable (30X or less) 4. Please make up more than three-thirds of the deposit for the seed 5. There is no repainting 6. Watch out for the sideways section


Count:11
Name: Repaint Demonstration in Security Function Call using Higher TF
Description: Many Coders mistakenly use Security Function call on their backtest without knowing that the security function does look forward in the future and provide an unrealistic repainted result. This Script's purpose is to give out a clear demonstration of how the security function does look forward in the data and should NOT be used by any means as a real trading...

Count:10
Name: Bar Color Gr38612
Description: I could not find a script to try this so I created one.


Count:10
Name: EMA Slope AyE
Description: We create our own indicator to calculate the slope of a 50 period EMA over the last 3 candles.

Count:10
Name: Otseneyer Strenght Strategy
Description: This strategy shows if the market is strong or weak, marking short or long respectively, however this does not represent a direct entry, only a strength or weakness, which applied with some other parameters (candlestick patterns, resistances, etc) can throw us a very good entry, especially in the appropriate temporality, where there is a balance between volatility...

Count:10
Name: SL1 Pips after TP2 (MA)
Description: SL1 Pips after TP2 (MA) Stop Loss 01 of the Target 02 Double for Moving Average - EMA & WMA

Count:10
Name: AlexInc's Bar v1.2
Description: Публикую новую версию моего скрипта для BTCUSD . Работает для таймфреймов 45 мин, 1 ч, 2 ч. Отличается от предыдущей, что для сигнала BarColor используются только значимые свечи, т.е. те, у которых длина больше условного значения. Считаю, это сделает стратегию более гладкой. Now I publish new version of my BTCUSD strategy script. It works for 45m, 1h, 2h...

Count:10
Name: SMA 10/100 Crossover Strategy intended for BTCUSD on 4 hourly
Description: A really simple trend/momentum following crossover strategy intended for higher timeframes to trade BTCUSD and other crypto pairs.


Count:9
Name: Breakout Strategy with Modified Bollinger and RSI
Description: Description: This trading strategy is designed to detect breakouts using a combination of Bollinger Bands and a modified Relative Strength Index (RSI). Key performance indicators from recent tests include: Net Profit: $0.16 USD (0.02%) Total Closed Trades: 27 Percent Profitable: 77.78% Profit Factor: 4.771 Maximum Drawdown: $0.04 USD (0%) Average Trade: $0.01...


Count:9
Name: tw.tha_V1 EMA
Description: EMA Fibonacci V1 #tw.tha_V1 //@version=5 strategy(" tw.tha_",overlay=1) a = input.int(8, "EMA 1", minval=1, maxval=9999999, step=1) b = input.int(13, "EMA 2", minval=1, maxval=9999999, step=1) c = input.int(21, "EMA 3", minval=1, maxval=9999999, step=1) d = input.int(34, "EMA 4", minval=1, maxval=9999999, step=1) e = input.int(55, "EMA 5", minval=1,...


Count:9
Name: EMA Cross V1 for eth 4H
Description: For ETH in Bullish Zone (Time frame 4H) Condition Back test - 50% of Equity (for decrease max drawdown less than 15%) Warning : Many fake signals are in Sideway or Bearish.

Count:9
Name: Doji Trading Strategy
Description: A doji names a trading session in which a security has an open and close that are virtually equal, which resembles a candlestick on a chart. The word doji comes from the Japanese phrase meaning “the same thing.” A doji candlestick is a neutral indicator that provides little information.

Count:9
Name: function bug
Description: Functions with parameters do not work correctly: the returned value is sometimes different from the expected one. The example script works correctly only when idx = 1 (instead of the current line 6).

Count:8
Name: sachin5986
Description: using EMA 3 and 21 moving average and showing buy and sell signal to on chart with selected time frame

Count:8
Name: BTC/USD - RSI
Description: IF RSI (14) reaches 68 ... sell 1 lot size ( with TP 250 points and SL 500 points) IF RSI (14) reaches 27 ... buy 1 lot size ( with TP 250points and SL 500 points) IF RSI (14) reaches 80 ... sell 1 lot size ( with TP 250 points and SL 500 points) IF RSI (14) reaches 18 ... buy 1 lot size ( with TP 250points and SL 500 points)

Count:8
Name: NSRDMKVIC
Description: this is a test indicator that evaluate the market and entry and exit positions gain fortune


Count:8
Name: VOLLY PRICE CONVERGE
Description: Triggers: Long = Price and Volume ma's move up Close trade = crosses ma, volume and price move in different directions

Count:8
Name: SMA Crossover demo
Description: Hi I'm currently in the process of learning to write a script. Here's a very basic SMA 34/5 crossover script. Is somebody able to help me with adding the following functions to the script. 1. Add an alert and indicator to close a short or long trade whenever any candle touches the SMA 34 line? 2. When a SMA 34/5 Crossover has been executed (a Short Trade...

Count:8
Name: NinjaTrader Automation Example Script
Description: NinjaView Alert Testing Script for TradingView Introduction: This script is explicitly crafted to assist users in testing and simulating various order alerts on TradingView. Its core functionality is centered on producing different order types, allowing users to gain insights into how these alerts are formatted and function. This script plays an essential role...


Count:8
Name: fiveema
Description: // © CarterTsai //@version=4 strategy(title="ema_example", shorttitle="ema_example", overlay=true) plot(ema(close, 12), title="12ema", color=color.white, linewidth=1) plot(ema(close, 144), title="144ema", color=color.yellow, linewidth=1) plot(ema(close, 169), title="169ema", color=color.orange, linewidth=1) plot(ema(close, 576), title="576ema", color=color.blue, ...

Count:7
Name: Parable Oscillator
Description: Looking for highs and lows in the indicator shows early "breakouts".


Count:7
Name: Sma crossover
Description: Sma of 5 cross over sma of 21 periods. Testing stratgy writer

Count:7
Name: Trend Ravi Trial
Description: Trial for trend analysis it was not difficult to convert to look like and work like Trend Trader Karan's Tool, who invested " Lakho Rupaya" and works on the basis of price action trading also. Let me tell you guys, this is nothing but an ATR based system which people already traded as Half Trend, Super Trend and various names. Half Trend is no more a copyrighted...


Count:6
Name: LONG SAZB $
Description: This strategy combines the use of: -The MTF EMA to detect trends. -The MACD to create Long and Short Buy signals. -The ATR for setting Stop Losses and Take Profits. This works well with many different crypto and fiat pairs, but it must be optimized for the certain behavior of the currency pair. Its optimal use is strong trends, not so profitable when...

Count:6
Name: Sensex High-Low Strategy
Description: a pine script strategy using chatgpt for educational purpose only

Count:5
Name: MA Tester Need Help please ;)
Description: Hello, I'm new in scripts. I build this one based on the MACD Strategy one but it look like mine don't plot buy and sell arrows on my chart, why? thanks for help

Count:5
Name: Help with SMA Crossover Demo script
Description: Hi I'm currently in the process of learning to write a script. Here's a very basic SMA 34/4 crossover script. Is somebody able to help me with adding the following functions to the script. 1. Add an alert and indicator to close a short or long trade whenever any candle touches the SMA 34 line? 2. When a SMA 34/4 Crossover has been executed (a Short Trade...


Count:5
Name: Test1 based on Awesome and MACD oscillator
Description: If you know how to set stop-loss and take-profit limit based on prices, not tick, please comment. Thanks!!

Count:5
Name: tw.tha_V2 EMA
Description: EMA Fibonacci V2 #tw.tha_V2 //@version=5 strategy(" tw.tha_",overlay=1) lot= input.float(0, "Lot", minval=0, maxval=999, step=0.5) a = input.int(8, "EMA 1", minval=1, maxval=9999999, step=1) b = input.int(13, "EMA 2", minval=1, maxval=9999999, step=1) e = input.int(55, "EMA 5", minval=1, maxval=9999999, step=1) f = input.int(89, "EMA 6", minval=1,...

Count:4
Name: First script to be optimized
Description: Please, if you can help me to set stop-loss and take-profit rules based on prices and not on ticks, please comment that!

Count:4
Name: VSR-DZ 1H_
Description: Bitcoin Futures 30min_ Scalping Strategy 1. The winning rate and the earning rate are high 2. We sell about 50 units in a month 3.Leverage applicable (30X or less) 4. Please make up more than three-thirds of the deposit for the seed 5. There is no repainting 6. Watch out for the sideways section


Count:3
Name: Bollinger Bands Strategy
Description: strategy("Bollinger Bands Strategy", overlay=true) source = close length = input.int(20, minval=1) mult = input.float(2.0, minval=0.001, maxval=50) basis = ta.sma(source, length) dev = mult * ta.stdev(source, length) upper = basis + dev lower = basis - dev buyEntry = ta.crossover(source, lower) sellEntry = ta.crossunder(source, upper) if (ta.crossover(source,...

Count:3
Name: Parabolic Breakout Indicator (Monthly Only)
Description: Identifies strong buy signals when the RSI hits a 36-month high and one of two MACD signals also reaches a 36-month high. Ideal for catching once-in-a-lifetime breakouts.

